OPEN-SOURCE SCRIPT
Thrax - Intraday Market Pressure Zones
THRAX - INTRADAY MARKET PRESSURE ZONES
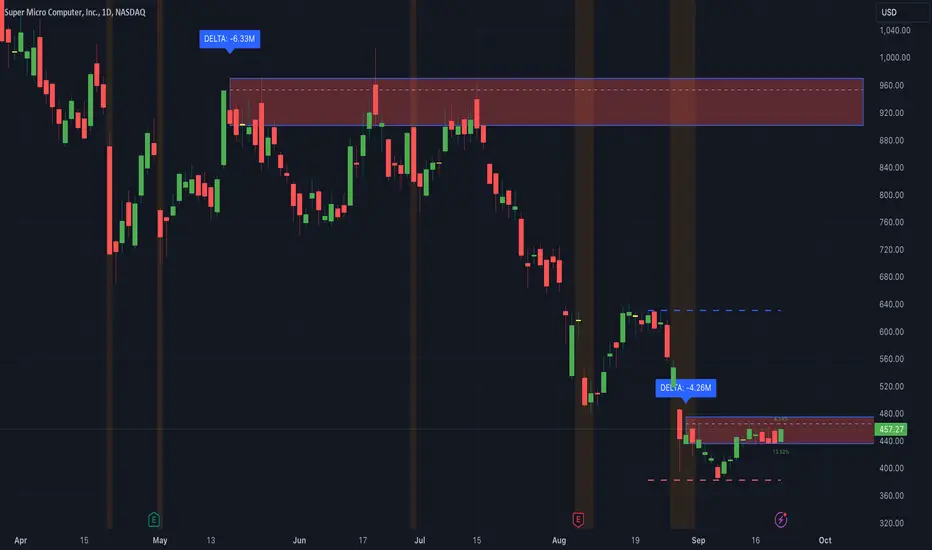
This indicator identifies potential support and resistance zones based on areas of significant market pressure. It dynamically plots these zones and adjusts their visibility based on real-time price action and user-defined thresholds. The indicator is useful for traders seeking to understand intraday market pressure, visualize zones of potential price reversals, and analyze volume imbalances at critical levels.
1. Support/Resistance Zones: Wherever the price retraces significantly from its high a support zone is drawn and when it retraces significantly from it low a resistance zone is drawn. The significant retracing is measured by the wick threshold percentage. For instance, if set to 75%, it implies price retracement of 75% either from high or from low for a particular candel
Volume delat: Displays volume delta information where the zones are formed. This can be used by trader to consider only those zones where delta is significant.
2. Breakout Detection: Monitors for price breakouts beyond established zones, deleting zones that are invalidated by price movement. when the price breaks a given zone with the threshold, it is considered to be mitigated and chances of trend continuation is decent.
Candle Coloring: Uses color codes (green, red, and yellow) to represent bullish, bearish, and indecisive (doji) candles, aiding quick visual assessment.
1. Wick Threshold (%): Sets the minimum wick percentage required for a candle to be considered a support or resistance candidate.
2. Breakout Threshold (%): Determines the percentage above or below a support or resistance zone that defines a breakout condition. if breaks a zone with the set threshold then the zone will be considered mititgated.
3. Max Number of Support/Resistance Zones: Limits the maximum number of support/resistance zones displayed on the chart, ranging from 1 to 5.
4. Show Wick Percentage Labels: Toggles the display of percentage values for upper and lower wicks on each candle.
Bonus Tip : Mark your significant highs and lows from where prices have retraced multiple times in the near past and if the zone is near these levels it can serve s a strong candidate of support or resistance
Therefore, in conclusion monitor the zones, based on delta and volume presence filter out the zone, wait for price retracement to the zone, intiate the trade with stop loss below zone with a set percentage.
This indicator identifies potential support and resistance zones based on areas of significant market pressure. It dynamically plots these zones and adjusts their visibility based on real-time price action and user-defined thresholds. The indicator is useful for traders seeking to understand intraday market pressure, visualize zones of potential price reversals, and analyze volume imbalances at critical levels.
1. Support/Resistance Zones: Wherever the price retraces significantly from its high a support zone is drawn and when it retraces significantly from it low a resistance zone is drawn. The significant retracing is measured by the wick threshold percentage. For instance, if set to 75%, it implies price retracement of 75% either from high or from low for a particular candel
Volume delat: Displays volume delta information where the zones are formed. This can be used by trader to consider only those zones where delta is significant.
2. Breakout Detection: Monitors for price breakouts beyond established zones, deleting zones that are invalidated by price movement. when the price breaks a given zone with the threshold, it is considered to be mitigated and chances of trend continuation is decent.
Candle Coloring: Uses color codes (green, red, and yellow) to represent bullish, bearish, and indecisive (doji) candles, aiding quick visual assessment.
INPUTS
1. Wick Threshold (%): Sets the minimum wick percentage required for a candle to be considered a support or resistance candidate.
2. Breakout Threshold (%): Determines the percentage above or below a support or resistance zone that defines a breakout condition. if breaks a zone with the set threshold then the zone will be considered mititgated.
3. Max Number of Support/Resistance Zones: Limits the maximum number of support/resistance zones displayed on the chart, ranging from 1 to 5.
4. Show Wick Percentage Labels: Toggles the display of percentage values for upper and lower wicks on each candle.
TRADE SETUP
- Identifying Entry Points: Look for the formation of support or resistance zones. Wait for price to retrace to these zones. if you are willing to take risk, you can consider even zones with low delta. If you want to be more cautious you should consider zones with high delta.
- Volume Confirmation: Use the volume information to confirm the strength of the zone. Strong volume differences (displayed as labels) can indicate significant market pressure at these levels.
- Breakout Trades: If price breaks through a support/resistance zone by more than the breakout threshold, consider this a signal for a potential trend continuation in the breakout direction.
- Risk Management: Set stop-loss levels slightly outside of the identified zones to minimize risk in case of false breakouts. This can be set in input setting for breakout threshold.
Bonus Tip : Mark your significant highs and lows from where prices have retraced multiple times in the near past and if the zone is near these levels it can serve s a strong candidate of support or resistance
Therefore, in conclusion monitor the zones, based on delta and volume presence filter out the zone, wait for price retracement to the zone, intiate the trade with stop loss below zone with a set percentage.
오픈 소스 스크립트
트레이딩뷰의 진정한 정신에 따라, 이 스크립트의 작성자는 이를 오픈소스로 공개하여 트레이더들이 기능을 검토하고 검증할 수 있도록 했습니다. 작성자에게 찬사를 보냅니다! 이 코드는 무료로 사용할 수 있지만, 코드를 재게시하는 경우 하우스 룰이 적용된다는 점을 기억하세요.
면책사항
해당 정보와 게시물은 금융, 투자, 트레이딩 또는 기타 유형의 조언이나 권장 사항으로 간주되지 않으며, 트레이딩뷰에서 제공하거나 보증하는 것이 아닙니다. 자세한 내용은 이용 약관을 참조하세요.
오픈 소스 스크립트
트레이딩뷰의 진정한 정신에 따라, 이 스크립트의 작성자는 이를 오픈소스로 공개하여 트레이더들이 기능을 검토하고 검증할 수 있도록 했습니다. 작성자에게 찬사를 보냅니다! 이 코드는 무료로 사용할 수 있지만, 코드를 재게시하는 경우 하우스 룰이 적용된다는 점을 기억하세요.
면책사항
해당 정보와 게시물은 금융, 투자, 트레이딩 또는 기타 유형의 조언이나 권장 사항으로 간주되지 않으며, 트레이딩뷰에서 제공하거나 보증하는 것이 아닙니다. 자세한 내용은 이용 약관을 참조하세요.