INVITE-ONLY SCRIPT
Omega
업데이트됨
While others Seek Alpha, we seek Omega™
Market tops and Bottoms on any time frame and at your fingertips
Leave Nothing On The Table
Stop Guessing - Start Profiting - Stop Watching - Start Living
Enjoy,
Arbitrage Trade Team
Market tops and Bottoms on any time frame and at your fingertips
Leave Nothing On The Table
Stop Guessing - Start Profiting - Stop Watching - Start Living
Enjoy,
Arbitrage Trade Team
릴리즈 노트
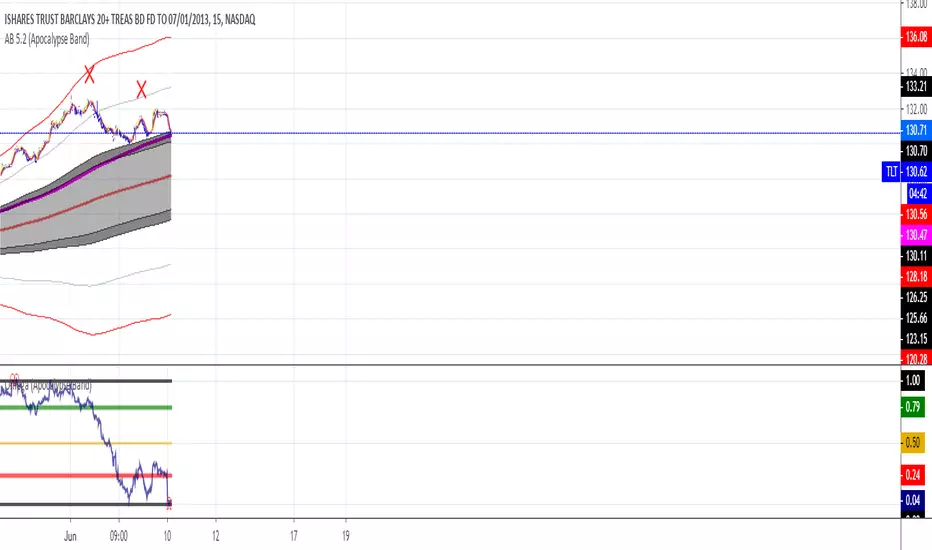
Alerts AddedOmega crossing under green line - Down Entry
Omega crossing over red line - Up Entry
Omega = 1 - Topping Detected
Omega = 0 - Bottoming Detected
Fibonacci retracements ratios are often used to identify the end of a correction or a counter-trend bounce. Most reversals happen between 38.2 and 61.8 since this covers the larger part of the volatility range and is closest to the stock’s average price and momentum.
Think of Fibonacci retracement ratios like the presto-logs from Back to the Future III. And just in case you don’t know what a presto-log is, here is a quick overview on it’s origin. It was an artificial fuel for wood burning stoves developed in the 1930’s as a means of recycling the sawdust from sawmills.
So in Back to the Future, Dr. Emmett Brown created his own. In his adaptation, each log would burn hotter based on color; green being the coolest and least volatile and red being the hottest and most volatile.
Well in Arbitrage, Fibonacci retracement ratios are used as a way to illustrate support and resistance within the Omega™ Indicator. So as volatility increases and decreases, these lines help to mark subtle changes in speed and volatility.
Pro Tip: Down happens fast and is at the bottom of the Omega Range and up happens slowly and is near the top.
As an buy trend progresses volatility and momentum eventually reaches 0 and the equity tops. Likewise when a downtrend begins it accelerates until it reaches terminal velocity and then begins to slow down because it is not maintainable.
Enjoy,
Arbitrage Trade
릴리즈 노트
updated to version 5 of the pine editor language and added cross time frame analytics. 초대 전용 스크립트
이 스크립트에 대한 접근은 작성자가 승인한 사용자로 제한되며, 일반적으로 지불이 필요합니다. 즐겨찾기에 추가할 수 있지만 권한을 요청하고 작성자에게 권한을 받은 후에만 사용할 수 있습니다. 자세한 내용은 aixguru에게 문의하거나 아래의 작성자의 지시사항을 따르십시오.
트레이딩뷰는 스크립트 작성자를 100% 신뢰하고 스크립트 작동 원리를 이해하지 않는 한 스크립트 비용을 지불하고 사용하는 것을 권장하지 않습니다. 대부분의 경우 커뮤니티 스크립트에서 무료로 좋은 오픈소스 대안을 찾을 수 있습니다.
작성자 지시 사항
″Speed of trend
차트에 이 스크립트를 사용하시겠습니까?
경고: 액세스를 요청하기 전에 읽어 보시기 바랍니다.
면책사항
이 정보와 게시물은 TradingView에서 제공하거나 보증하는 금융, 투자, 거래 또는 기타 유형의 조언이나 권고 사항을 의미하거나 구성하지 않습니다. 자세한 내용은 이용 약관을 참고하세요.