INVITE-ONLY SCRIPT
Earnings Master (EM) V1.0
업데이트됨

Earnings Master (EM)
- As an Investor/ Trader, while analysing the tradingview charts, he/she may quickly like to see some of the fundamental data like the financial health of the company which may help to shortlist the list of stocks to pick.
- It will be great if he can see the last few quarters or years earnings, to make informed decisions based on detailed financial data.
- A person may be interested to see the last few quarters sales data, Profit data, EPS, etc.
- Normally he/she has to go to some other fundamental websites to see these data, which will be highly time consuming and a hectic process if he is going through hundreads of charts per day.
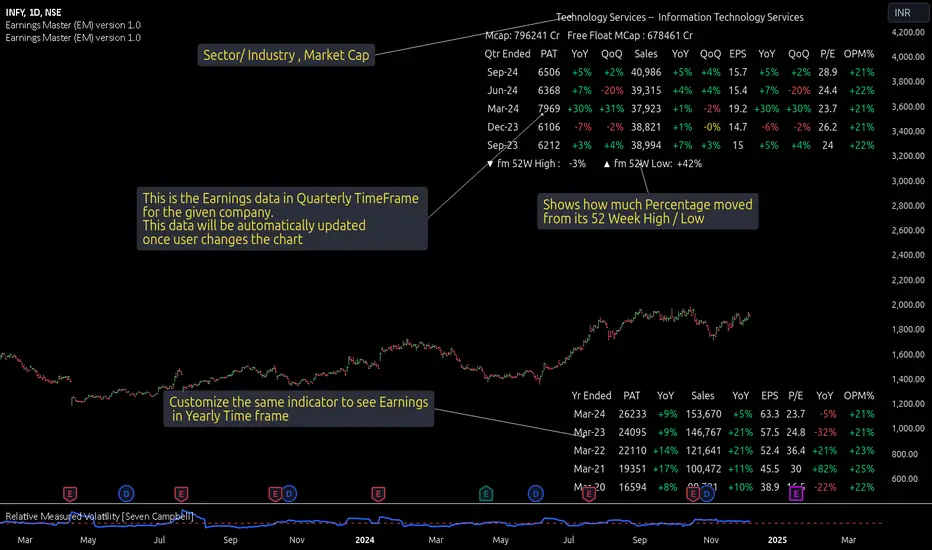
- Thanks for our new Indicator Earnings Master (EM). This indicator is designed to provide detailed financial insights into a company's performance by displaying key financial metrics such as Profit After Tax (PAT), Operating profit margin (OPM), Earnings Per Share (EPS), Total Revenue etc.
- The indicator also calculates and visualizes the percentage changes in these metrics over different quarters, offering a comprehensive view of the company's financial health.
- Also it provides sector/Industry details and percentage up from 52-week low and down from 52-week high
Features:
Table Display:
A customisable table that can be viewed in both Dark and light themes
A customisable table that can be positioned in various locations on the chart (e.g., top left, top center, bottom right, etc.).
Color-coded values to indicate positive and negative changes in financial metrics.
Dynamic text size and color for better readability.
Financial Metrics:
PAT (Profit After Tax): Displays the PAT values for the current and previous quarters.
Industry and Sector: Displays the industry and the particular sector of the company
EPS (Earnings Per Share): Displays the EPS values for the current and previous quarters.
Total Revenue: Shows revenue values in crores (Cr) for multiple quarters.
Free Float: Represents the number of freely floating shares.
Quarter-over-Quarter (QoQ) Change: Computes the percentage change in PAT and sales for different quarters.
Sales in Crores: Displays sales values in crores (Cr) and calculates the QoQ changes.
Operating profit margin (OPM): which is a financial ratio that measures how much profit a company makes on sales after paying variable production costs
Inputs
User inputs for table position, Dark mode , and calculation periods for earnings.
- Option to show/hide Borders
Also can customise the indicator to show/hide the following table fields
- Show Sector
- Show Mcap/ Free Float Mcap?
- Show Earnings
- Show 52w High/Low stats
How to Use:
Add the Earnings Master indicator to your TradingView chart.
Customize the table position and color mode as per your preference.
Analyze the displayed financial metrics and percentage changes to gain insights into the company's performance.
Use the color-coded values to quickly identify significant changes and trends in PAT, EPS, revenue, and other key metrics.
Example Output:
In Quarter Ended mode the table will display the following fields
Quarter Ended period values
- PAT Quarterly values
- PAT YoY in percentage
- PAT QoQ in percentage
- Quarterly Sales values
- Sales YoY in percentage
- Sales QoQ in percentage
- EPS values
- EPS YoY in percentage (Option available to show/hide)
- EPS QoQ in percentage (Option available to show/hide)
- Price To Earnings (P/E) ratio
- Operating profit margin (OPM)
In Year Ended mode the table will display the following fields
- Year Ended period values
- PAT Quarterly values
- PAT YoY in percentage
- Yearly Sales values
- Sales YoY in percentage
- EPS values
- Price To Earnings (P/E) ratio
- Price To Earnings (P/E) ratio YoY in percentage
- Operating profit margin (OPM)
릴리즈 노트
Added more inputs for color customization - industry label color, Up/ Down Color 릴리즈 노트
chart udpate릴리즈 노트
chart update초대 전용 스크립트
이 스크립트에 대한 접근은 작성자가 승인한 사용자로 제한되며, 일반적으로 지불이 필요합니다. 즐겨찾기에 추가할 수 있지만 권한을 요청하고 작성자에게 권한을 받은 후에만 사용할 수 있습니다. 자세한 내용은 syamlalz에게 문의하거나 아래의 작성자의 지시사항을 따르십시오.
트레이딩뷰는 스크립트 작성자를 100% 신뢰하고 스크립트 작동 원리를 이해하지 않는 한 스크립트 비용을 지불하고 사용하는 것을 권장하지 않습니다. 대부분의 경우 커뮤니티 스크립트에서 무료로 좋은 오픈소스 대안을 찾을 수 있습니다.
작성자 지시 사항
″This is a invite only script. please contact syamlalz@gmail.com for a free trial.
차트에 이 스크립트를 사용하시겠습니까?
경고: 액세스를 요청하기 전에 읽어 보시기 바랍니다.
면책사항
이 정보와 게시물은 TradingView에서 제공하거나 보증하는 금융, 투자, 거래 또는 기타 유형의 조언이나 권고 사항을 의미하거나 구성하지 않습니다. 자세한 내용은 이용 약관을 참고하세요.