INVITE-ONLY SCRIPT
Oscillator pack [Tcs] | OSC
These oscillators are a reinterpretation of some of the most famous indicators for traders, with the scope to provide higher accuracy and better readability.
The improvements are based on both calculation and visual impact, with calculations incorporating not only price but also tick volume to enhance signal accuracy.
All oscillators can be applied to different timeframes than the chart being analyzed.
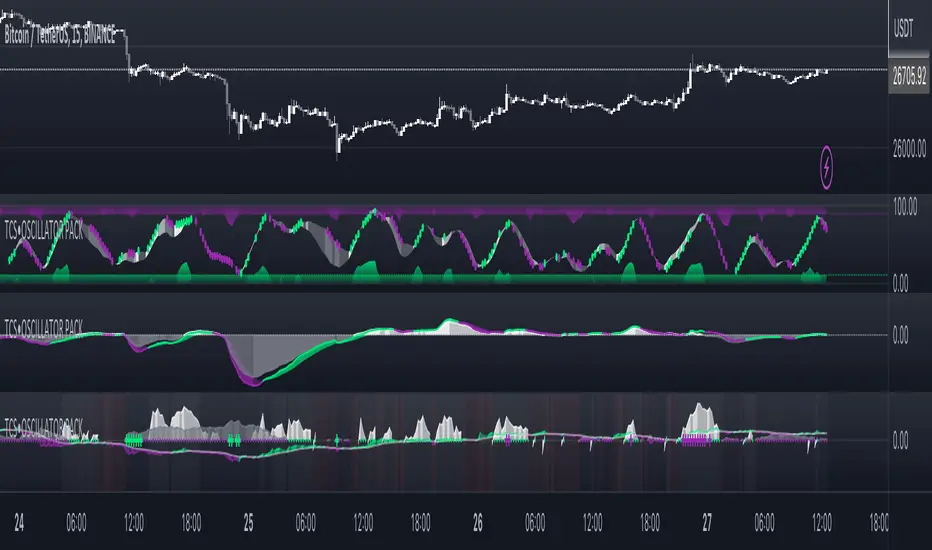
This indicator includes three different oscillators: TCS Stochastic, TCS MACD, and TCS Momentum.
•TCS STOCHASTIC
The TCS STOCHASTIC removes the noise from the standard RSI Stochastic and significantly reduces the number of anticipated signals (line crosses) that the RSI Stochastic provides. Similarly, the divergences are less frequent but more accurate.
The indicator plots overbought conditions (plotted as green waves) and oversold conditions (plotted as purple waves) in a clear way.
The Stochastic channel marks the power of buyers or sellers with white (bullish) and gray (bearish) shades.
The dots on the Stochastic line indicate when buyers or sellers are in control. This helps both in trend following conditions and reversal points.
The tinier the channel, defined by the Stochastic line and signal line, the stronger the trend is likely to be.

•TCS MACD
The TCS MACD removes noise from the standard MACD and often anticipates good entry points for standard MACD crosses, while delaying bad ones.
Additionally, the indicator's performance for divergences has been improved, as it takes into account both price action and on balance volume.
It has also been developed to provide better performance at the 0 line level, which can be a good entry point when the baseline is crossed.
The histogram helps to identify divergences and the strength of the trend.

•TCS MOMENTUM
The TCS MOMENTUM WAVES indicate the trend direction based on the strength of momentum and moments of accumulation/distribution, which are highlighted with a red background.
Bullish trends are represented with white waves, while bearish trends are shown in gray.
Crosses symbol on the 0 line indicate a possible trend reversal, with green for bullish and purple for bearish.
The best entry point for a reversal is when the momentum line changes to the trend direction color after a reversal point is detected.
The momentum line and its signal line can also be used to identify entry points for a strategy, as well as the crosses of the waves.

Please note that this indicator is for educational purposes only and should not be used for trading without further testing and analysis.
The improvements are based on both calculation and visual impact, with calculations incorporating not only price but also tick volume to enhance signal accuracy.
All oscillators can be applied to different timeframes than the chart being analyzed.
This indicator includes three different oscillators: TCS Stochastic, TCS MACD, and TCS Momentum.
•TCS STOCHASTIC
The TCS STOCHASTIC removes the noise from the standard RSI Stochastic and significantly reduces the number of anticipated signals (line crosses) that the RSI Stochastic provides. Similarly, the divergences are less frequent but more accurate.
The indicator plots overbought conditions (plotted as green waves) and oversold conditions (plotted as purple waves) in a clear way.
The Stochastic channel marks the power of buyers or sellers with white (bullish) and gray (bearish) shades.
The dots on the Stochastic line indicate when buyers or sellers are in control. This helps both in trend following conditions and reversal points.
The tinier the channel, defined by the Stochastic line and signal line, the stronger the trend is likely to be.
•TCS MACD
The TCS MACD removes noise from the standard MACD and often anticipates good entry points for standard MACD crosses, while delaying bad ones.
Additionally, the indicator's performance for divergences has been improved, as it takes into account both price action and on balance volume.
It has also been developed to provide better performance at the 0 line level, which can be a good entry point when the baseline is crossed.
The histogram helps to identify divergences and the strength of the trend.
•TCS MOMENTUM
The TCS MOMENTUM WAVES indicate the trend direction based on the strength of momentum and moments of accumulation/distribution, which are highlighted with a red background.
Bullish trends are represented with white waves, while bearish trends are shown in gray.
Crosses symbol on the 0 line indicate a possible trend reversal, with green for bullish and purple for bearish.
The best entry point for a reversal is when the momentum line changes to the trend direction color after a reversal point is detected.
The momentum line and its signal line can also be used to identify entry points for a strategy, as well as the crosses of the waves.
Please note that this indicator is for educational purposes only and should not be used for trading without further testing and analysis.
초대 전용 스크립트
이 스크립트에 대한 접근은 작성자가 승인한 사용자로 제한되며, 일반적으로 지불이 필요합니다. 즐겨찾기에 추가할 수 있지만 권한을 요청하고 작성자에게 권한을 받은 후에만 사용할 수 있습니다. 자세한 내용은 zendrer에게 문의하거나 아래의 작성자의 지시사항을 따르십시오.
트레이딩뷰는 스크립트 작성자를 100% 신뢰하고 스크립트 작동 원리를 이해하지 않는 한 스크립트 비용을 지불하고 사용하는 것을 권장하지 않습니다. 대부분의 경우 커뮤니티 스크립트에서 무료로 좋은 오픈소스 대안을 찾을 수 있습니다.
작성자 지시 사항
″You can find all the necessary info in the website http://www.thecryptostrategist.com
차트에 이 스크립트를 사용하시겠습니까?
경고: 액세스를 요청하기 전에 읽어 보시기 바랍니다.
For the access to premium indicators please contact me on tradingview
면책사항
이 정보와 게시물은 TradingView에서 제공하거나 보증하는 금융, 투자, 거래 또는 기타 유형의 조언이나 권고 사항을 의미하거나 구성하지 않습니다. 자세한 내용은 이용 약관을 참고하세요.