INVITE-ONLY SCRIPT
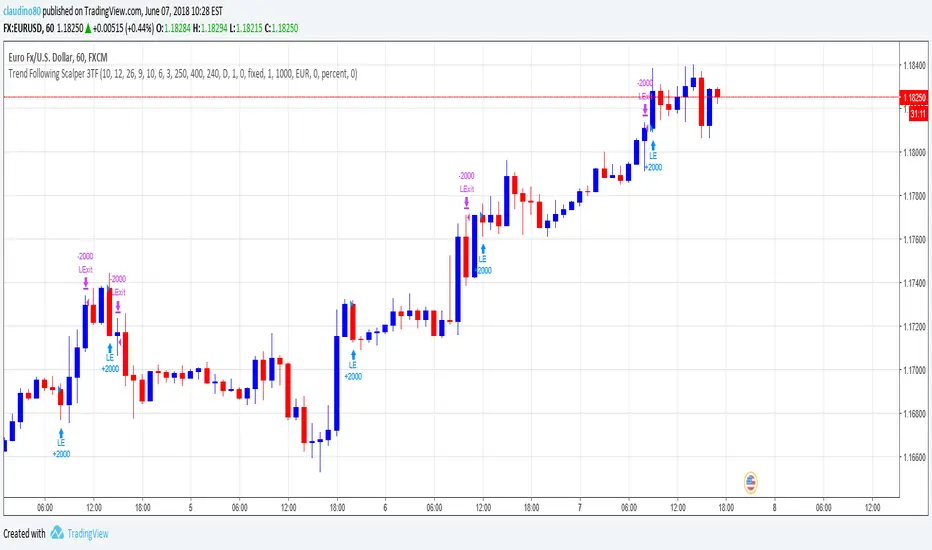
Trend Following Scalper 3 Time Framse
Do you think it is a good idea to use the Stochastic / MACD / EMA and cross check THREE timeframes to detect a new trend?
If you think that it would be a good idea, this is the script that you are looking for.
The Trend Following Scalper (3 Time Frames) script has been developed to automate the trading activity by detecting a new trend and by scalping a fixed amount of pips each trade. That is why it is called Trend Following Scalper.
How does the script detect the new trend?
The beginning of the new trend is detected on the lower timeframe (1H is the suggested one) by joining the information of the Stochastic, MACD and Exponential Moving Average.
Once a potential trade has been detected on lower timeframe, the script confirms it by looking the upper timeframe (e.g. Daily + H4) by gathering the same indicator / parameter information.
If the threes timeframes are moving in the same direction, the script open a new trade.
Why do we need to merge lower and higher timeframe before open the trade?
The lower timeframe shows a shorter Price Action context. The short price action context has a short life! By looking at the higher time frames context the script tries to exclude the short life counter-trend moves. At the end, a new trade is open only if the higher timeframe context supports the lower timeframe indication.
What about the Risk-Reward (following RR) ratio?
The RR is set by default as 1.6 (stop loss 25 pips and take profit 40 pips).
This configuration has been heavily tested on multiple crosses and it has shown a good Equity Line with a low Drawdown.
(Note: the stop loss and take profit can be changed by the user via the parameter pages. Suggest RR > 1.5)
What about the accuracy of the Script?
The average script accuracy is > 55% on the H1 time frame (tested with various crosses).
With this accuracy, and by risking 0.6% of the capital each trade, your capital will grow > 25% every 100 trades.
What about the drawdown?
It depends on the capital and the size of the position used on each trade.
For example, with an initial capital of 1000 Euros and by risking 0.6% of the capital each trade, the drawdown is close to 3%.
(The strategy tester result has been calculated starting from January 2017. The strategy produced 527E (i.e. 52% gain) starting from a 1000E capital and risking 0.5% each trade)
Do you want to try the script? Please write me!
Do you have some question? Please write me!
초대 전용 스크립트
이 스크립트는 작성자가 승인한 사용자만 접근할 수 있습니다. 사용하려면 요청을 보내고 승인을 받아야 합니다. 일반적으로 결제 후에 승인이 이루어집니다. 자세한 내용은 아래 작성자의 지침을 따르거나 claudino80에게 직접 문의하세요.
트레이딩뷰는 스크립트 작성자를 완전히 신뢰하고 스크립트 작동 방식을 이해하지 않는 한 스크립트 비용을 지불하거나 사용하지 않는 것을 권장하지 않습니다. 무료 오픈소스 대체 스크립트는 커뮤니티 스크립트에서 찾을 수 있습니다.
작성자 지시 사항
면책사항
이 정보와 게시물은 TradingView에서 제공하거나 보증하는 금융, 투자, 거래 또는 기타 유형의 조언이나 권고 사항을 의미하거나 구성하지 않습니다. 자세한 내용은 이용 약관을 참고하세요.