INVITE-ONLY SCRIPT
BTC|scanner|LONG|SHORT|30min STRATEGY
업데이트됨
- This strategy based on BTC|Scanner| v0.6b INDICATOR.
- Stop loss and take profit settings are available.
- This strategy can be used on a 30m timeframe and does not require fine tuning.
Detailed description of the strategy:
-According to the terms of the strategy:
-The initial deposit is $ 1000.
-The entry into the trade is carried out with the leverage from x3 to x8.
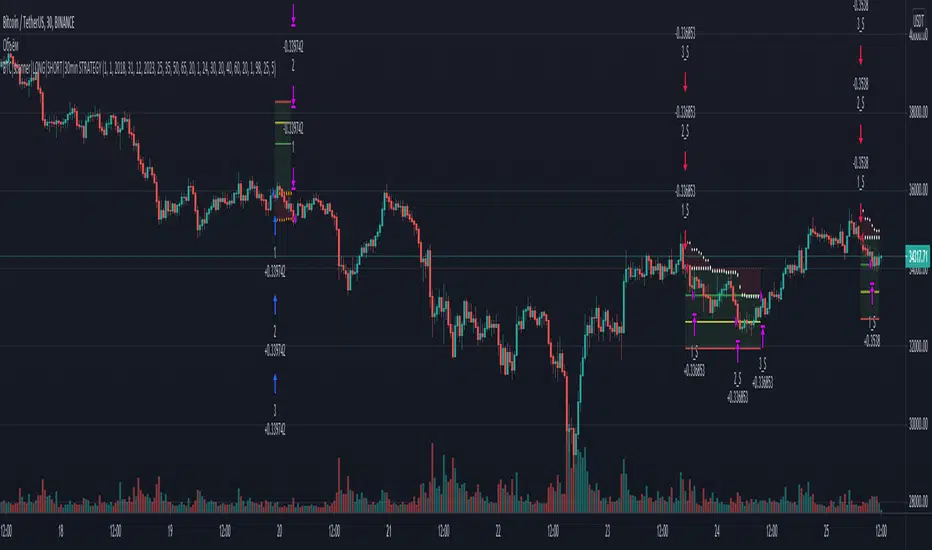
-Each entry/exit is shown by up/down arrows on the chart, the number of arrows shows the size of the leverage in the trade.
-Enter the trade with 100% of the deposit.
-All of the above suggests that with the input signal and the indication of the three arrows, an entry in the amount of$3000 will be made. If the shooter is 5, then$5000.
-Exit from the long/short position under the strategy conditions is carried out by 33% of the initial position volume on all TP (you can specify an unrealistic value of TP3, then the exit of 33% will be due only to an increase in the risk of further holding the position, but this can both increase profit and reduce it).
-To avoid distortion of the strategy indicators due to compound interest, it is recommended to take a period of a month to view statistics.
-The "Enter Confirm" field displays the confirmation of the trade, if several signals appear sequentially, the trade will be executed, and if the signal appears once, the trade will be skipped.
-The "ratio" field indicates the coefficient of change in activity on the current bar from the previous bar.
-The "Corner" field changes the angle of the stop loss correction depending on the time in the direction of reducing the loss.
-The "Short trigger" field indicates from which phase of activity you can open a short trade, conditionally this is a sinusoid with a lower limit of 0 and an upper limit of 100, but the sinusoid itself does not necessarily reach 0 and 100, the activity can stop at 80 and go towards 0 (initially the value 65 is specified).
-The "TP and Stop loss" fields are the percentage of profit / loss multiplied by 10. (the value 35 corresponds to 3.5%, 20-2% , and so on).
-The "cross action" field includes closing the trade when the activity sinusoid reaches the value of 99, regardless of any other calculations.
-The stop loss is displayed on the chart with orange and white dots.
The indicator and strategy can be applied not only to BTC , but it often has poor statistics on illiquid instruments.
////////////////////////////////////////////////////////////////////////////////////////////////////////////////////////////////////////////////////////////////////////////////
- Эта стратегия основана на индикаторе BTC|Scanner| v0.6b.
- Доступны настройки стоп-лосса и тейк-профита.
- Эта стратегия может быть использована на 30-минутном таймфрейме и не требует тонкой настройки.
Подробное описание стратегии:
-Начальный депозит составляет 1000 долларов.
-Вход в сделку осуществляется с кредитным плечом от х3 до х8.
-Каждый вход/выход отображается стрелками вверх/вниз на графике, количество стрелок показывает размер кредитного плеча в сделке.
-Вход в сделку на 100% депозита.
-Все вышесказанное говорит о том, что с помощью входного сигнала и индикации трех стрелок будет совершен вход на сумму 3000 долларов. Если стрелок 5, то 5000 долларов.
-Выход из длинной/короткой позиции по условиям стратегии осуществляется на 33% от объема начальной позиции по всем ТП (можно указать нереальное значение ТП3, тогда выход на 33% будет обусловлен только увеличением риска дальнейшего удержания позиции, но это может как увеличить прибыль, так и уменьшить ее).
-Чтобы избежать искажения показателей стратегии из-за сложных процентов, рекомендуется использовать месячный период для просмотра статистики.
-В поле "Enter Confirm" отображается подтверждение сделки, если последовательно появится несколько сигналов, сделка будет выполнена, а если сигнал появится один раз, сделка будет пропущена.
-Поле "ratio" указывает коэффициент изменения активности на текущем баре по сравнению с предыдущим баром.
-Поле "Corner" изменяет угол коррекции стоп-лосса в зависимости от времени в направлении уменьшения убытка.
-Поле "Short trigger" указывает, с какой фазы активности вы можете открыть короткую сделку, условно это синусоида с нижней границей 0 и верхней границей 100, но сама синусоида не обязательно достигает 0 и 100, активность может остановиться на 80 и пойти в сторону 0 (изначально указано значение 65).
-Поля "TP и Stop loss" - это процент прибыли / убытка, умноженный на 10. (значение 35 соответствует 3,5%, 20-2% и так далее).
-Поле "cross action" включает закрытие сделки, когда синусоида активности достигает значения 99, независимо от любых других расчетов.
-Стоп-лосс отображается на графике оранжевыми и белыми точками.
Индикатор и стратегию можно применить не только к BTC , но зачастую он имеет плохую статистику на неликвидных инструментах.
////////////////////////////////////////////////////////////////////////////////////////////////////////////////////////////////////////////////////////////////////////////////
- Stop loss and take profit settings are available.
- This strategy can be used on a 30m timeframe and does not require fine tuning.
Detailed description of the strategy:
-According to the terms of the strategy:
-The initial deposit is $ 1000.
-The entry into the trade is carried out with the leverage from x3 to x8.
-Each entry/exit is shown by up/down arrows on the chart, the number of arrows shows the size of the leverage in the trade.
-Enter the trade with 100% of the deposit.
-All of the above suggests that with the input signal and the indication of the three arrows, an entry in the amount of$3000 will be made. If the shooter is 5, then$5000.
-Exit from the long/short position under the strategy conditions is carried out by 33% of the initial position volume on all TP (you can specify an unrealistic value of TP3, then the exit of 33% will be due only to an increase in the risk of further holding the position, but this can both increase profit and reduce it).
-To avoid distortion of the strategy indicators due to compound interest, it is recommended to take a period of a month to view statistics.
-The "Enter Confirm" field displays the confirmation of the trade, if several signals appear sequentially, the trade will be executed, and if the signal appears once, the trade will be skipped.
-The "ratio" field indicates the coefficient of change in activity on the current bar from the previous bar.
-The "Corner" field changes the angle of the stop loss correction depending on the time in the direction of reducing the loss.
-The "Short trigger" field indicates from which phase of activity you can open a short trade, conditionally this is a sinusoid with a lower limit of 0 and an upper limit of 100, but the sinusoid itself does not necessarily reach 0 and 100, the activity can stop at 80 and go towards 0 (initially the value 65 is specified).
-The "TP and Stop loss" fields are the percentage of profit / loss multiplied by 10. (the value 35 corresponds to 3.5%, 20-2% , and so on).
-The "cross action" field includes closing the trade when the activity sinusoid reaches the value of 99, regardless of any other calculations.
-The stop loss is displayed on the chart with orange and white dots.
The indicator and strategy can be applied not only to BTC , but it often has poor statistics on illiquid instruments.
////////////////////////////////////////////////////////////////////////////////////////////////////////////////////////////////////////////////////////////////////////////////
- Эта стратегия основана на индикаторе BTC|Scanner| v0.6b.
- Доступны настройки стоп-лосса и тейк-профита.
- Эта стратегия может быть использована на 30-минутном таймфрейме и не требует тонкой настройки.
Подробное описание стратегии:
-Начальный депозит составляет 1000 долларов.
-Вход в сделку осуществляется с кредитным плечом от х3 до х8.
-Каждый вход/выход отображается стрелками вверх/вниз на графике, количество стрелок показывает размер кредитного плеча в сделке.
-Вход в сделку на 100% депозита.
-Все вышесказанное говорит о том, что с помощью входного сигнала и индикации трех стрелок будет совершен вход на сумму 3000 долларов. Если стрелок 5, то 5000 долларов.
-Выход из длинной/короткой позиции по условиям стратегии осуществляется на 33% от объема начальной позиции по всем ТП (можно указать нереальное значение ТП3, тогда выход на 33% будет обусловлен только увеличением риска дальнейшего удержания позиции, но это может как увеличить прибыль, так и уменьшить ее).
-Чтобы избежать искажения показателей стратегии из-за сложных процентов, рекомендуется использовать месячный период для просмотра статистики.
-В поле "Enter Confirm" отображается подтверждение сделки, если последовательно появится несколько сигналов, сделка будет выполнена, а если сигнал появится один раз, сделка будет пропущена.
-Поле "ratio" указывает коэффициент изменения активности на текущем баре по сравнению с предыдущим баром.
-Поле "Corner" изменяет угол коррекции стоп-лосса в зависимости от времени в направлении уменьшения убытка.
-Поле "Short trigger" указывает, с какой фазы активности вы можете открыть короткую сделку, условно это синусоида с нижней границей 0 и верхней границей 100, но сама синусоида не обязательно достигает 0 и 100, активность может остановиться на 80 и пойти в сторону 0 (изначально указано значение 65).
-Поля "TP и Stop loss" - это процент прибыли / убытка, умноженный на 10. (значение 35 соответствует 3,5%, 20-2% и так далее).
-Поле "cross action" включает закрытие сделки, когда синусоида активности достигает значения 99, независимо от любых других расчетов.
-Стоп-лосс отображается на графике оранжевыми и белыми точками.
Индикатор и стратегию можно применить не только к BTC , но зачастую он имеет плохую статистику на неликвидных инструментах.
////////////////////////////////////////////////////////////////////////////////////////////////////////////////////////////////////////////////////////////////////////////////
릴리즈 노트
- changing hidden settings릴리즈 노트
- Added TP on the chart릴리즈 노트
- changing date settings릴리즈 노트
Added conditions:- "Negative volume On sin ..." - closes the long when the volume distribution changes above the sinusoid of activity (according to condition 98);
- "Sin go down Lower then ... And fall ..." - premature drop in activity at the level of the sinusoid of activity (according to condition 25) by a certain amount (according to condition 5 units);
- The longx5 and short strategies are disabled - work is underway.
- The commission has been changed to a real 0.1% (if you pay the commission in BNB, you need to set it to 0.075%)
- In theory, there is a time limit on the trade when entering the flat, need more statistics.
릴리즈 노트
- Short strategies corrections- Short strategy has a filter for trading only by trend
- Long x5 strategy deleted
릴리즈 노트
- improved take profit & stop loss display릴리즈 노트
- changing hidden settings초대 전용 스크립트
이 스크립트에 대한 접근은 작성자가 승인한 사용자로 제한되며, 일반적으로 지불이 필요합니다. 즐겨찾기에 추가할 수 있지만 권한을 요청하고 작성자에게 권한을 받은 후에만 사용할 수 있습니다. 자세한 내용은 qwertyQQ에게 문의하거나 아래의 작성자의 지시사항을 따르십시오.
트레이딩뷰는 스크립트 작성자를 100% 신뢰하고 스크립트 작동 원리를 이해하지 않는 한 스크립트 비용을 지불하고 사용하는 것을 권장하지 않습니다. 대부분의 경우 커뮤니티 스크립트에서 무료로 좋은 오픈소스 대안을 찾을 수 있습니다.
작성자 지시 사항
″Send me a direct massege on tradingview to request a 30 days free trial.
Отправьте мне сообщение для получения бесплатного доступа на 30 дней.
차트에 이 스크립트를 사용하시겠습니까?
경고: 액세스를 요청하기 전에 읽어 보시기 바랍니다.
면책사항
이 정보와 게시물은 TradingView에서 제공하거나 보증하는 금융, 투자, 거래 또는 기타 유형의 조언이나 권고 사항을 의미하거나 구성하지 않습니다. 자세한 내용은 이용 약관을 참고하세요.