INVITE-ONLY SCRIPT
Cloud
업데이트됨
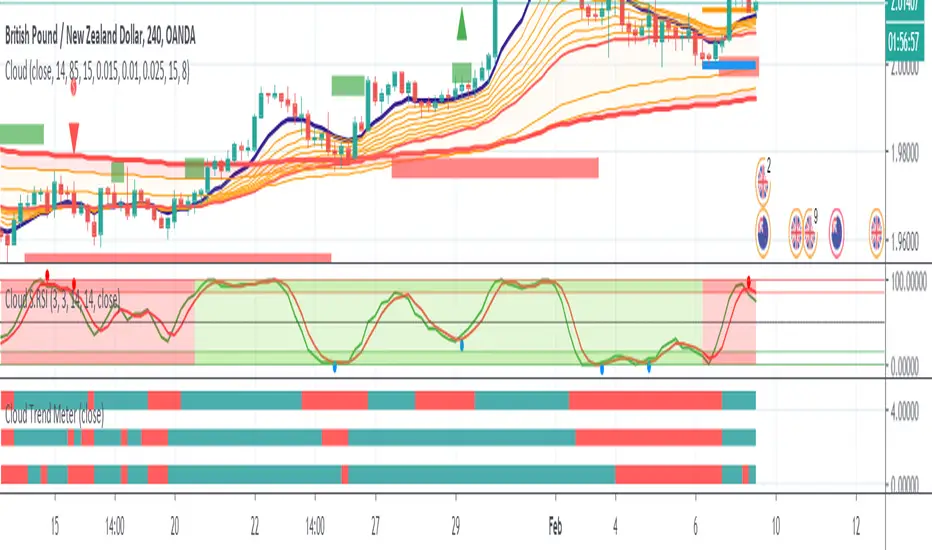
Multi Exponential Moving Average (EMA) plotted.
Exponential Moving Average (EMA) - 10, 20, 30, 40, 50, 100, 150, 200, 250, 300, 350, & 400 (Default Values)
Built-in RSI plotted above or below candlestick.
Relative Strength Index (RSI) - Length 14, Overbought 87, & Oversold 30 (Defualt Values)
Hope you will enjoy it, and I will appreciate your feedback, and improvement suggestions.
릴리즈 노트
Changed colors from silver to light blue, nothing major just looks better I think :)릴리즈 노트
Updated: Added1. Optional PSAR (Uptrend/Downtrend)
2. Support & Resistance Zone (Standard)
3. Better looking color lines and fillers
릴리즈 노트
Added auto tracking number of last candle/s Highest & Lowest with the closing price of the previous candle by placing Blue Lines (highest/lowest) and Previous closed price candle stick with an Orange Line.릴리즈 노트
Added Buy/Short Alerts and Notifications초대 전용 스크립트
이 스크립트에 대한 접근은 작성자가 승인한 사용자로 제한되며, 일반적으로 지불이 필요합니다. 즐겨찾기에 추가할 수 있지만 권한을 요청하고 작성자에게 권한을 받은 후에만 사용할 수 있습니다. 자세한 내용은 CloudTrader_1에게 문의하거나 아래의 작성자의 지시사항을 따르십시오.
트레이딩뷰는 스크립트 작성자를 100% 신뢰하고 스크립트 작동 원리를 이해하지 않는 한 스크립트 비용을 지불하고 사용하는 것을 권장하지 않습니다. 대부분의 경우 커뮤니티 스크립트에서 무료로 좋은 오픈소스 대안을 찾을 수 있습니다.
차트에 이 스크립트를 사용하시겠습니까?
경고: 액세스를 요청하기 전에 읽어 보시기 바랍니다.
면책사항
이 정보와 게시물은 TradingView에서 제공하거나 보증하는 금융, 투자, 거래 또는 기타 유형의 조언이나 권고 사항을 의미하거나 구성하지 않습니다. 자세한 내용은 이용 약관을 참고하세요.