INVITE-ONLY SCRIPT
Skynet PA osc
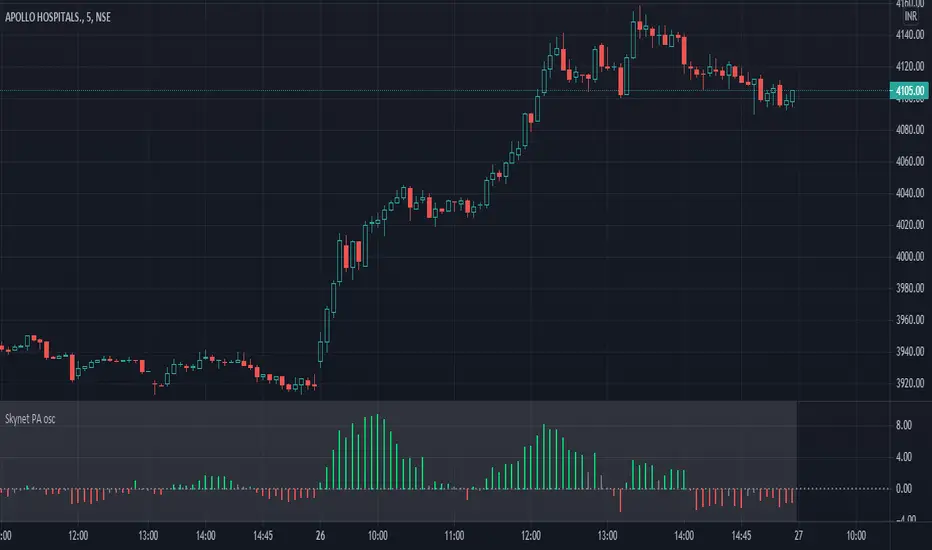
The Skynet PA osc has the following features :
1>>> Oscillator : The oscillator represents the rate of change of close price for the past 20 candles.
1.a> Bullish signal : When the oscillator turns green/lime color, it indicates that the price is gaining momentum on the upside.
1.b> Bearish signal : When the oscillator turns red, it indicates that the price is gaining momentum on the downside.
2>>> Entry/exit points :
2.a>Strong bullish: When an aqua/blue color diamond appears, it indicates a strong bullish momentum for the price.
2.b>Strong bearish : When a pink/purple color diamond appears on the zero line, it indicates a strong bearish momentum for the price.
**** Volume along with the oscillator is used to generate the diamond labels.
Disclaimer: This indicator is not 100% accurate and false signals are generated from time to time. Trading in the markets involves huge risks and one should always do his/her own research before making any trading decisions. This indicator is only designed to help you make a trading decision.
초대 전용 스크립트
이 스크립트에 대한 접근은 작성자가 승인한 사용자로 제한되며, 일반적으로 지불이 필요합니다. 즐겨찾기에 추가할 수 있지만 권한을 요청하고 작성자에게 권한을 받은 후에만 사용할 수 있습니다. 자세한 내용은 skynet970에게 문의하거나 아래의 작성자의 지시사항을 따르십시오.
트레이딩뷰는 스크립트 작성자를 100% 신뢰하고 스크립트 작동 원리를 이해하지 않는 한 스크립트 비용을 지불하고 사용하는 것을 권장하지 않습니다. 대부분의 경우 커뮤니티 스크립트에서 무료로 좋은 오픈소스 대안을 찾을 수 있습니다.
작성자 지시 사항
″You can get this indicator by leaving me a private message on tradingview.
차트에 이 스크립트를 사용하시겠습니까?
경고: 액세스를 요청하기 전에 읽어 보시기 바랍니다.
면책사항
이 정보와 게시물은 TradingView에서 제공하거나 보증하는 금융, 투자, 거래 또는 기타 유형의 조언이나 권고 사항을 의미하거나 구성하지 않습니다. 자세한 내용은 이용 약관을 참고하세요.