INVITE-ONLY SCRIPT
업데이트됨 Volatility Filter
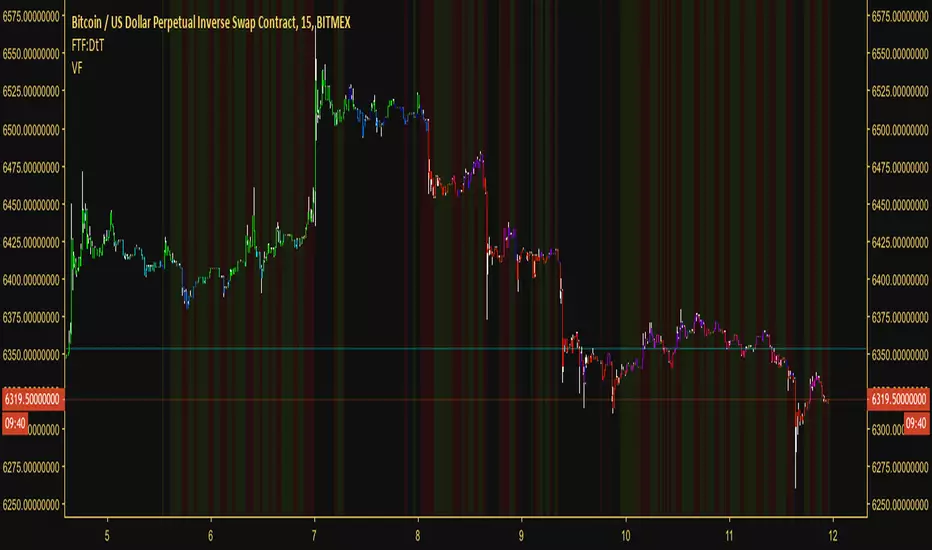
Over the past few weeks (as of today, which is: 12th of October 2018) there has been little to no volatility in most of the major cryptocurrencies. What volatility does come in comes and goes very quickly. It's difficult to discern good and bad moments to be in a trade. As a result I decided to create a volatility filter based on Hurst exponent market phases, Bollinger Band width, moving averages, volume and the average true range. The results are the above.
You can use this indicator against any asset or within any market. It actually reaps excellent results against the DJI and XAUUSD One of my suggested uses for it is if you're scalping, only enter a position when there is volatility (when there's no background color present). If you're swinging, only enter a position when there's low volatility (when the red background color is present).
Another way to use it (although this isn't intended, just incidental) is to take a position in the direction of the first bar after the red background has gone/after low volatility has passed. So if we get a declining candle when we exit a low volatility zone, short. Otherwise long. This is the experimental side of it though.
However, this indicator won't tell you what direction to trade in, so in order to get use from it I suggest having a trend filter and a trigger. Luckily these two things are in most traders' arsenal. If not, take a look at my other script which is a timelessly brilliant trigger for buying and selling: tradingview.com/v/9lKdi6tU/
Something else to consider is that the volatility is relative. If we go through a period of incredibly high volatility then afterwards we can sometimes expect the volatility filter to plot a red background even though there is still acceptable volatility left in the market. The volatility at that point is much less than the volatility beforehand.
With all that said, this easy-to-read tool will help you avoid flat periods when scalping and, conversely, help you determine good times to enter a swing trade. For those who had difficulty trading the markets as of late due to volatility, this indicator is perfect for you
Access to the filter is provided for 10$, payable in most low-transaction-fee cryptocurrencies. Access is limited to 250 customers. For more information message me through TradingView or message overttherainbow through Telegram.
Have a nice day and good luck trading.
릴리즈 노트
This script better identifies market phases now than before, with a painted background meaning tight volatility and an exposed, or clear, background meaning a period of high volatility (and a great time to enter the market with the trend)Here’s the legend for the background colors:
Red: high volatility
Golden brown: entering high volatility/moving away from high volatility
Dun yellow: entering low volatility/moving away from low volatility
Green: low volatility
초대 전용 스크립트
이 스크립트는 작성자가 승인한 사용자만 접근할 수 있습니다. 사용하려면 요청 후 승인을 받아야 하며, 일반적으로 결제 후에 허가가 부여됩니다. 자세한 내용은 아래 작성자의 안내를 따르거나 overttherainbow에게 직접 문의하세요.
트레이딩뷰는 스크립트의 작동 방식을 충분히 이해하고 작성자를 완전히 신뢰하지 않는 이상, 해당 스크립트에 비용을 지불하거나 사용하는 것을 권장하지 않습니다. 커뮤니티 스크립트에서 무료 오픈소스 대안을 찾아보실 수도 있습니다.
작성자 지시 사항
면책사항
해당 정보와 게시물은 금융, 투자, 트레이딩 또는 기타 유형의 조언이나 권장 사항으로 간주되지 않으며, 트레이딩뷰에서 제공하거나 보증하는 것이 아닙니다. 자세한 내용은 이용 약관을 참조하세요.