This USD Liquidity Index composed of 2 parts, total assets and major liabilities of the Federal Reserve . There is a certain positive correlation between USD liquidity and risk asset price changes in history. Suggested that USD Liquidity is mostly determined by the Federal Reserve balance (without leveraged), this index deducts three major liabilities from the...
달러
this just sample of our strategies we published with open source, to learning our investor the way of trading and analysis, this strategy just for study and learning in this strategy we use expontial moving avarage 20 , 50 , 200 and the we build this strategy when the price move up ema 200 and ema 20,50 cross up the 200 ema in this conditions the strargey will...
Balance of Power Heikin Ashi Investing Strategy This is a swing strategy designed for investment help. Its made around the Balace of Power indicator, but has been adapted on using the Monthly Heikin Ashi candle from the SPY asset in order to be used with correlation for US Stock/ETF/Index Markets. The BOP acts as an oscilallator showing the power of a bull...
Hello Traders. Lets keep it simple.. 1. Take the major pairs that have USD in them and watch their change over a specific timeframe. 2. Now lets sort these changes of each pair from the most positive to the most negative. Good, I see you have some ideas already. This is exactly what this indicator does. You will visualize the biggest change in pairs...
This script is useful to see correlation between macroeconomic assets, displayed in different ema line shown in percentage to compare these assets on the same basis. Percentage will depend on the time frame selection. In the higher timeframe you will see higher variation and in small timeframe smaller variation. You can select the timeframe who suit your...
Kraken + FTX USDT premium indicator. Inspired by John J Brown, forked from IAmSatoshi (Migrated to V5 and few changes + more markets coming). John J Brown: " USDt premium/discount exist because of conversion fees. It is a good market indicator: If USDt>USD, then market is growing and in need of liquidity; If USDt<USD, then market is shrinking and has excess liquidity."
This is a Forex Scalping Trading Sytem based on the Bollinger Bands. Its suited for major pairs, with lowest possible comission (below 1 pip) and with timeframes ranging between 1-15 min. Indicators: Bollinger bands ADX RSI Rules for entry: Long Entry: price to move below the upper Bollinger Bands RSI raise above the 30 line and ADX<32 at the same...
This forex System is only for ECN Broker Account. Pairs: Major with spread < 0.0001 (EUR/USD). Setup: Wait for the market to make to 60 minute from the open. If the market is near the intraday high be prepared to go short If the market is near an intraday low for the same time period, then be prepared to go long. Rules for entry For sell setups: Enter on sell...
This is a full strategy designed for forex major pairs, specially EUR/USD using 1h time frame chart. Its components are 200 EMA MACD OBV PSAR RIsk management with tp and sl movements Rules for entry For long = Previous histogram from MACD was below 0 and current one is above 0. CLose of a candle is above EMA 200 , OBV oscillator is negative and we have an...
This is a strategy made using BB+ RSI indicators that seems to work great with 15 min major pairs for FOREX. THe rules for it are simple: For long we enter when the close of our candle crosses upwards the lower line and rsi crossover the over sold line We exit long when we have a short entry. For short we enter when the close of the candle crosses downwards...
BTC Price Multiple comparisons from 2012 and 2016 halving period.
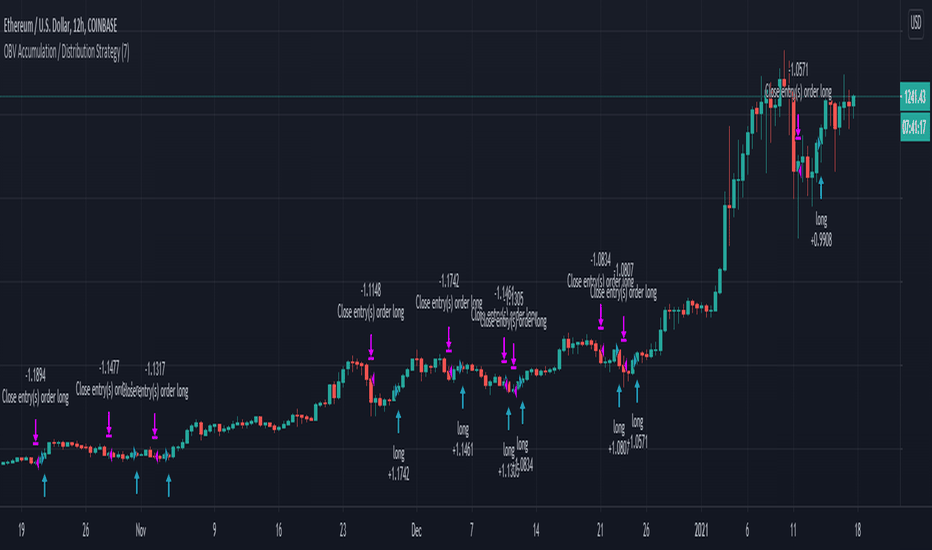
This version its made for 8-12h and works amazingly on the ETH pairs. Can be adapted to others as well For this example, I used an initial 1$ account, using always full capital on each trade(without using any leverage), together with a 0.1% commission/fees for each deal, on Coinbase broker. This is a long only strategy The components for the inside of the...
This is a forex strategy suited for day traders, specialized in the london breakout session The key elements for this strategy are the specific london time session, together with an exit time(before asian trade/at the end of new york session). At the same time, as logic elements we only use price action inside like : For long we have 3 ascending candles, and...
This script will draw your underlying ticker compensating for a truer USD inflation rate based on an average between the M2 money supply increase and the government's reported CPI. It only considers the last year of inflation by default, but you can set any amount of years in the options. This is especially relevant given the current massive printing that is...
Compares BTC volume vs USD volume overtime Best used on 4hr timeframe. Not really some crazy alpha but good overview/statistic to keep track of. (make sure to use on XBTUSD pair since it isnt using security calls to call the data) Enjoy!
Simple indicator implementing relative strength against the equally weighted basket of major currencies. Perhaps I will coin it the Equally Weighted Index (EWI) and trademark it like ICE did with DXY. usd = (usdjpy/100 + usdcad + 1/gbpusd + 1/eurusd + usdchf + 1/audusd + 1/nzdusd)/7 DXY is hard to compare against other indices because of it's weightening....


![BTC and USD volume overtime [XBT] XBTUSD.P: BTC and USD volume overtime [XBT]](https://s3.tradingview.com/8/8JjFjx41_mid.png)

