INVITE-ONLY SCRIPT
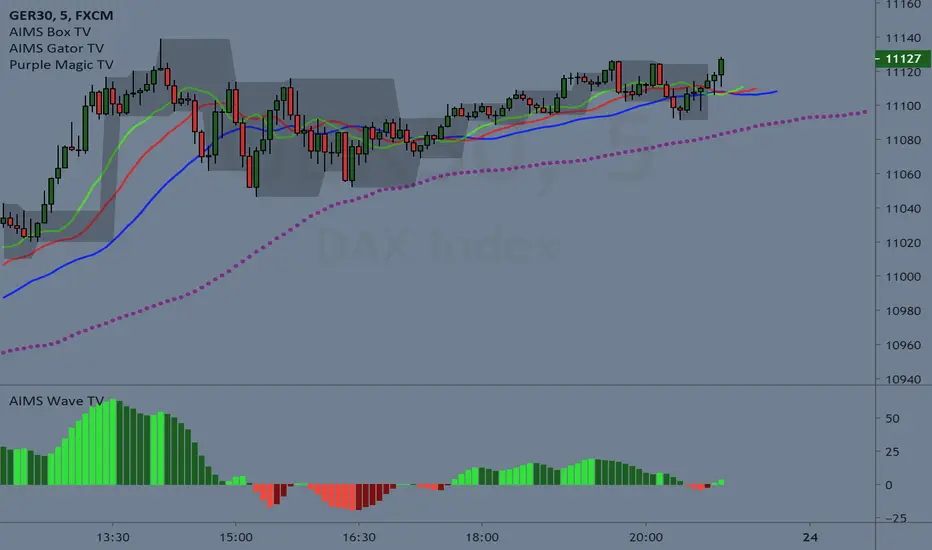
AIMS Purple Magic

The Alligator is a Very Powerful Indicator
Some people think it's just 3 moving averages. But in reality, it is far more than that.
Read more about Alligator and Bill Williams
The Purple Magic Line has been derived from Bill Williams Alligator. Together the Alligator we call the AIMS Gator.
It is a smooth moving average based on the Chaos Red Line of the 5 times higher time frame.
Our Mantra: If you trade in line with the trend of the 5 times higher time frame, you will have a higher chance of catching breakouts in the direction of the trend.
So we have this rule, Always Trade when Price is Going Away from The Purple Line. Simple as that.
Buy Only: Price above the Purple Line
Sell Only: Price below the Purple Line.
What is The Alligator?
The Alligator Indicator was developed by Bill Williams and combines moving averages with fractal geometry.
The indicator helps traders to identify if the market is trending.
Each has different lookback periods and offsets that can be set by the user.
The alligator is easy to use and can find trade setups, based on how close together or how far apart the lines are, resembling an alligator opening and closing his mouth. This indicator can be used in combination with other analysis techniques.
Based on calculations of Non-Linear mathematical formula we have arrived at a way to calculate the Trend of the 5 times higher time frame
The Purple Magic Indicates :
The Trend of Current and 5 times higher time frame
It helps prevent trading into Wave 4
It helps with counting Wave 3 and 4
You can use it to time early entry into Wave 5
The bounce of Purple after a wave 3 is often a 50% fib retracement.
Examples:
In the picture below you see an M5 chart and M1 chart.
On the left side, you see Alligator Red Line on the 5-minute chart
on the right side, you see The Purple Magic line. Which depicts the same price regions.
This is the Sweet Spot where we take trades.

In line with The Awesome oscillator if you time your entries based on a pullback towards the purple, it can be a system on its own. Nothing else required. But we have a better method.
When we put together, AIMS The Box, AIMS The Gator, and AIMS The Wave indicators, things work even smoother.
For more information visit the link below.
Some people think it's just 3 moving averages. But in reality, it is far more than that.
Read more about Alligator and Bill Williams
The Purple Magic Line has been derived from Bill Williams Alligator. Together the Alligator we call the AIMS Gator.
It is a smooth moving average based on the Chaos Red Line of the 5 times higher time frame.
Our Mantra: If you trade in line with the trend of the 5 times higher time frame, you will have a higher chance of catching breakouts in the direction of the trend.
So we have this rule, Always Trade when Price is Going Away from The Purple Line. Simple as that.
Buy Only: Price above the Purple Line
Sell Only: Price below the Purple Line.
What is The Alligator?
The Alligator Indicator was developed by Bill Williams and combines moving averages with fractal geometry.
The indicator helps traders to identify if the market is trending.
- It consists of 3 lines: the blue line (aka the Alligator's Jaw),
- the red Line (aka the Alligator's Teeth) and
- the green Line (aka the Alligator's Lips).
Each has different lookback periods and offsets that can be set by the user.
The alligator is easy to use and can find trade setups, based on how close together or how far apart the lines are, resembling an alligator opening and closing his mouth. This indicator can be used in combination with other analysis techniques.
Based on calculations of Non-Linear mathematical formula we have arrived at a way to calculate the Trend of the 5 times higher time frame
The Purple Magic Indicates :
The Trend of Current and 5 times higher time frame
It helps prevent trading into Wave 4
It helps with counting Wave 3 and 4
You can use it to time early entry into Wave 5
The bounce of Purple after a wave 3 is often a 50% fib retracement.
Examples:
In the picture below you see an M5 chart and M1 chart.
On the left side, you see Alligator Red Line on the 5-minute chart
on the right side, you see The Purple Magic line. Which depicts the same price regions.
This is the Sweet Spot where we take trades.
In line with The Awesome oscillator if you time your entries based on a pullback towards the purple, it can be a system on its own. Nothing else required. But we have a better method.
When we put together, AIMS The Box, AIMS The Gator, and AIMS The Wave indicators, things work even smoother.
For more information visit the link below.
초대 전용 스크립트
이 스크립트에 대한 접근은 작성자가 승인한 사용자로 제한되며, 일반적으로 지불이 필요합니다. 즐겨찾기에 추가할 수 있지만 권한을 요청하고 작성자에게 권한을 받은 후에만 사용할 수 있습니다. 자세한 내용은 iTradeAIMS에게 문의하거나 아래의 작성자의 지시사항을 따르십시오.
트레이딩뷰는 스크립트 작성자를 100% 신뢰하고 스크립트 작동 원리를 이해하지 않는 한 스크립트 비용을 지불하고 사용하는 것을 권장하지 않습니다. 대부분의 경우 커뮤니티 스크립트에서 무료로 좋은 오픈소스 대안을 찾을 수 있습니다.
차트에 이 스크립트를 사용하시겠습니까?
경고: 액세스를 요청하기 전에 읽어 보시기 바랍니다.
면책사항
이 정보와 게시물은 TradingView에서 제공하거나 보증하는 금융, 투자, 거래 또는 기타 유형의 조언이나 권고 사항을 의미하거나 구성하지 않습니다. 자세한 내용은 이용 약관을 참고하세요.