INVITE-ONLY SCRIPT
"EPI" Technical Indicator
Indicator «EPI»
Class: oscillator
Trading type: scalping & averaging
Time frame: 5 min
Purpose: trend based
Level of aggressiveness: standard
Indicator «EPI» is a trend line indicator based on EMA and oscillator for generating intraday trade signals. The EMA is a moving average that places a greater weight and significance on the most recent data points. Like all moving averages, this technical indicator is used to produce buy and sell signals based on crossovers and divergences from the historical average. While the oscillator is used in conjunction with other technical analysis indicators to make trading decisions. This tool helps the trader to identify an entry point even when there is no clear trend line formed on the graph.
Structure of the indicator «EPI»
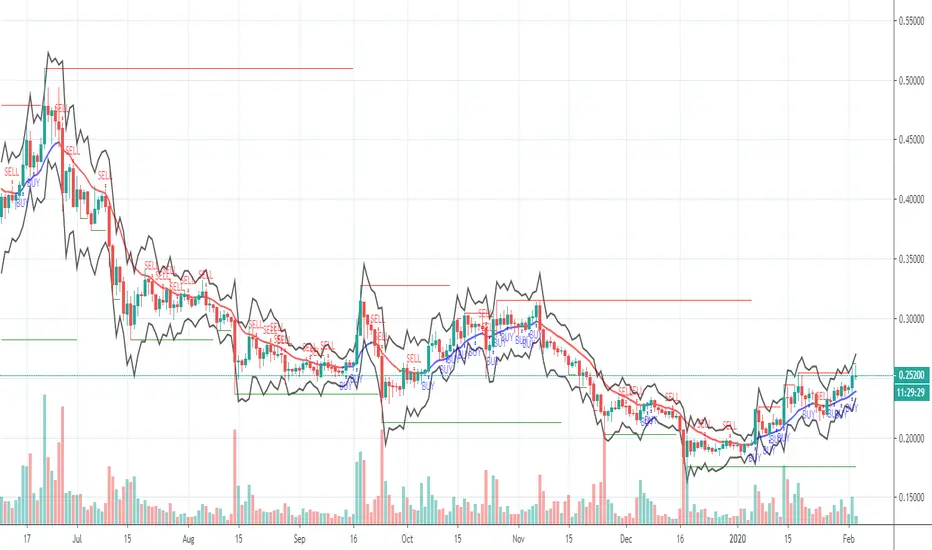
Indicator “EPI” consists of central trend line (EMA line with switches the color between red and blue), price channel, support & resistance (based on Fibonacci level and pivot points) and entry point arrows with blue and red color. The central trend line changes the color changes the color depending on the average trend, blue upwards and red downwards. While green and red horizontal lines indicates to relevant support and resistance levels, blue and red arrows allow the trader t enter the position once they appear
Parameters of the «EPI» indicator
To configure the indicator, the following parameters are provided:
Fast_period = input(5, title="Fast average period")
Slow_period = input(8, title="Slow average period")
Trend_period = input(13, title="Trend period")
Level_width = input(1, title="Level width")
Level_period = input(13, title="Level period")
upper_line = open + ema(range, Level_period) + Level_width*stdev(range, Level_period)
bottom_line = open - ema(range, Level_period) - Level_width*stdev(range, Level_period)
Rules of trading
The indicator is designed to work intraday with time frames 5, 15, 30 mins.
The first step is trend identification. Blue EMA points for upward and red for downwards trend. During upwards trend traders get only buy signals, in downwards only sell signals. Buy signals appear as an arrow with “Blue” color, red as an arrow with “Red” color. Red and Green horizontal lines stand for resistance and support level. In upwards trend the nearest resistance level acts as TP1 while the nearest support acts as SL1. In downwards trend the nearest support level acts as the TP1 level, while the nearest resistance acts as SL1 level.
Class: oscillator
Trading type: scalping & averaging
Time frame: 5 min
Purpose: trend based
Level of aggressiveness: standard
Indicator «EPI» is a trend line indicator based on EMA and oscillator for generating intraday trade signals. The EMA is a moving average that places a greater weight and significance on the most recent data points. Like all moving averages, this technical indicator is used to produce buy and sell signals based on crossovers and divergences from the historical average. While the oscillator is used in conjunction with other technical analysis indicators to make trading decisions. This tool helps the trader to identify an entry point even when there is no clear trend line formed on the graph.
Structure of the indicator «EPI»
Indicator “EPI” consists of central trend line (EMA line with switches the color between red and blue), price channel, support & resistance (based on Fibonacci level and pivot points) and entry point arrows with blue and red color. The central trend line changes the color changes the color depending on the average trend, blue upwards and red downwards. While green and red horizontal lines indicates to relevant support and resistance levels, blue and red arrows allow the trader t enter the position once they appear
Parameters of the «EPI» indicator
To configure the indicator, the following parameters are provided:
Fast_period = input(5, title="Fast average period")
Slow_period = input(8, title="Slow average period")
Trend_period = input(13, title="Trend period")
Level_width = input(1, title="Level width")
Level_period = input(13, title="Level period")
upper_line = open + ema(range, Level_period) + Level_width*stdev(range, Level_period)
bottom_line = open - ema(range, Level_period) - Level_width*stdev(range, Level_period)
Rules of trading
The indicator is designed to work intraday with time frames 5, 15, 30 mins.
The first step is trend identification. Blue EMA points for upward and red for downwards trend. During upwards trend traders get only buy signals, in downwards only sell signals. Buy signals appear as an arrow with “Blue” color, red as an arrow with “Red” color. Red and Green horizontal lines stand for resistance and support level. In upwards trend the nearest resistance level acts as TP1 while the nearest support acts as SL1. In downwards trend the nearest support level acts as the TP1 level, while the nearest resistance acts as SL1 level.
초대 전용 스크립트
이 스크립트에 대한 접근은 작성자가 승인한 사용자로 제한되며, 일반적으로 지불이 필요합니다. 즐겨찾기에 추가할 수 있지만 권한을 요청하고 작성자에게 권한을 받은 후에만 사용할 수 있습니다. 자세한 내용은 Trade24Fx에게 문의하거나 아래의 작성자의 지시사항을 따르십시오.
트레이딩뷰는 스크립트 작성자를 100% 신뢰하고 스크립트 작동 원리를 이해하지 않는 한 스크립트 비용을 지불하고 사용하는 것을 권장하지 않습니다. 대부분의 경우 커뮤니티 스크립트에서 무료로 좋은 오픈소스 대안을 찾을 수 있습니다.
차트에 이 스크립트를 사용하시겠습니까?
경고: 액세스를 요청하기 전에 읽어 보시기 바랍니다.
Авторские индикаторы
bit.ly/2oBvkHY
Больше информации на нашем ютьюб-канале
youtube.com/channel/UCYEOurJfasXWyYnrriGwsqQ
bit.ly/2oBvkHY
Больше информации на нашем ютьюб-канале
youtube.com/channel/UCYEOurJfasXWyYnrriGwsqQ
면책사항
이 정보와 게시물은 TradingView에서 제공하거나 보증하는 금융, 투자, 거래 또는 기타 유형의 조언이나 권고 사항을 의미하거나 구성하지 않습니다. 자세한 내용은 이용 약관을 참고하세요.