INVITE-ONLY SCRIPT
업데이트됨 Support & Resistance Levels Indicator

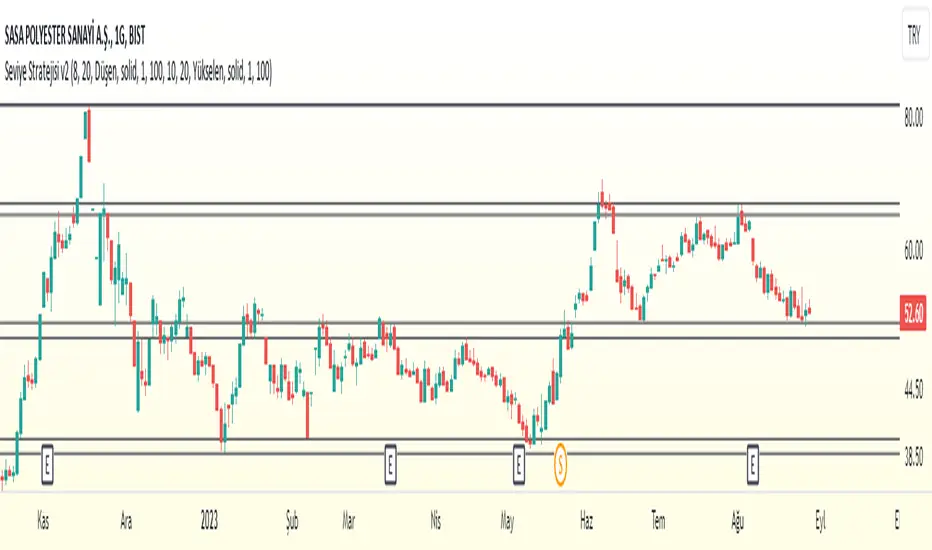
This indicator attempts to detect support and resistance levels dynamically.
How does it work?
The indicator detects the strongest support and resistance levels in a dynamic way and draw lines. When new levels appear, the indicator may delete the weak ones if necessary. In this way, the indicator guides you to follow not only the support and resistance levels but also the latest trends.
You can use the indicator with Stocks, Indices, Futures, Currencies and Cryptocurrencies.
There is an option to show support and resistance lines as ''Solid'', ''Dotted'' or ''Dashed''.
There is another option for the color of support and resistance lines. There are 17 colors to choose from.
There is also an option for the linewidth of the support and resistance lines. By using it, you can make the support or resistance lines thinner or thicker as you wish.
Use the link below to obtain access to this indicator.
릴리즈 노트
Version 2Fixed some issues.
릴리즈 노트
Version 2Fixed some issues.
릴리즈 노트
Support & Resistance Levels Indicator v2:- New Support and Resistance Indicator
- Manual Frequency Settings
- Trend Settings
- Price Labels
Seviye Stratejisi v2:
- Yeni Destek-Direnç İndikatörü
- Manuel Frekans Ayarları
- Trend Ayarları
- Fiyat Etiketleri
릴리즈 노트
Fixed some issues.릴리즈 노트
• Original 'Support & Resistance Levels' indicator moved under 'Seviye Stratejisi 'Klasik'• 'Support & Resistance Levels Indicator v2' is duplicated. One to catch levels for the 'uptrend' and one for the 'downtrend'
• Default settings are changed
• Minor updates
-------------------------------------------------------------------------------------------------------------------
• Orijinal Seviye Stratejisi, Seviye Stratejisi (Klasik) indikatörüne taşındı
• Bir tanesi 'Yükselen', diğeri 'Düşen' trend odaklı iki tane Seviye Stratejisi v2 oluşturuldu
• Varsayılan ayarlar değiştirildi
• Ufak tefek güncelleştirmeler yapıldı
초대 전용 스크립트
이 스크립트는 작성자가 승인한 사용자만 접근할 수 있습니다. 사용하려면 요청을 보내고 승인을 받아야 합니다. 일반적으로 결제 후에 승인이 이루어집니다. 자세한 내용은 아래 작성자의 지침을 따르거나 MUMLARI_KOKLAYAN_ADAM에게 직접 문의하세요.
트레이딩뷰는 스크립트 작성자를 완전히 신뢰하고 스크립트 작동 방식을 이해하지 않는 한 스크립트 비용을 지불하거나 사용하지 않는 것을 권장하지 않습니다. 무료 오픈소스 대체 스크립트는 커뮤니티 스크립트에서 찾을 수 있습니다.
작성자 지시 사항
Mail me to obtain access to the indicators:
mumlarikoklayanadam@gmail.com
İndikatörlere erişmek için aşağıdaki posta adresine mail gönderebilirsiniz:
mumlarikoklayanadam@gmail.com
Mail me to obtain access to the indicators:
mumlarikoklayanadam@gmail.com
İndikatörlere erişmek için aşağıdaki posta adresine mail gönderebilirsiniz:
mumlarikoklayanadam@gmail.com
mumlarikoklayanadam@gmail.com
İndikatörlere erişmek için aşağıdaki posta adresine mail gönderebilirsiniz:
mumlarikoklayanadam@gmail.com
면책사항
이 정보와 게시물은 TradingView에서 제공하거나 보증하는 금융, 투자, 거래 또는 기타 유형의 조언이나 권고 사항을 의미하거나 구성하지 않습니다. 자세한 내용은 이용 약관을 참고하세요.