볼륨 델타
- It considers the intrabar's volume positive and adds the value to the chart bar's total if the closing price exceeds the opening price.
- It considers the intrabar's volume negative and subtracts it from the chart bar's total if the closing price is below the opening price.
- It considers the intrabar's volume positive and adds the value to the chart bar's total if the closing price exceeds the close of the previous intrabar.
- It considers the intrabar's volume negative and subtracts it from the chart bar's total if the closing price is below the previous intrabar's close.
- If the closing price equals that of the previous intrabar, the indicator assigns the previous intrabar's positive/negative status to the current intrabar.
Inputs

Use custom timeframe
Determines whether the user manually chooses the lower timeframe. If unchecked (default), the indicator selects the timeframe automatically. Otherwise, it uses the value specified in the "Timeframe" input below.Timeframe
Specifies the intrabar timeframe used for volume delta calculation when "Use custom timeframe" is enabled. Higher timeframes provide more historical data at the cost of reduced precision. Lower timeframes cover fewer chart bars but offer higher precision. Hide masterParagraph Format볼륨 델타 인디케이터는 인트라바 거래량과 가격 변동을 사용하여 각 차트 막대 내의 매수 압력과 매도 압력의 차이(델타)를 추정하여 상품의 심리와 시장 역학에 대한 통찰력을 제공합니다.
이 인디케이터는 인트라바 시간대(즉, 차트보다 낮은 시간대)에서 각 차트 막대를 분석하여 각 인트라바의 거래량을 플러스 또는 마이너스로 분류합니다. 차트 막대 전체에서 양극화된 거래량 값을 점진적으로 누적하여 거래량 델타를 계산하고 막대 기간 동안 달성한 최고 및 최저 거래량 델타 값을 추적합니다.
막대에서 이 분석을 수행한 후 인디케이터는 결과를 나타내기 위해 캔들을 표시합니다:
- 캔들의 시가 값은 항상 0입니다.
- 캔들의 종가는 막대의 최종 거래량 델타 값을 나타냅니다.
- 고점은 막대의 지속 시간 동안 계산된 가장 높은 거래량 델타를 반영합니다.
- 저점은 막대 기간 동안 계산된 최저 거래량 델타를 반영합니다.
계산
거래량 델타 인디케이터는 각 차트 막대 내의 짧은 기간 막대에서 거래량과 가격 움직임을 스캔하여 거래량 델타 값을 계산합니다. 이를 위해서는 먼저 분석할 인트라바 기간을 결정해야 합니다.
사용자는 하위 주기를 수동으로 결정하거나 인디케이터가 주기를 결정하도록 할 수 있습니다. 기본적으로 다음 규칙을 사용하여 차트의 차트 주기를 기준으로 자동으로 주기를 선택합니다:
인트라바 주기를 수동으로 선택할 때는 주기가 짧을수록 차트 막대 범위가 줄어드는 대신 정확도가 높아진다는 점에 유의해야 합니다. 주기가 길수록 더 많은 과거 데이터를 제공하지만 거래량 델타 값의 정확도는 떨어집니다.
차트주기를 선택한 후 인디케이터는 사용 가능한 인트라바의 방향을 분석하여 거래량을 분류하고 각 바의 델타를 계산합니다.
인트라바의 시가가 종가와 같지 않은 경우:
- 종가가 시가를 초과하는 경우 인트라바의 거래량을 양수로 간주하고 차트 막대의 합계값에 해당 값을 더합니다.
- 종가가 시초가보다 낮으면 인트라바의 거래량을 음수로 간주하고 차트 막대의 합계에서 뺍니다.
인트라바의 시가와 종가가 같은 경우:
- 종가가 이전 인트라바의 종가를 초과하는 경우 인트라바의 거래량을 양수로 간주하고 차트 막대의 총계에 해당 값을 더합니다.
- 종가가 이전 인트라바의 종가보다 낮으면 인트라바의 거래량을 음수로 간주하고 차트 막대의 합계에서 뺍니다.
- 종가가 이전 인트라바의 종가와 같으면 인디케이터는 이전 인트라바의 플러스/마이너스 상태를 현재 인트라바에 할당합니다.
입력
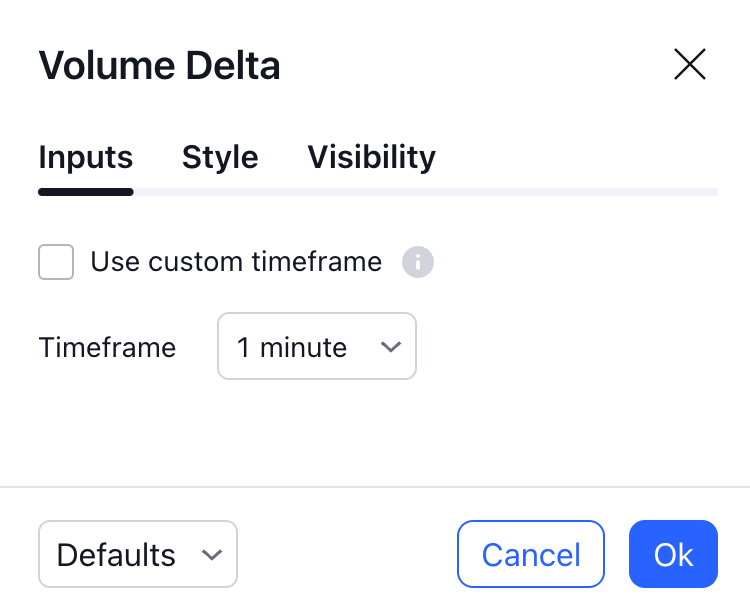
사용자 지정 차트주기 사용
사용자가 수동으로 더 낮은 기간을 선택할지 여부를 결정합니다. 선택하지 않은 경우(기본값) 인디케이터가 자동으로 기간을 선택합니다. 그렇지 않으면 아래의 "기간" 입력에 지정된 값을 사용합니다.
타임프레임
"사용자 지정 기간 사용"이 활성화된 경우 볼륨 델타 계산에 사용되는 인트라바 기간을 지정합니다. 기간이 길수록 정밀도가 떨어지지만 더 많은 과거 데이터를 제공합니다. 주기가 짧을수록 차트 막대의 수는 줄어들지만 정밀도는 높아집니다.