ZigZag WavesHello All,
I am here with a new idea and script, " Zigzag Waves ". This indicator creates 3 Zigzags with different lengths, keeps the lengths of each zigzag wave and calculates/draws average waves for each zigzag. optionally it can reset the wave when zigzag direction changes and new highest/lowest found. And optionally it draws Exponential Moving Average(EMA) of the sum of waves. This idea is very new and at the moment there is no optimization for the Zigzag Periods. Maybe we altogether can improve the idea and find the best zigzag periods for different symbols and time frames.
Using the options You can play with the periods, add/remove EMA, set its color and reset the waves on new Highest/Lowest. As far as I see resetting the waves on new Highest/Lowest may bring better results.
if we enable "Reset the waves on new Highest/Lowest":
Using different periods and EMA length:
P.S. if you have ideas to improve this script, drop a comment under the script please.
Enjoy!
Waves

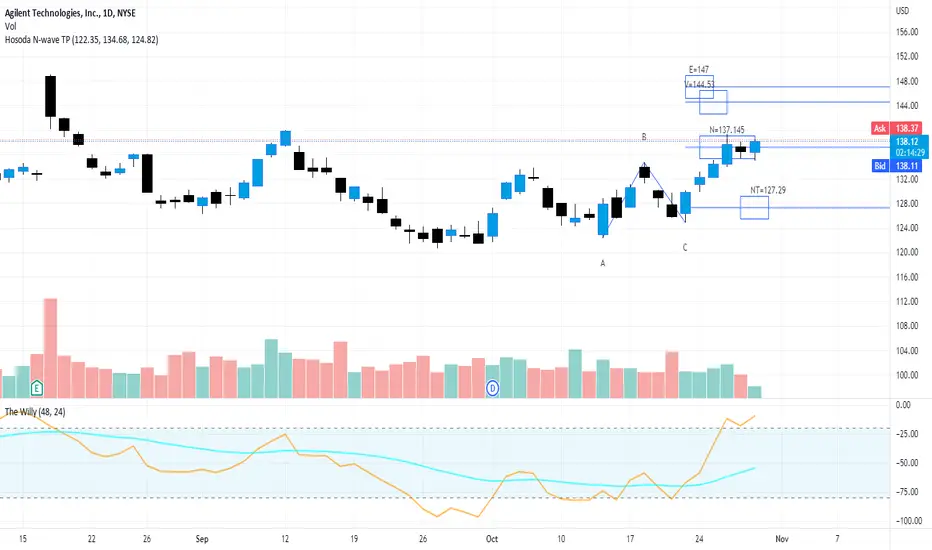
Hosoda N Wave and TPs {fmz}This script allows you to establish in a graphic and interactive way which are the N, NT, V and E targets for a Hosoda N wave.
Apply the indicator to the chart.
The interactive tool of Pine script version 5 will ask you to identify three points of "minimum-maximum-higher minimum" that form a bullish N wave of Hosoda (refer to the specific documentation for Hosoda N wave), or on the contrary three points "maximum-minimum-lower maximum" for a bearish N wave.
Once drawn, the price points can be moved.
When changing the market instrument, the indicator must be removed because it remains linked to the prices where it was first drawn.
Spread DifferentialThe Spread Differential tries to measure the speed of the market in any given direction. The histogram plots levels above or below zero in a sequence of Humps and Waves. Humps are repetitions of the previous trend before dropping to or near 0 whilst Waves are similar to Humps but the histogram must drop to or near 0 prior to forming another wave. You might notice that in no trend does the indicator ever form more than 2 waves. The indicator should be used in conjunction with the MA's selected in the panel to identify possible points of failure.

Function Square WaveThis is a script to draw a square wave on the chart, with an indicator for current price.
Markets undergoing Dow Jones or Wyckoff Accumulation/Distribution cycles tend to move in such waves, and if the period of the cycles are detected, a signal for accumulation/distribution phases can be created as an early warning.
Useful inputs:
- Average True Range as the wave height.
- Assumed Wave period as the wave duration.
I divided the current price wave by 2 to make the indicator more visually friendly.
GLHF
- DPT

Function Sawtooth WaveThis is an indicator to draw a sawtooth wave on the chart.
It can be a useful perspective, as decaying markets tend to oscillate in reverse sawtooth waves, and bullish markets can oscillate in conventional sawtooth waves. With the right inputs, it can be an early warning signal for potential movements.
Something I've noted is that large waves cause a ripple effect and sets the frequency for the market until a change occurs. Sawtooth waves may help in capturing ripple waves.
Useful inputs are:
- Average True Range as wave height (amplitude)
- Periodicity of market as wave duration (frequency)
(Inputs will change the wave from conventional to reverse)
I hope that it is helpful.
GLHF
- DPT

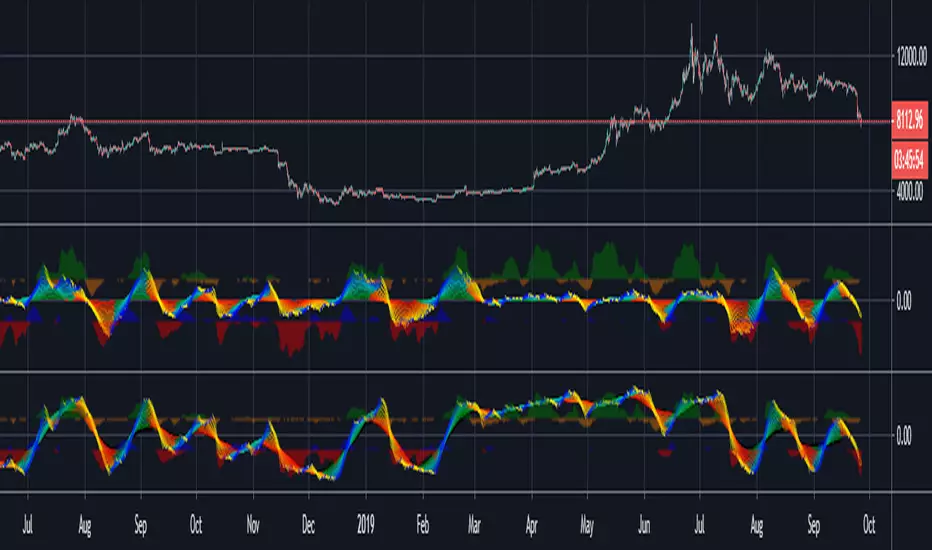
New Map For TradersUsing previous principles, This setup plots 60 moving averages on the chart. The averages are colored using a normalized oscillation technique (FFT).
To achieve the same display as above, put the same indicator twice and set the 'osx' parameter of one to 0 and the other to 2.
Feel free to play with the 'mul' parameter in ranges between 1-90. Most useful ranges will be 4-16 in my opinion.
Leave me a message if you'd like to explore the behaviors of the fractal dimension further ;)

Finnie's RSI Waves + Volume Colored CandlesUsing RSI and 4 exponential moving averages, I created this indicator so that you can spot inconsistencies between price action and RSI. There's a lot of misunderstanding surrounding RSI, most people think if something's 'oversold' buying is a guarantee win. This definitely isn't the case as there's many more variable to consider. In addition, with this indicator, candles are colored based off of volume.
INDICATOR USE:
1. Determine trend
2. Find relative support/resistance
3. Once at support/resistance look for entries:
-RSI crossing over the Short EMA (CYAN) is your fist buy/sell signal
-Short EMA (CYAN) crossing Medium EMA (YELLOW) is your second
-RSI crossing Long EMA (PINK) is your final and most accurate signal
4. Once you've made an entry, you can follow step 3. in reverse for an exit
COLORED CANDLES:
Dark Green candles = Strong Bullish volume
Light Green = Average Bullish volume
Dark Red candles = Strong Bearish volume
Light Red = Average Bearish Volume
Orange/blue means volume is conflicting with price action
I plan to add a Colored DOT over each crossover as a visual buy/sell signal if anyone has any suggestions that'd be great :)
predict lagUse the angle of multiple moving time windows to calculate the angular momentum vector across time. represent in a spectrum of frequencies\colors\transparency together with the accumulative "truth" (black)

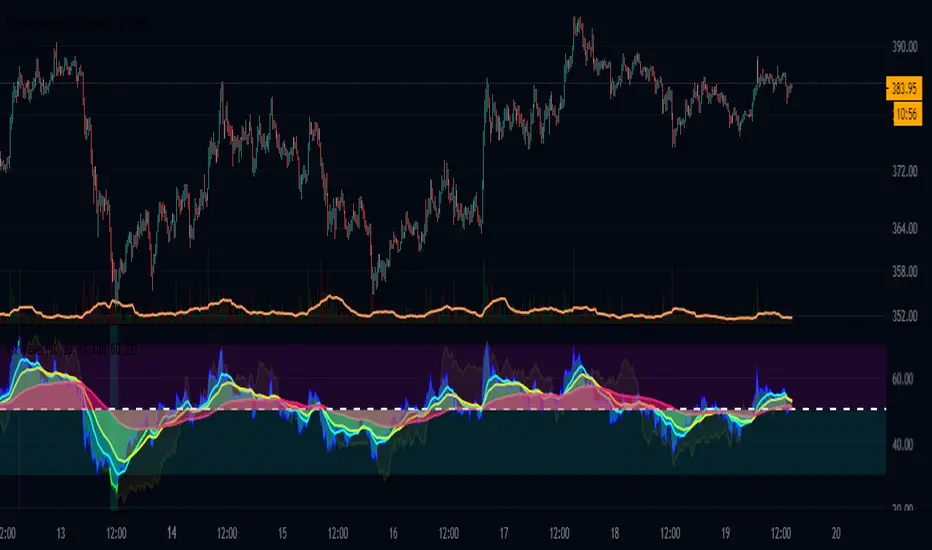
Stochastic Heat MapA series of 28 stochastic oscillators plotted horizontally and stacked vertically from bottom to top as the oscillator background.
Each oscillator has been interpreted and the value has been used to colour the lines in.
Lower lines are shorter term stochastics and higher lines are longer term stochastics.
The average of the 28 stochastics has been taken and then used to plot the fast oscillator line, which also has a slow oscillator line to follow.
The oscillator line can be used to colour in the candles.
Inputs:
MA: multiple smoothing methods
Theme: multiple colours
Increment: stochastic length start and increments
Smooth Fast: smooth fast length
Smooth Slow: smooth slow length
Paint Bars: colour candles
Waves: toggle method to weight/increment stochastics
Heat map shows momentum extremes:

Waves in Price (Volume Waves)Waves in Price (Volume Waves)
TheDowVolumeBigot>0 (Bullish) =Lime color
Very High=Dark Green color
High=Green color
TheDowVolumeBigot<0 (Bearish) =Orange color
Low=Red color
Very Low=Dark Red color
Barcolor

ToTheSunN_Community-EditionPlease share your thoughts and ideas to improve and simplify the oscillator :) will keep updating this version
ToTheMoo-Community_editionPlease share your thoguht and ideas to improve and simplefy the oscillator :) will keep updating this version

Filtered Waves [NXT2017] #Linda Raschke #basics on Arthur MerrilHI BIG PLAYERS,
this script I wrote for an enquiry of a tradingview-user. It should represent the Filtered Waves idea from Arthur Merril and used by Linda Raschke.
It's similar like a visualization of Elliott Waves.
On YouTube title "MTA UK Chapter Presentation with Linda Raschke" between 34-36 minutes Linda Raschke shows the rules for her Filterd Waves.
Any questions? Ask me!
King regards
NXT2017
========
TO MY PERSON
I'm the second winner of the official German Forex Trading Competition in 2018.
Look here to the ranks:
deutsche-trading-meisterschaften.de
I speak german, english and russian.
My strength in trading are Wolfe Wave pattern.

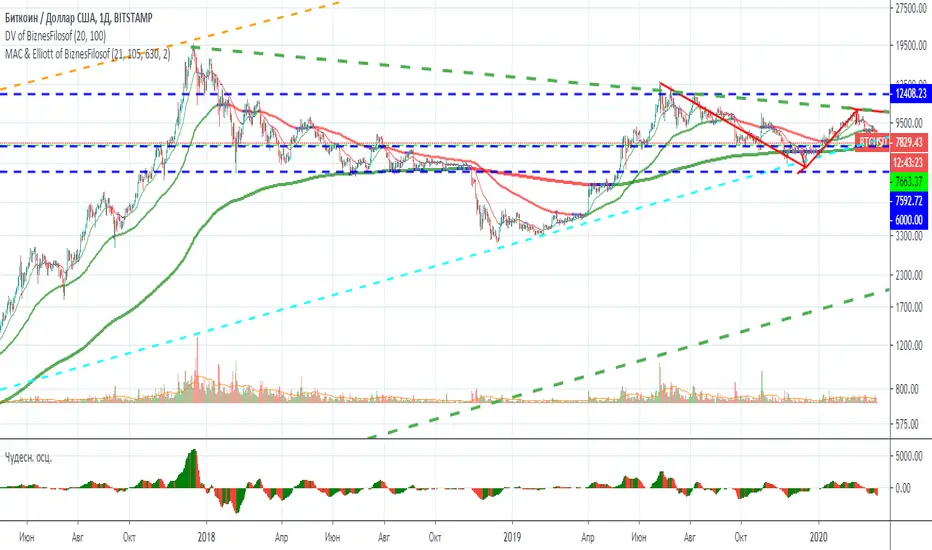
Moving Average Channel and Elliott of BiznesFilosofThis indicator is based on my indicator "MAC of BiznesFilosof", but it differs in that it shows three waves. Daily, weekly and monthly wave. Based on the color of these waves, you can easily determine the trend to use the indicator in combination with oscillators.
The main idea of this indicator is ease of use. Although I made it possible to show the corridor in the settings, but I consider it more convenient when there is a minimum of heaps on the chart. The color of the moving average perfectly shows when overbought and oversold. The idea is that the asset value is slower than the price. And it helps to enter the transaction correctly.
More details will be on my channel in YouTube.
===
Этот индикатор создан на базе моего индикатора "MAC of BiznesFilosof", но он отличается тем, что показывает три волны. Волна дневная, недельная и месячная. На основании цвета этих волн можно легко определить тренд, чтобы использовать индикатор в сочетании с осциляторами.
Основная идея данного индикатора - это простота использования. Хоть я и сделал возможность в настройках показать коридор, но считаю более удобным, когда на графике минимум нагромождений. Цвет скользящей средней прекрасно показывает, когда перекупленность и перепроданность. Идея состоит в том, что ценность актива более медленная, чем цена. И это помогает правильно входить в сделку.
Больше подробностей будет на моём канале в Ютуб.
Momentum HistogramThis creates a replica of relative distance from the moving averages, a good way to measure the strength, divergences etc.... short, mid and long term waves.
List of All my Indicators - www.tradingview.com
