Trend Volume RSI AnalysisHOW'S THIS INDICATOR DIFFERENT ?
If you are familiar with my work, then you would know that I am into creating indicators with tons of parameters, almost all of which are left for you to configure. While this gives you an incredible level of customization, the feedback I received was that some of you felt a bit overwhelmed by them.
As such, I decided to create an incredibly simple, yet effective indicator that can give you a better overview of what's going on with the security you are trading/investing in without you needing to tweak a dozen parameters. So, the first and most obvious difference you will notice with Trend Volume RSI Analysis is that you have only 1 parameter to configure (length), one checkbox to tick (highlight buy/sell zones), and one dropdown menu to choose from (the type of analysis). All unnecessary features are stripped away and all calculations are done on the backend. Now let's see if this simplicity affects the efficiency of the indicator.
HOW DOES THE INDICATOR WORK?
1. Trend Analysis
The first type of analysis, selected by default, is the Trend. It shows the balance between bulls and bears and their respective strength. In order to filter out the noise and smooth out the graph, a moving average is applied twice - once from left to right, and once from right to left. Although this causes a minor delay, it is justified since the common moving averages lag is significantly reduced. The screenshot below shows an example of a small bull run on the 1h chart.
The indicator also performs very well in spotting divergences. Two divergences (bearish and bullish respectively) are illustrated in the screenshot below.
2. Volume Analysis
Volume Analysis doesn't just sum the standard volume of the trend. Rather, it calculates the effective volume - the one responsible for moving the price up or down and seeks the relationship between total volume and price movement. Thus, you get a smooth volume trendline that should prevent you from opening a position against the trend. As logic dictates, if the buying volume is growing, then the trendline will go up and it will be in green. If, however, the selling volume is growing, the trendline will decline and it will be in red. This analysis is better used on a bigger time frame, such as on a 4h chart.
Note: For those of you who have used my other indicator Multi Time Frame Effective Volume Profile, the formula used here is slightly different. The one used there is optimized for volume bars, while the modifications here deliver a slightly better trendline with less noise.
3. RSI Analysis
Contrary to the standard RSI which derives its results from price movement, this RSI is calculated based on the modified volume. So it's fair to say that it's a Volume RSI. This makes it a bit jerkier, almost something in between an RSI and Stochastics. However, it is much better in identifying divergences and will quickly indicate potential trends as it will start climbing up sooner. The screenshot below is on a 4h chart, but that's only because I want to show more examples. It works equally well on the 1h or even on a minute chart.
In the first example, the divergence is pretty obvious on all three indicators. However, in example 2 you would be able to spot it only on Trend Volume RSI Analysis and somewhat in Stochastics. RSI makes a double bottom there. Similar is the case with example 3, where this indicator is long gone on the way up in comparison to the other two. The difference in reaction comes from the supply and demand relationship, not just from the price movement. When bears are losing steam, the indicator detects this as a low supply level, thus printing the divergence or even climbing up to indicate the start of a new mini-trend.
I must note, however, that this part of the indicator must be used in accordance with the main trend (this is where the other two analyses come into play). You go long on a pullback when there's an established bull trend and you go short on a pullback when there's an established bear trend.
4. Additional Settings
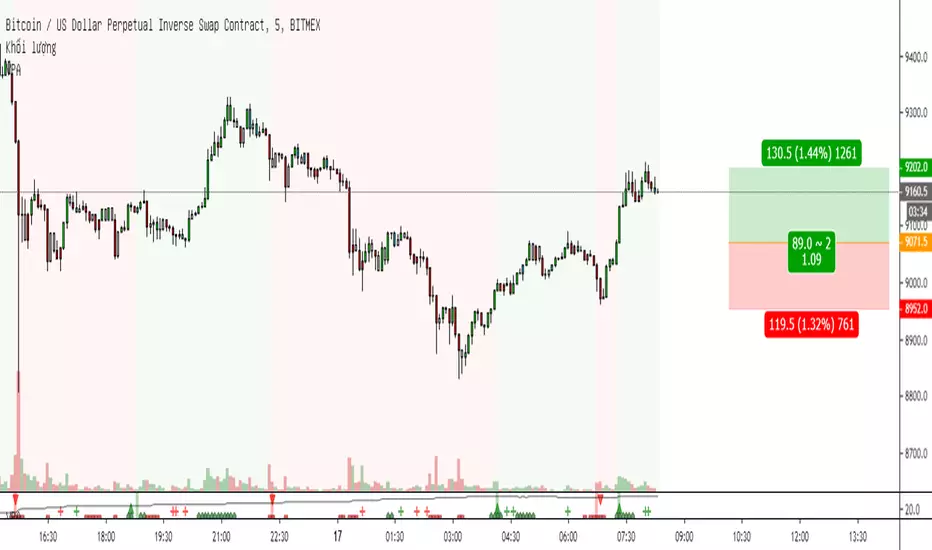
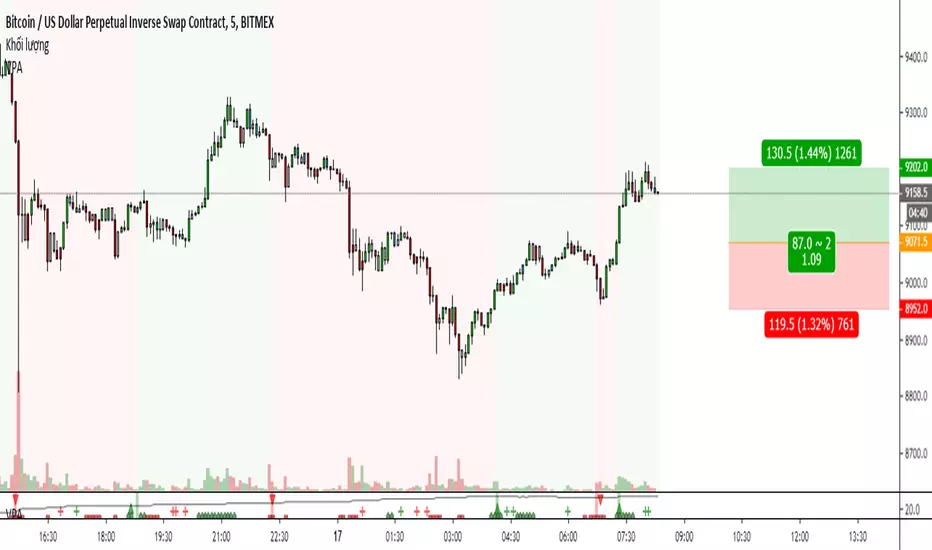
I know, for an indicator with just one parameter this description is getting pretty long. There's only one thing left to cover - highlighting the buy/sell zones. It is fairly simple - when it's ON, the zones where bulls are stronger than bears will be highlighted in green. When the opposite is true, the background will be red. You can switch it OFF if it intervenes with your analysis, but I prefer having it as it shows a confluence of bull/bear force and the indicator itself. Here's an example below:
HOW MUCH DOES THIS INDICATOR COST ?
Although Trend Volume RSI Analysis may look like an incredibly simple indicator, I can assure you that a great deal of time, testing, and optimizing have gone into creating an indicator that does almost everything for you. The initial version was much more complex and a few dozen iterations were required to reach that level of simplicity and practicality. Furthermore, I will continue to update this indicator as well as introduce user-requested features if they will improve its overall performance. To find out more about how to gain access to this indicator, please use the provided information below or just message me . Thank you for your time.
Disclaimer: The purpose of all indicators is to indicate potential setups, which may lead to profitable results. No indicator is perfect and certainly, no indicator has a 100% success rate. They are subject to flaws, wrongful interpretation, bugs, etc. This indicator makes no exception. It must be used with a sound money management plan that puts the main emphasis on protecting your capital. Please, do not rely solely on any single indicator to make trading decisions instead of you. Indicators are storytellers, not fortune tellers. They help you see the bigger picture, not the future.
Volumespreadanalysis

Multi Time Frame Trend, Volume and Momentum ProfileWHAT DOES THIS INDICATOR DO?
I created this indicator to address some of the significant inconveniences when analyzing a security, such as continually switching between different time frames to determine the trend and potential pullbacks, adding volume or volume-derived indicators, and finally, something that would help me determine the strength of the trend (maybe two additional indicators here). So I decided to code this all-in-one indicator that you can add multiple times to your chart depending on the settings you want to use, or just optimize the parameters for the particular asset and then switch between the options.
As the name suggests, it consists of three main sections - Trend , Volume , and Momentum . You have complete control over the parameters, including the Time Frames you want to use for each one (they can be different). So, let me explain each section in more detail.
HOW DOES THE INDICATOR WORK?
1. Trend Settings
In order to determine the trend, you need to set up two Moving Averages. You have a wide choice here - SMA, EMA, WMA, RMA, HMA, DEMA, TEMA, VWMA, and ALMA. Since the indicator does not plot the moving averages on the chart, I strongly suggest using this indicator along with the free "Trend Indicator for Directional Trading(main)" , which you can find in the Public Library. Once you set up the Trend Resolution, the Types of MAs, and their lengths, the indicator will generate a histogram of their convergences and divergences.
The change in colors should help you more easily determine the trend:
a) Bright Green - bull trend and price trending up (a good place to open long)
b) Dark Green - bull trend and price trending down (stay flat or open a long position with great caution)
c) Bright Red - bear trend and price trending down (a good place to open short)
d) Dark Red - bear trend and price trending up (stay flat or open a short position with great caution)
e) In addition, you can change the color palette to reflect the bull/bear trend momentum by scrolling to the bottom and selecting "Color Based on Bull/Bear Momentum", but I will discuss this in more detail below.
This part of the indicator is useful for opening a trade in the direction of the trend or for spotting a potential divergence. Both cases are illustrated below.
2. Volume Settings
The calculations for this part of the indicator are partially taken from "Multi Time Frame Effective Volume Profile" . I will quickly outline the specifics here, but if you want a more thorough understanding of how it works, please check the description of the MTF Effective Volume Profile indicator .
You have three elements with the following default settings - Resolution (5-min), Lookback (100), and Average (1). This means that the indicator will analyze the last one hundred 5-min bars and will plot a sum of only those that are at least 1 times bigger than the average. Those that are smaller than the average will be left out from the calculation. What you get is a trend line showing you accumulation/distribution based on modified volume parameters.
This part of the indicator is useful for spotting exhaustions and increased buying/selling volume that is opposite to the price trend. As you will see in the picture below, in frame 1 the selling pressure is decreasing, while buying volume is increasing. At one point supply dries out and the bulls take control, thus reverting the price. In frame 2, however, you can see that the higher high is not met with nearly as much buying volume as in the previous peak, showing that the bulls are exhausted and maybe a trend change will follow or at the very least that the bull trend will take a break.
3. Momentum Settings
The final part is an RSI smoothed through a Moving Average with the addition of some minor optimizations. Thus, the parameters you have to configure here aside from the resolution are the RSI length, the moving average that will be used, and its length. Out of the three, this is the most lagging component, but it's also the most accurate one. I must mention that due to the modified nature of this RSI, overbought and oversold levels carry less weight to the trading signals. Rather, pay attention to the change of colors, as they do so when the RSI changes direction based on preset parameters. The picture below shows such instances.
4. Additional Settings
This section consists of 4 elements:
a) Length of Trend - filters out the noise and gives a signal only when the trend becomes more established
b) ADX Threshold - filters out trading ranges and indecision zones when it's not recommended to open a trade
c) Select Analysis - choose what part of the indicator you want to see from a drop-down menu
d) Color Based on Bull/Bear Momentum - a global setting that will override the preset coloring of each indicator and will replace it with colors based on bull/bear strength and momentum - green for bulls, red for bears, and gray for non-trading zones.
The last part of this indicator is a combination of all of the above and is called a Points-Based System . It generates 3 rows of dots that go light green when bull criteria are met, orange when bear criteria are met, or gray when it's neither of the two. When you get a column of 3 green dots you get a buy signal. Similarly, a column of 3 orange dots gives you a sell signal. Grey zones are non-tradeable. It goes without saying that the frequency and quality of the signals you get will almost entirely depend on your settings, so feel free to experiment and adjust the indicator to catch the best moves for the given security.
In terms of indicator adjustments, I have left almost every part open to configuration. That is 15 parameters and 35 adjustable colors.
HOW MUCH DOES THE INDICATOR COST ?
As much as I would like to offer it for free (as some of my other ones), a great deal of work, trading logic, and testing have gone into creating this indicator. More than a few hundred iterations and a few dozen branches were required to reach the end result which is a precise combination of usefulness, simplicity, and practicality. Furthermore, this indicator will continue to be updated and user-requested features that improve its performance will be added.
Disclaimer: The purpose of all indicators is to indicate potential setups, which may lead to profitable results. No indicator is perfect and certainly, no indicator has a 100% success rate. They are subject to flaws, wrongful interpretation, bugs, etc. This indicator makes no exception. It must be used with a sound money management plan that puts the main emphasis on protecting your capital. Please, do not rely solely on any single indicator to make trading decisions instead of you. Indicators are storytellers, not fortune tellers. They help you see the bigger picture, not the future.
To find out more about how to gain access to this indicator, please use the provided information below or just message me. Thank you for your time.

Multi Time Frame Effective Volume ProfileWHAT DOES THIS INDICATOR DO?
It is a well-known fact that volume often precedes price. As such, if you can spot an increased volume early on, you can take a position before the majority joins the trend. The purpose of this indicator is to show the tactical moves of the insiders and the big players before they become obvious to everyone. Similarly, you should more easily be able to identify trend exhaustion and look to close your position.
This volume indicator is largely inspired by Pascal Willain's concept of Effective Volume described in his book "Value in Time" , which is an improvement over Larry Williams' accumulation/distribution formula. The more robust formula takes into account two very important factors:
1) the gaps that are an inevitable part of almost all securities;
2) the closing price in relation to the spread, which indicates the bull/bear strength;
I have slightly modified Pascal Willain's formula for Effective Volume and introduced a few additional features, which I believe make the indicator easier to use and understand.
HOW DOES THE INDICATOR WORK?
1. Volume Bar Deconstruction
The first significant part of this indicator is that it deconstructs the volume bar of your current trading session into one-minute volume bars, separates the significant volume, and then reconstructs the bar again. As a result, you get a new bar, in which only the significant volume is counted. Not only this, but you also get a more comprehensive view of the relationship between buying and selling that occurred on the smaller time frame.
In the screenshot below you can see that although the bears were stronger, the bulls met them with almost identical force, which resulted in absorbing the supply in 1 and then in 2 the demand drove the price up. In a traditional volume bar chart (which is also plotted), you only see the total traded volume in either red or green depending on the closing of the bar. As you would probably agree, this does not reveal the whole story.
Accumulation/distribution by large players and funds is done with great precision, which is hard to catch intraday and nearly impossible on a daily time frame. However, large orders are hard to conceal on the 1-min chart since any unusual volume sticks out like a sore thumb. The whole idea here is for you to get a comprehensive view of what's going on in the small time frame, reveal any hard to spot transactions, and then make an informed decision on your trading time frame.
To ease your analysis even further, the indicator shows you minor volume as a percent of the major volume . Since your current time frame volume bar is a sum of all buying and selling volume from a smaller time frame, you get to see a more complete picture of the buying and selling that occurred. For example, you have a total volume of 150 BTC in a single 1h volume bar, out of which 100 BTC is in selling volume and 50 BTC is in buying volume. What you will see as parameters are this: 50 (buying volume), 100 (selling volume), 50 (minor volume as a percent of the big volume, since 50/100 = 0.5 = 50%). The higher the percentage, the more even the powers between buying and selling are.
2. Volume Trend
Building upon the first feature of the indicator, you can also choose a cumulative volume trend line. It is constructed by evaluating the type of the significant volume - adding it up if the bar closes positive (green) and subtracting it if the bar closes negative (red). The evaluation is once again done on a 1-min time frame by default, but you can change that along with the count lookback period in settings.
3. Bull / Bear Equilibrium
Based upon the volume bars, Bull/Bear Equilibrium shows you the difference between buying and selling pressure under the form of a smoothed histogram. It is particularly useful not only for spotting trends early in the beginning, but also when those trends start reaching a point of exhaustion. You can then move your Stop Loss accordingly, close part of your position to preserve profits, or even look for a good entry position in the opposite direction.
HOW MUCH DOES THE INDICATOR COST ?
As much as I would like to offer it for free (as some of my other ones), a great deal of work, trading logic, and testing have gone into creating this indicator. More than a few hundred iterations and a few dozen branches were required to reach the end result which is a precise combination of usefulness, simplicity, and practicality. Furthermore, this indicator will continue to be updated and user-requested features that improve its performance will be added.
Disclaimer: The purpose of all indicators is to indicate potential setups, which may lead to profitable results. No indicator is perfect and certainly, no indicator has a 100% success rate. They are subject to flaws, wrongful interpretation, bugs, etc. This indicator makes no exception. It must be used with a sound money management plan that puts the main emphasis on protecting your capital. Please, do not rely solely on any single indicator to take trading decisions instead of you. Indicators are storytellers, not fortune tellers . They help you see the bigger picture, not the future.
To find out more about how to gain access to this indicator, please use the provided information below or just message me. Thank you for your time.

Force Index with Advanced Features [Quant_]This is the traditional Force Index indicator developed by Alexander Elder and described in his book "Trading For a Living" . As you probably know, the Force Index measures the amount of power used to move the price of an asset. The formula is pretty simple - the difference between the current and the previous close is multiplied by the volume of the current close. However, I wanted to add some additional features to the indicator, so that you have more control over it. Improvements include:
- Choose the length of the Force Index
- Choose the time frame of the FI (you can choose a smaller time frame and get a more detailed overview);
- Smoothing of the results through a Moving Average (Simple, Exponential, Weighted, Running or Hull);
- Choose the time frame of the smoothing MA for even greater control;
- Color changing depending on the increasing or decreasing smoothed Force Index;
I used to use Force Index for spotting divergences and exhaustions and it worked pretty well, but it does require some time until you get used to it. Bear in mind that you shouldn't jump against the trend on every divergence that occurs, but use it as a complementary indicator to your trading system. I am planning to add some additional features to this indicator to make it more robust, so stay tuned.
I hope you find this indicator useful. As usual, if you have any questions or suggestions on how to improve my indicators, please let me know. Thanks.

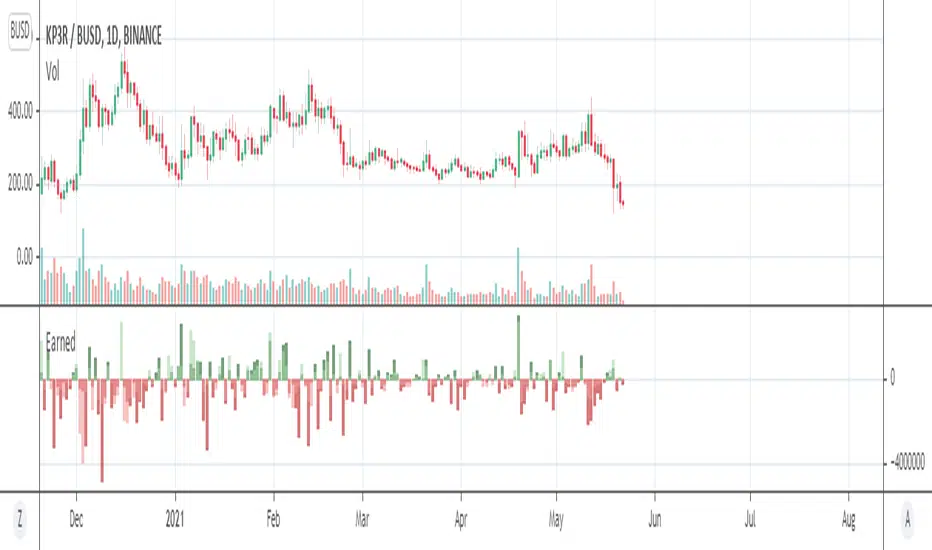
EarnedHello friends. I am glad to present for your attention one of my products based on the X-Volume indicator code. The "Earned" indicator shows how much money is earned on the market relative to actual timeframe. Accuracy is relative but nevertheless it is close to actual calculated figures.
How this information can help you? Moust easy interpritation -
1) Trend up - earnings up - bulls in the market.
2) Downward trend and earnings up - bears in the market.
3) Trend up - earnings down - fake growth.
4) Downward trend - earnings down - fake bears.
Heatmap Volume [xdecow]This indicator colors the volume bars and candles according to the volume traded. The calculation of the heat map zones is done as follows:
how many standard deviations the volume are distant from the average volume?
For a better visual experience, place the borders and wicks of the candles in a neutral color.

GreyPool VSA Signal ScannerThis Indicator combines powerful Climactic Action Volume Spread Analysis (VSA) signals and displays them on multiple time frames and 8 symbols simultaneously.
Climactic Action is defined as - Excessively large volume or an excessively large price change within a relatively short amount of time where "hidden" buying or selling is indicated.
Glossary:
Climactic Down Bar - A bar closing lower than the previous bar with above average volume and a large spread wherein the close of the bar is significantly higher than the low of the bar (Indicates "hidden" buying).
Climactic Up Bar - A bar closing higher than the previous bar with above average volume and a large spread wherein the close of the bar is significantly lower than the high of the bar (Indicates "hidden" selling).
Trap Down Bar - Also known as a "Shakeout" and occurs when price makes a new low and quickly retraces to close near the high of the bar with excessively large volume and a large spread (Indicates "hidden" buying).
Trap Up Bar - Also known as a "Shakeout" and occurs when price makes a new high and quickly retraces to close near the low of the bar with excessively large volume and a large spread (Indicates "hidden" selling).
Green Buy Signals:
- Created when Climactic Down or Trap Down bars are formed within a range of 3 bars wherein the volume is at the high or very high level and volume is consecutively increasing
Red Sell Signals:
- Created when Climactic Up or Trap Up bars are formed within a range of 3 bars wherein the volume is at the high or very high level and volume is consecutively increasing
How to Use:
1. Choose your favorite 8 trading pairs and signals will be generated for each and on the time frame that you set.
2. Setting the time frame of the indicator higher than your current chart time frame is a way to receive reliably powerful signals from this indicator the 1 hour and 2 hour time frames are particularly helpful.
3. It is also possible to add the indicator to your chart more than once and set a different time frame for each instance.
These signals do not occur often but when they do the market responds in the indicated direction with a high degree of probability.
ALERT FUNCTION INCLUDED
-You can set an alert to trigger when a signal occurs (buy or sell)

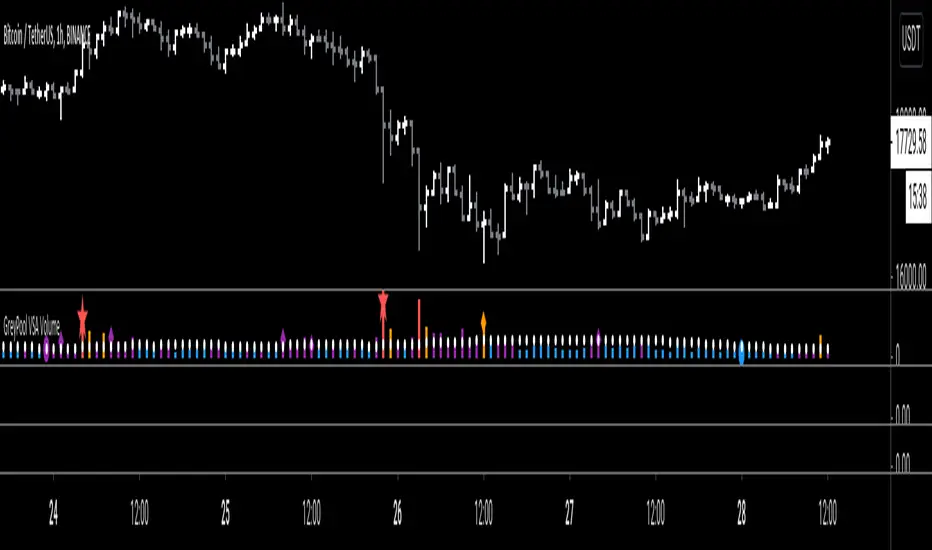
GreyPool VSA VolumeGreyPool VSA Volume Indicator
Color Key:
Blue = Below Average or Low Volume
Purple = Average Volume
Orange = High Volume
Red = Very High Volume
Symbol Key:
Circle = Test on Low Volume
Diamond = TrapUp or TrapDown Bar on High or Very High Volume
Star = Climactic Action Bar
Background Highlight Key:
Green Background = Last 3 bar were increasing high or very high volume including a climactic action DOWN bar or trap DOWN bar
Red Background = Last 3 bars were increasing high or very high volume including a climactic action UP bar or trap UP bar
Available Alerts:
When a Green or Red background appears
When a Climactic Action Up or Down bar appears
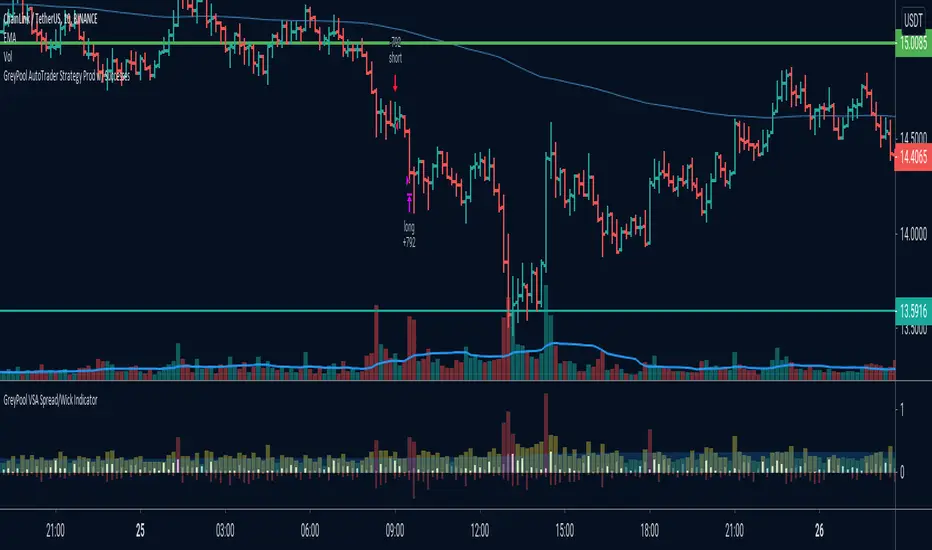
GreyPool VSA Spread/Wick Divergence IndicatorThe purpose of this indicator is to determine the distance between the spread of a bar/candle and the wick at a glance (Spread is defined as the range between the open and close and the wick is any part of the bar/candle that is beyond that range).
Climactic action bars typically have large spreads and a pronounced wick which indicates hidden buying or selling.
Definitions of Colors:
Light Blue Area - Average spread size of the last x bars where x is the set MA period
Red Column - Indicates a very high spread that is far beyond the average
Yellow Column - Indicates spreads that are at the average line or just above it
Green Column - Indicates a very low spread
Thin Red Histogram - Indicates the size of the bottom wick (Either the distance between the close and low of down bars or the open and low or up bars)
Thin Blue Histogram - Indicates the size of the top wick (Either the distance between the open and high for down bars or the close and high for up bars)
*** Please Click The LIKE Button to Support Us, Thank You ***
paratradevsa2Volume spread analysis is basically a tool to discover the correlation of price in relation to volume , in order to determine the short-term outcome of price action, in other words, where the market might be moving next.
I have developed this indicator called VSA. It tracks smart money activity and suggests the potential direction of the market.
This indicator gives signals which can be used in following ways-
-> SOW-
1. Buying Climax - For Sell.
2. Upthrust - For Sell.
-> SOS-
1. Selling Climax - For Buy.
2. Stopping Volume - For Buy.
I hope it helps people who use it and give them profitable results.
The script will be updated regularly if there are any issues.
THANK YOU.
No Repaint No Repaint on the closed candles
Access is through invite only
Do you want to use this Indicator .
To Get access - Send me a private chat message in tradingview.com to get access or request in comment section below.
If you like the script and if this useful like comment share.
Best regards and happy trading.

Volume Spread Analysis Indicators [Volume Trader]This indicator is based on Volume and Price spread analysis developed by tom williams.
It shows following indicators based on price range and volume data
Bearish Indicators
1. Buying climax
2. End of Rising Market
3. Upthrust
4. Smart selling
5. No Demand
6. VDD
Bullish Indicators
1. Selling Climax
2. End of falling
3. Stop Volume
4. Reverse Upthrust
5. Shakeout
6. VDU
6. No supply

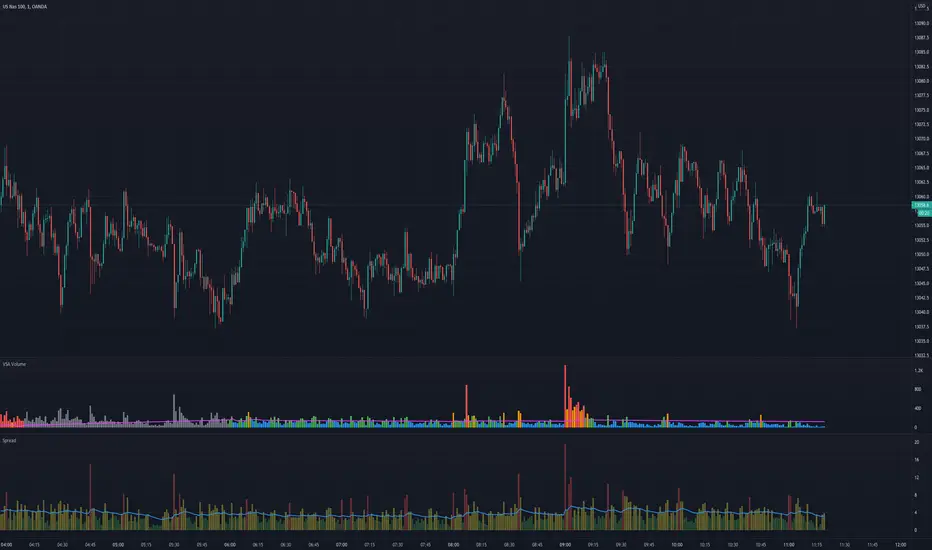
VSA VolumeVolume indicator judging level of volume per bar accordingly to Volume Spread Analysis rules. It allows either to set static volume levels or dynamic ones based on ratio comparable to Moving Average. Bars are coloured based on ratio or static levels, visually presenting level of Volume (low, average, high, ultra high).

VSA SpreadMeasures spread of the candle, useful especially for Volume Spread Analysis (VSA) and to measure trend strength. Spread is coloured based on level comparable to Moving Average.
VSA Trading Assistant DashboardThe VSA Trade Assistant is a fully featured data dashboard and information management tool that visually tracks, analyzes and displays key performance indicators in any BTC related market on Trading View
This indicator recognizes climatic up and down bars including when their vol is very high (at least 100 percent of the bar is above the average vol line) and when the subsequent bar is in the opposite direction of the climactic move.
The composite volume of 7 different exchanges is used by this indicator to determine when climactic volume has occurred.
Leave feedback, we'll be adding features to this indicator over time

Volume Price Analysis 2Best indicator for volume price analysis:
-Trend detection
-Breakout detection
-Fakeout detection
Use pure candlestick chart and volume .
No need to use any other indicator.
You can feel about the battle between bulls and bears.
Read my book for more information!
Volume Price Analysis Best indicator for volume price analysis:
-Trend detection
-Breakout detection
-Fakeout detection
Use pure candlestick chart and volume.
No need to use any other indicator.
You can feel about the battle between bulls and bears.
Read my book for more information!
Volume Spread IndicatorVolume Spread Indicator is based on my understanding of Volume Spread Analysis (VSA). VSA is the third approach for analyzing the price of a stock, forex or cryptocurrency. VSA looks for the difference between supply and demand that are created by a professional trader, institutional players which are called Smart Money.
This Indicator shows SV(Stopping Volume), NS (No Supply), ND (No Demand), -RC( Reverse Candle). Stopping volume and No supply appearing at key support level indicates Bullish Reversal. -RC and ND appearing at key resistance level indicate Bearish Reversal. This indicator can be used as Bottom and Top.
This Indicator can be used effectively with the combination of AutoFibe indicator, Scalping sell and buy Indicator.
Stopping Volume is shown as SV
No Demand is shown as a triangle down (Red)
No Supply is shown as a triangle up (Green)
Reverse Candle is shown as -RC

Relative Volume - VPA / VSA / Better VolumeVolume is important.
Volume is VERY important.
But all the existing methods of volume analysis and order flow analysis fall into the same trap: they're all extremely complicated, hard to learn, and difficult for the human brain to distill down to an actual, tradable signal.
The Relative Volume Gradient Paintbars indicator seeks to address this issue by reducing and simplifying concepts from Volume Price Analaysis (VPA), Volume Spread Analysis (VSA), and Market Profile / Volume Profile into a single indication with varying levels of intensity. Rather than adding more complex symbology and cluttering up your charts with arrows and signals and lines as many volume indicators do, relative volume intuitively takes advantage of the dimension of color, and plays to your brain's automatic recognition of color intensity to highlight areas of interest on a chart where large volumes are being traded. These areas can in turn point out levels of support and resistance, or show strength in a move, exposing the actions of larger market participants that are behind a move.
The Relative Volume indicator can calculate based on a time-segmented / time-based / bar-specific average of volume, adjusting for some of the typical spikes in volume that happen at the beginning and end of a trading day; Or it can be calculated based on any length and type of moving average of volume that is desired: simple, exponential, weighted, Wilders, price-weighted, Hull, or TEMA.
This indicator does more than just normal relative share volume. It can also do relative volume-per-range. The idea behind this setting is that when more volume is being traded but very little movement is happening, this can indicate substantial support or resistance, where a lot of trades are likely being absorbed by larger operators. You can choose your own range calculation for this setting, whether you prefer True Range, high-low range, candle body range, close to close range, or any of several other custom settings.
Moreover, the levels or thresholds at which the color intensity changes are completely user-controlled, so you can adjust them upward to tune out more noise, or downward to increase the level of sensitivity. In addition, all of the colors for each of the thresholds are completely user-controlled.
We hope to see TradingView add support for Richard Arms' CandleVolume or Equivolume before too long, as well as Tick Volume or Trade Count Volume data, all of which can add a lot of power to this method of trading.
SignalToSignal.com - Logical Volume Trading SystemOur Logical Volume Trading System is a vast improvement on ‘standard’ volume spread analysis. Based on 15+ year combined experience with our Smart Volume Spread Analysis software, we have refined our analysis and algorithms to provide the most powerful VSA indicator on TradingView.
Combining fundamental analysis, technical analysis, and volume analysis into a powerful methodology that enables you to trade the markets in a way that is uniquely accurate.
The Signal to Signal Logical Volume Trading System quickly handles time-consuming manual background analysis, volume analysis, and signal analysis leaving you free to make considered and knowledgeable trading decisions instantly.
We have refined our price action and volume analysis algorithms to focus on the core trading signals, which often precede large moves, providing you with clear insight and a roadmap to trading successfully.
Due to unique characteristics of the Pine programming language that TradingView indicators utilize, we have also made adjustments to the signal validation and advisor systems. The result is a clean, easy to read chart which allows you to recognize strong setups as soon as they form.
Lastly, our Logical Volume Trading System is customizable. You can choose which signals and advisor warnings are enabled, allowing you test any number of ideas and analysis combinations. Of course the system is optimized for most charts by default so you can get started right away.
To gain access to the Logical Volume Trading System, please visit our website .
If you have any questions, please contact us through the Contact link on our website - signaltosignal.com
