Aura Squeeze Projections [Pineify]Pineify - Aura Squeeze Projections
This indicator combines the volatility compression detection of the TTM Squeeze methodology with an innovative "aura glow" visualization, offering traders a clear and aesthetically distinct way to identify low-volatility consolidation phases and anticipate breakout directions. By merging Bollinger Bands, Keltner Channels, and linear regression momentum analysis, the Aura Squeeze Projections provides actionable squeeze signals with directional bias.
Key Features
Visual "aura glow" effect highlighting squeeze zones and momentum shifts
Squeeze detection combining Bollinger Bands and Keltner Channels
Linear regression-based momentum for directional bias
Dynamic candle coloring reflecting current market state
Squeeze start and release signal markers
How It Works
The core logic identifies volatility compression by comparing Bollinger Bands to Keltner Channels. When the Bollinger Bands contract inside the Keltner Channel boundaries (BB upper < KC upper AND BB lower > KC lower), the market enters a "squeeze" state — a period of low volatility that often precedes significant price movement.
Momentum direction is calculated using a linear regression slope of the difference between price and its moving average. A positive slope indicates bullish momentum; negative indicates bearish momentum. This determines the anticipated breakout direction when the squeeze releases.
How Multiple Indicators Work Together
Bollinger Bands measure statistical volatility through standard deviation, expanding during high volatility and contracting during consolidation. Keltner Channels use Average True Range (ATR) for a smoother volatility envelope. When BB fits entirely within KC, volatility has compressed below normal levels — the squeeze condition.
The linear regression momentum component adds directional intelligence. Rather than simply detecting compression, it forecasts the likely breakout direction by analyzing the trend slope of price deviation from its mean. This synergy transforms a binary squeeze signal into an actionable directional setup.
Unique Aspects
The "aura glow" visualization creates gradient fills between the trend midline and Keltner boundaries, providing an intuitive heat-map style view of market conditions. Colors transition dynamically: gray during squeeze (consolidation), green for bullish momentum, and red for bearish momentum. This makes market state immediately recognizable at a glance.
How to Use
Watch for the gray squeeze state indicating volatility compression
Note the circle marker appearing above bars when squeeze begins
Observe when the diamond marker appears below bars — squeeze release
The color at release (green/red) indicates anticipated breakout direction
Use candle coloring for confirmation of momentum alignment
Customization
Lookback Length : Adjusts sensitivity (shorter = more signals, longer = fewer but stronger)
BB/KC Multipliers : Fine-tune squeeze detection threshold
Use EMA : Toggle between EMA (smoother) or SMA for the midline basis
Aura Transparency : Control visual intensity of the glow effect
Conclusion
Aura Squeeze Projections offers a refined approach to squeeze-based trading by combining proven volatility compression detection with momentum-based directional analysis and distinctive visual presentation. The indicator helps traders identify consolidation periods and prepare for breakouts with directional confidence. Best used alongside price action analysis and support/resistance levels for confirmation.
Ttm_squeeze

TTM Squeeze Screener [Pineify]TTM Squeeze Screener for Multiple Crypto Assets and Timeframes
This advanced TradingView Pine script, TTM Squeeze Screener, helps traders scan multiple crypto symbols and timeframes simultaneously, unlocking new dimensions in momentum and volatility analysis.
Key Features
Screen up to 8 crypto symbols across 4 different timeframes in one pane
TTM Squeeze indicator detects volatility contraction and expansion (“squeeze”) phases
Momentum filter reveals potential breakout direction and strength
Visual screener table for intuitive multi-asset monitoring
Fully customizable for symbols and timeframes
How It Works
The heart of this screener is the TTM Squeeze algorithm—a hybrid volatility and momentum indicator leveraging Bollinger Bands, Keltner Channels, and linear momentum analysis. The script checks whether Bollinger Bands are “squeezed” inside Keltner Channels, flagging periods of low volatility primed for expansion. Once a squeeze is released, the included momentum calculation suggests the likely breakout direction.
For each selected symbol and timeframe, the screener runs the TTM Squeeze logic, outputs “SQUEEZE” or “NO SQZ”, and tags momentum values. A table layout organizes the results, allowing rapid pattern recognition across symbols.
Trading Ideas and Insights
Spot multi-symbol volatility clusters—ideal for finding synchronized market moves
Assess breakout potential and direction before entering trades
Scalping and swing trading decisions are enhanced by cross-timeframe momentum filtering
Portfolio managers can quickly identify which assets are about to move
How Multiple Indicators Work Together
This screener unites three essential concepts:
Bollinger Bands : Measure volatility using standard deviation of price
Keltner Channels : Define expected price range based on average true range (ATR)
Momentum : Linear regression calculation to evaluate the direction and intensity after a squeeze
By combining these, the indicator not only signals when volatility compresses and releases, but also adds directional context—filtering false signals and helping traders time entries and exits more precisely.
Unique Aspects
Multi-symbol, multi-timeframe architecture—optimized for crypto traders and market scanners
Advanced table visualization—see all signals at a glance, minimizing cognitive overload
Modular calculation functions—easy to adapt and extend for other asset classes or strategies
Real-time, low-latency screening—built for actionable alerts on fast-moving markets
How to Use
Add the script to a TradingView chart (works on custom layouts)
Select up to 8 symbols and 4 timeframes using input fields (defaults to BTCUSD, ETHUSD, etc.)
Monitor the screener table; “SQUEEZE” highlights assets in potential breakout phase
Use momentum values to judge if the squeeze is likely bullish or bearish
Combine screener insights with manual chart analysis for optimal results
Customization
Symbols: Easily set any ticker for deep market scanning
Timeframes: Adjust to match your trading horizon (scalping, swing, long-term)
Indicator parameters: Refine Bollinger/Keltner/Momentum settings for sensitivity
Visuals: Personalize table layout, color codes, and formatting for clarity
Conclusion
In summary, the TTM Squeeze Screener is a robust, original TradingView indicator designed for crypto traders who demand a sophisticated multi-symbol, multi-timeframe edge. Its combination of volatility and momentum analytics makes it ideal for catching explosive breakouts, managing risk, and scanning the market efficiently. Whether you’re a scalper or swing trader, this screener provides the insights needed to stay ahead of the curve.

TTM Squeeze Momentum MTF [Cometreon]TTM Squeeze Momentum MTF combines the core logic of both the Squeeze Momentum by LazyBear and the TTM Squeeze by John Carter into a single, unified indicator. It offers a complete system to analyze the phase, direction, and strength of market movements.
Unlike the original versions, this indicator allows you to choose how to calculate the trend, select from 15 different types of moving averages, customize every parameter, and adapt the visual style to your trading preferences.
If you are looking for a powerful, flexible and highly configurable tool, this is the perfect choice for you.
🔷 New Features and Improvements
🟩 Unified System: Trend Detection + Visual Style
You can decide which logic to use for the trend via the "Show TTM Squeeze Trend" input:
✅ Enabled → Trend calculated using TTM Squeeze
❌ Disabled → Trend based on Squeeze Momentum
You can also customize the visual style of the indicator:
✅ Enable "Show Histogram" for a visual mode using Histogram, Area, or Column
❌ Disable it to display the classic LazyBear-style line
Everything updates automatically and dynamically based on your selection.
🟩 Full Customization
Every base parameter of the original indicator is now fully configurable: lengths, sources, moving average types, and more.
You can finally adapt the squeeze logic to your strategy — not the other way around.
🟩 Multi-MA Engine
Choose from 15 different Moving Averages for each part of the calculation:
SMA (Simple Moving Average)
EMA (Exponential Moving Average)
WMA (Weighted Moving Average)
RMA (Smoothed Moving Average)
HMA (Hull Moving Average)
JMA (Jurik Moving Average)
DEMA (Double Exponential Moving Average)
TEMA (Triple Exponential Moving Average)
LSMA (Least Squares Moving Average)
VWMA (Volume-Weighted Moving Average)
SMMA (Smoothed Moving Average)
KAMA (Kaufman’s Adaptive Moving Average)
ALMA (Arnaud Legoux Moving Average)
FRAMA (Fractal Adaptive Moving Average)
VIDYA (Variable Index Dynamic Average)
🟩 Dynamic Signal Line
Apply a moving average to the momentum for real-time cross signals, with full control over its length and type.
🟩 Multi-Timeframe & Multi-Ticker Support
You're no longer limited to the chart's current timeframe or ticker. Apply the squeeze to any symbol or timeframe without repainting.
🔷 Technical Details and Customizable Inputs
This indicator offers a fully modular structure with configurable parameters for every component:
1️⃣ Squeeze Momentum Settings – Choose the source, length, and type of moving average used to calculate the base momentum.
2️⃣ Trend Mode Selector – Toggle "Show TTM Squeeze Trend" to select the trend logic displayed on the chart:
✅ Enabled – Shows the trend based on TTM Squeeze (Bollinger Bands inside/outside Keltner Channel)
❌ Disabled – Displays the trend based on Squeeze Momentum logic
🔁 The moving average type for the Keltner Channel is handled automatically, so you don't need to select it manually, even if the custom input is disabled.
3️⃣ Signal Line – Toggle the Signal Line on the Squeeze Momentum. Select its length and MA type to generate visual cross signals.
4️⃣ Bollinger Bands – Configure the length, multiplier, source, and MA type used in the bands.
5️⃣ Keltner Channel – Adjust the length, multiplier, source, and MA type. You can also enable or disable the True Range option.
6️⃣ Advanced MA Parameters – Customize the parameters for advanced MAs (JMA, ALMA, FRAMA, VIDYA), including Phase, Power, Offset, Sigma, and Shift values.
7️⃣ Ticker & Input Source – Select the ticker and manage inputs for alternative chart types like Renko, Kagi, Line Break, and Point & Figure.
8️⃣ Style Settings – Choose how the squeeze is displayed:
Enable "Show Histogram" for Histogram, Area, or Column style
Disable it to show the classic LazyBear-style line
Use Reverse Color to invert line colors
Toggle Show Label to highlight Signal Line cross signals
Customize trend colors to suit your preferences
9️⃣ Multi-Timeframe Options - Timeframe – Use the squeeze on higher timeframes for stronger confirmation
🔟 Wait for Timeframe Closes -
✅ Enabled – Prevents multiple signals within the same candle
❌ Disabled – Displays the indicator smoothly without delay
🔧 Default Settings Reference
To replicate the default settings of the original indicators as they appear when first applied to the chart, use the following configurations:
🟩 TTM Squeeze (John Carter Style)
Squeeze
Length: 20
MA Type: SMA
Show TTM Squeeze Trend: Enabled
Bollinger Bands
Length: 20
Multiplier: 2.0
MA Type: SMA
Keltner Channel
Length: 20
Multiplier: 1.0
Use True Range: ON
MA Type: EMA
Style
Show Histogram: Enabled
Reverse Color: Enabled
🟩 Squeeze Momentum (LazyBear Style)
Squeeze
Length: 10
MA Type: SMA
Show TTM Squeeze Trend: Disabled
Bollinger Bands
Length: 20
Multiplier: 1.5
MA Type: SMA
Keltner Channel
Length: 10
Multiplier: 1.5
Use True Range: ON
MA Type: SMA
Style
Show Histogram: Disabled
Reverse Color: Disabled
⚠️ These values are intended as a starting point. The Cometreon indicator lets you fully customize every input to fit your trading style.
🔷 How to Use Squeeze Momentum Pro
🔍 Identifying Trends
Squeeze Momentum Pro supports two different methods for identifying the trend visually, each based on a distinct logic:
Squeeze Momentum Trend (LazyBear-style):
Displays 3 states based on the position of the Bollinger Bands relative to the Keltner Channel:
🔵 Blue = No Squeeze (BB outside KC and KC outside BB)
⚪️ White = Squeeze Active (BB fully inside KC)
⚫️ Gray = Neutral state (none of the above)
TTM Squeeze Trend (John Carter-style):
Calculates the difference in width between the Bollinger Bands and the Keltner Channel:
🟩 Green = BB width is greater than KC → potential expansion phase
🟥 Red = BB are tighter than KC → possible compression or pre-breakout
📈 Interpreting Signals
Depending on the active configuration, the indicator can provide various signals, including:
Trend color → Reflects the current compression/expansion state (based on selected mode)
Momentum value (above or below 0) → May indicate directional pressure
Signal Line cross → Can highlight momentum shifts
Color change in the momentum → May suggest a potential trend reversal
🛠 Integration with Other Tools
Squeeze Momentum Pro works well alongside other indicators to strengthen market context:
✅ Volume Profile / OBV – Helps confirm accumulation or distribution during squeezes
✅ RSI – Useful to detect divergence between momentum and price
✅ Moving Averages – Ideal for defining primary trend direction and filtering signals
☄️ If you find this indicator useful, leave a Boost to support its development!
Every piece of feedback helps improve the tool and deliver an even better trading experience.
🔥 Share your ideas or feature requests in the comments!

LNL Squeeze ArrowsIf you struggle with the entries, low % win rate or trading the squeeze setup overall, this indicator is for you!
If you look closely at your losing trades, chances are the losers have one thing in common = inverse momentum. I created this tool after I found out that Stacked EMAs and picture perfect trend is not the only thing you need for a squeeze setup. Squeeze arrows pinpoint the exact moment where the squeeze momentum change happens (momentum change is absolutely crucial for the squeeze setup). These arrows will help you stay out of "everything was aligned but still failed" type of setups.
Squeeze Arrows:
1. Momentum Arrows (cyan blue/red) - Showing the best possible moment for an entry during the squeeze (after you see one, you can expect the squeeze to fire soon).
2. Slingshot Arrows (yellow) - Even though you can trade off of them, these arrows work mostly as a confirmation & caution tool. If an inverse slingshot arrow is plotted during a squeeze that means caution = you should wait because momentum is not on your side thus there there is a quite high probability that the squeeze can fire the other direction.
Squeeze Dots Trigger:
Represents the number of red dots (squeeze) after which the arrows should plot. Default = 5 (only after 5 red dots, arrows will appear), some traders like to set it on 3 or even 1.
Tips & Tricks:
1.Breakout or Bailout Mentality
- The big advantage of the arrows is the fact that they either work straight away or they don't. This is where you can apply the breakout or bailout mentality and really focus exclusively on the breakout part of the whole squeeze move. You can minimize the risk by putting mental stops just a few points below the last low of the candle where the arrows appeared. That way you can be stopped out even during the squeeze = won't hurt as much as when the squeeze fire the opposite direction. Reward may be the same but the risk is lower.
2. Yellow Flags
- Use the slingshot arrows as a caution tool. Even if all your squeeze criteria are met. Yellow inverse arrow = caution (wait for the true momentum change). Once the slingshot arrow appears in the conext of the trend, you are good to go.
3. Last Arrow Rule
- Sometimes you will see a lot of arrows during the longer squeezes. This is where the last arrow rule come in handy. The last arrow you see on chart can be canceled anytime by a new one. The last arrow is the valid one!
Hope you can squeeze from these squeeze arrows as much as there is to squeeze so you can finally trade the squeeze with ease.
Hope it helps.

Multi-Timeframe TTM Squeeze Pro
IMPORTANT NOTE:
-> The timeframe for this indicator must be set at 1 minute;
-> If the chart timeframe is higher than 1 minute, the results shown in the table for timeframes lower than the chart will not be correct;
-> Tradingview's own documentation explains this as follows: " It is not recommended to request data of a timeframe lower that the current chart timeframe, for example 1 minute data from a 5 minutes chart. The main problem with such a case is that some part of a 1 minute data will be inevitably lost, as it’s impossible to display it on a 5 minutes chart and not to break the time axis. In such cases the behavior of security can be rather unexpected "; and
-> It is therefore recommended that this indicator is placed in a standalone 1min chart window, and the window resized to only show the table to avoid any issues.
Credits:
-> John Carter creating the TTM Squeeze and TTM Squeeze Pro
-> Lazybear's original interpretation of the TTM Squeeze: Squeeze Momentum Indicator
-> Makit0's evolution of Lazybear's script to factor in the TTM Squeeze Pro upgrades - Squeeze PRO Arrows
This is my version of their collective works, with amendments primarily to the Squeeze Conditions to more accurately reflect the color coding used by the official TMM Squeeze Pro indicator.
TTM Squeeze Guide
For those unfamiliar with the TTM Squeeze, it is simply a visual way of seeing how Bollinger Bands (standard deviations from a simple moving average ) relate to Keltner Channels ( average true range bands) compared with the momentum of the price action. The concept is that as Bollinger Bands compress within Keltner Channels , price volatility decreases, giving way for a potential explosive price movement up or down.
Differences between the original TTM Squeeze and TTM Squeeze Pro:
-> Both use a 2 standard deviation Bollinger Band ;
-> The original squeeze only used a 1.5 ATR Keltner Channel; and
-> The pro version uses 1.0, 1.5 and 2.0 ATR Keltner Channels .
The pro version therefore helps differentiate between levels of squeeze (compression) as the Bollinger Bands moves through the Keltner Channels i.e. the greater the compression, the more potential for explosive moves - less compression means more squeezing.
The Histogram shows price momentum whereas the colored dots (along the zeroline) show where the Bollinger Bands are in relation to the Keltner Channels:
-> Cyan Bars = positive, increasing momentum;
-> Blue Bars = positive, decreasing momentum (indication of a reversal in price direction);
-> Red Bars = negative, increasing momentum;
-> Yellow Bars = negative, decreasing momentum (indication of a reversal in price direction);
-> Orange Dots = High Compression / large squeeze (One or both of the Bollinger Bands is inside the 1st (1.0 ATR) Keltner Channel);
-> Red Dots = Medium Squeeze (One or both of the Bollinger Bands is inside the 2nd (1.5 ATR) Keltner Channel);
-> Black Dots = Low compression / wide squeeze (One or both of the Bollinger Bands is inside the 3rd (2.0 ATR) Keltner Channels );
-> Green Dots = No Squeeze / Squeeze Fired (One or both of the Bollinger Bands is outside of the 3rd (2.0 ATR) Keltner Channel).
Ideal Scenario:
As the ticker enters the squeeze, black dots would warn of the beginning of a low compression squeeze. As the Bollinger bands continue to constrict within the Keltner Channels , red dots would highlight a medium compression. As the price action and momentum continues to compress an orange dot shows warning of high compression. As price action leaves the squeeze, the coloring would reverse e.g. orange to red to black to green. Any compression squeeze is considered fired at the first green dot that appears.
Note: This is an ideal progression of the different types of squeezes, however any type of squeeze (and color sequence) may appear at anytime, therefore the focus is primarily on the green dots after any type of compression.
Entry and Exit Guide:
-> John Carter recommends entering a position after at least 5 black dots or wait for 1st green dot ; and
-> Exit on second blue or yellow bar or, alternatively, remain in the position after confirming a continuing trend through a separate indicator.
Standalone Indicator:
The indicator (which can be used on any timeframe) can be found here:

Matrix Series and Vix Fix with VWAP CCI and QQE SignalsBased on @ChrisMoody Williams_VIX_Fix and @glaz Matrix Series .
This indicator identify potential zone of reversal according to momentum and volatility.
Includes VWAP CCI and QQE Signals.

TMO with TTM SqueezeApplication of the TTM squeeze and the short-term momentum TTM Wave A in action. This is an example where the short-term wave will react faster than the TTM to give you a signal to start building your positions.
This indicator needs to be combined with "TTM Wave A" (add to existing pane).
The TTM Squeeze works like a better MACD. There is a zeroline and histogram bars above / below represent positive and negative momo. As the height of the bar decreases when above the zeroline, that is called decreasingly positive momo and as the height of the bar decreases when below the zeroline, that is called decreasingly negative momo. The dots on the TTM Squeeze: Red dots represent consolidation where Bollingers are inside the Keltner Channels and green dots represent a move out of consolidation or "squeeze fire". As price action comes out of consolidation there is a bigger move up/down depending on where momo is heading and where prices are (key support/resistance levels, fib areas). You want to use the TTM Squeeze and A wave TOGETHER - TTM Squeeze is your main momo and your A wave is a short-term momo wave that reacts faster and works as a leading gauge. You need to use them TOGETHER to gauge where price action may be heading. When the TTM Squeeze and A wave move lockstep together, let's say both are decreasingly positive, there is a good probability it continues to move in that direction to the next support levels. TWO bars on the TTM Squeeze of different heights is confirmation that in most cases means it will move in the direction of those bars. So if decreasingly positive, you'll see two darker bars. By the time you get your 2nd bar on the TTM Squeeze, it is often too late or you're losing profit. Way to counter that is after you get one darker bar in the opposite direction of current trend, use A wave to "predict" the next wave, the more A wave histogram bars going towards the other direction, the higher the certainty it will hit. Lastly, using these waves together works best when you look at it on MULTIPLE TIME FRAMES. (Credit for this details goes to Brady from Atlas).

Squeeze Momentum Indicator [LazyBear] vX by DGTModified version of Squeeze Momentum Indicator visualizing on Price Chart
author: LazyBear, modified by KıvançÖZBİLGİÇ

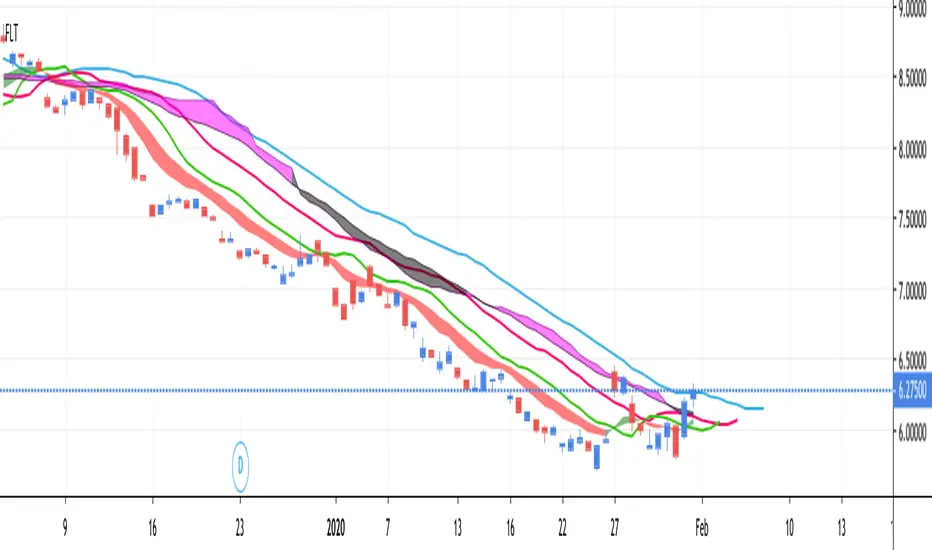
FLT - Fully Loaded TacoThis is a very full indicator.
NOTICE: By default, ALL indicators are turned off in the settings, except for the Bollinger Band, in order to facilitate faster load times.
Features can easily be turned on/off in the settings. You can have as many or as few as you want.
FEATURE LIST:
3 SMAs (Fast, Medium, Slow)
3 EMAs (Fast, Medium, Slow)
Support & Resistance Lines (Lime Color)
Parabolic Support & Resistance (Red dots above, Blue dots below)
Keltner Channel (purple channel lines)
Bollinger Band (Blue Cloud; Center & Borders hidden by default)
TTM Squeeze (Purple Background Color on Chart)
VWAP (Vibrant Blue Glowing Line, Intraday Only)
Fibonacci Retracement (Multicolor, Intraday Only)
Ichimoku Cloud (Standard Colors)
VW EMA CCI + TTM Volume Weighted EMA CCI + TTM squeeze in one indicator
Credit goes to SpreadEagle 71 for the CCI and Greeny for the TTM
