Another New Adaptive Moving Average [CC]The New Adaptive Moving Average was created by Scott Cong (Stocks and Commodities Mar 2023) and this is a companion indicator to my previous script . This indicator still works off of the same concept as before with effort vs results but this indicator takes a slightly different approach and instead defines results as the absolute difference between the closing price and a closing price x bars ago. As you can see in my chart example, this indicator works great to stay with the current trend and provides either a stop loss or take profit target depending on which direction you are going in. As always, I use darker colors to show stronger signals and lighter colors to show normal signals. Buy when the line turns green and sell when it turns red.
Let me know if there are any other indicator scripts you would like to see me publish!
Trendtrader

Trend Oscillatorwhat is "Trend Oscillator"?
it is an indicator for determining the trend.
what it does?
analyzes the price action by reducing it to 4 different situations. Red means strong bear, orange means bearish, yellow means weak bull and green means strong bull. It was developed to help traders who trade in the direction of the trend and its biggest promise is to simplify price action.
how it does it?
He defines 4 different situations as follows. If the velocity of the price is positive and the acceleration is positive, it is a strong bull, if the velocity is positive and the acceleration is negative, it is a weak bull, if the velocity is negative and the acceleration is positive, it is a weak bear, if both velocity and acceleration are negative, it is a strong bear.
2 for strong bull
1 for the weak bull
-1 for weak bear
Creates a function that takes values of -2 for the strong bear. this function is the velocity of the principal indicator, and then the integral of this function forms the principal indicator.
how to use it?
"source" is used to change the source of the indicator,
"length" makes the indicator give a later but less signal.
you can use it to follow or analyze the trend. colors make it easy to use. learns about current or past trends by looking at colors. Like any trend indicator, it can give unsuccessful signals in a horizontal trend.

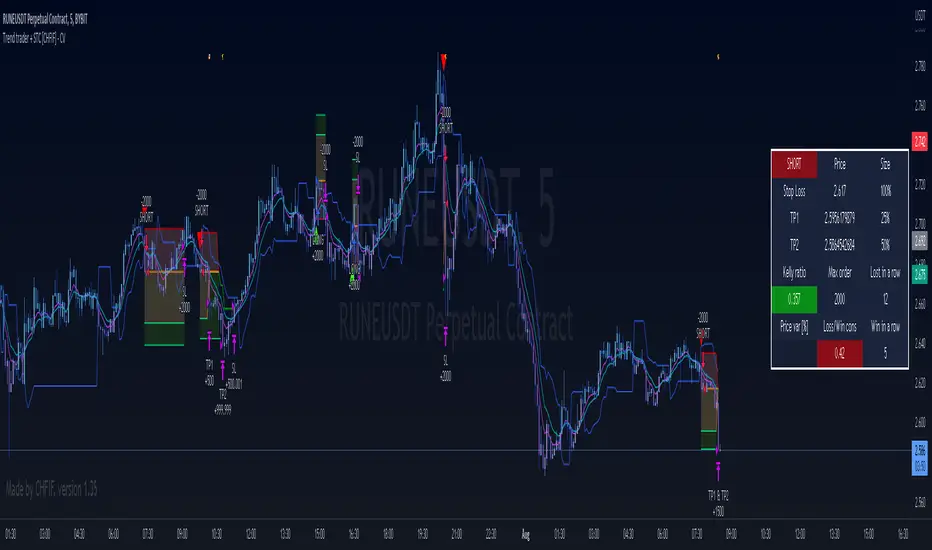
Trend trader + STC [CHFIF] - CV This script is my first strategy script coupling the Trend trader (indicator developed by Andrew Abraham in the Trading the Trend article of TASC September 1998.) and Schaff Trend Cycle . The STC indicator is widely used to identify trends and their directions. It is sometimes used by traders to predict trend reversals as well. Based on the movement of the Schaff Trend Cycle , buy or sell signals are generated, which are then used by traders to initiate either long or short positions.
Around I built a user interface to help you in creating a customized strategy to your need.
My idea behind doing this was to make customizable parameters and back testing easier than manually with a lot of flexibility and options. More possibility we have, more solutions we find right? So I started this script few weeks ago to be my first script (second in reality, but first to be published.)
Strategy it self is made out of 2 simple step:
1→ STC gives a Buy/Sell signal.
2→Price is closing above the TT (Buy) or below (Sell) and the signal is the same as given by the STC .
To complete your strategy in order to reach the best result, I added few options:
→ Money management: Define the type of risk you want to take (entry risk will always risk the same percentage of your portfolio disregarding the size of the SL, Fix amount of money, fix amount of the capital (portfolio). NOTE: Margin is not coded yet, target is to show liquidation price. Please keep an eye on the releases to know when it is released.
→ Stop loss and Take profit management: Define the type of target you want to use (ATR, fixed percentage, pivots points) and even customise different take profit level or activate the trailing. Each type of target is customizable via the menu
→ Moving average: You can also complete the strategy using different moving average. To draw it tick the box on the left, to use it in the calculation of the result, tick the box "Price>MA" in front of the needed EMA . You can select different type of MA ( SMA , EMA , DEMA , TEMA , RMA, HMA , WMA , VWAP , VWMA , etc...)
→ RSI: 4 possible approach to use the RSI to complement the strategy:
• OB/OS => short position will be taken only if RSI goes under the lower limit. Long if the RSI goes above the limit. Ticking confirmation will wait to cross back the limit to validate the condition
• Rev OB/OS => Short will be taken if RSI is below lower limit and stays below. Long will be taken if RSI is above upper limit and stays above.
• MA dominance => RSI has to be above MA for long, below for short. Confirmation box ticked requires 2 bars with the RSI on a side to validate signal.
• MA Dominance + limit => It is a combination of the requirement of the provious option and also Rev. OB/OS
→ Volume confirmation => This will consider the volume MA for entry confirmation. The volume will have to be above the MA define by the value entered in the field.
→ Waddah Attar explosion indicator can also be used as a filter for entries in this way:
• Explosion line > dead zone to validate entries
• Trend > dead zone to validate entry
• Both > dead zone is a compound of both rules above to get entry confirmation
→ ADX can also be used as a filter. I added 2 Threshold in order to have a minimum level of acceptance for valid entry but also a maximum level.
When your strategy is setup, you can setup alerts and I would recommend to setup the date range before doing the alerts. Why? Simply because the script do not cover pyramiding and will give a signal only if a trade is not ongoing.
In setting up the sessions at which you would want to trade, no signal within those range can be missed. You can setup 2 sessions, the days and also the global range of backtesting.
Buff Averages [CC]The Buff Averages were created by Buff Dormeier (Stocks and Commodities Feb 2001) and this is another hidden gem that is a combo of a volume weighted indicator and a moving average crossover system. It uses a special method to calculate the weighting based on volume. The colored line (fast buff) will follow the price closely and you use the other line to act as a trend confirmation. I have included strong buy and sell signals in addition to normal ones so strong signals are darker in color and normal signals are lighter in color. Buy when the line turns green and sell when it turns red.
Let me know if there are any other indicators or scripts you would like to see me publish!
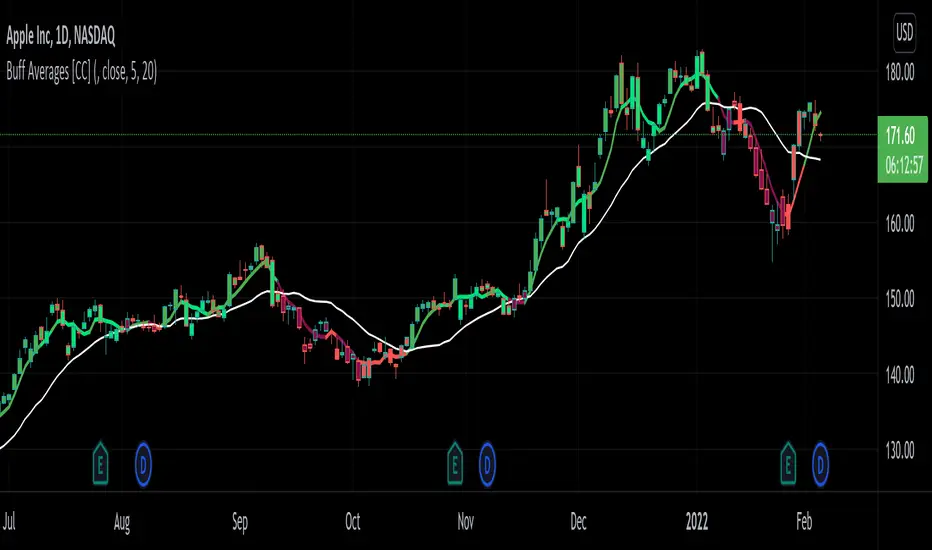
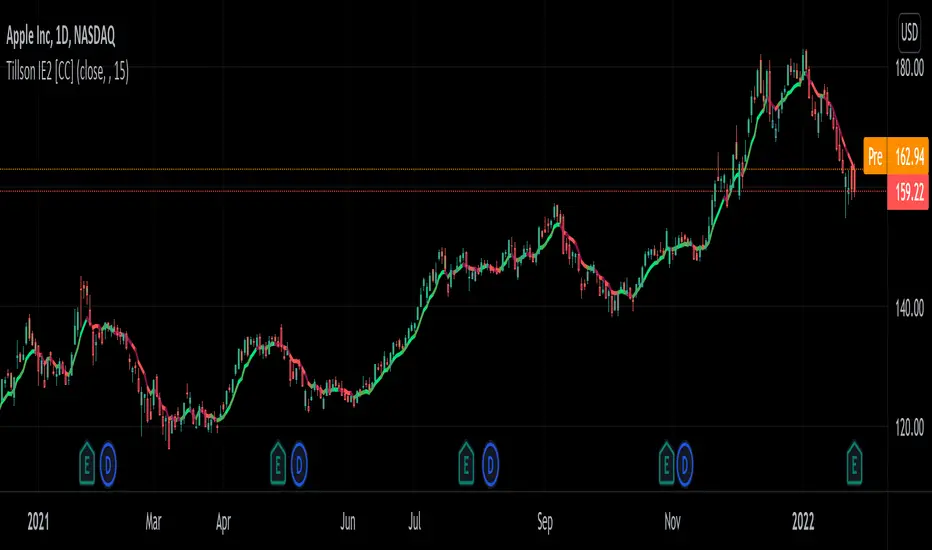
Tillson IE/2 [CC]The IE/2 was created by Tim Tillson (Stocks and Commodities Jan 1998) and this is a practically undiscovered gem because in that same article he goes on to to create the popular T3 moving average and the GDEma but practically no one seemed to notice the IE2 or maybe it is just my imagination. Anyway this indicator name is short for Integral of Linear Regression Slope + Endpoint Moving Average / 2 so you can why it was shortened to IE/2. Like the name implies this takes two variations of smoothing that complement each other and averages them together to in theory get the benefits of each. The EPMA is much noiser but follows the data more closely and the complete opposite for the ILRS so you can see the idea in action. Like all of my indicators I include strong buy and sell signals in addition to normal ones so strong signals are darker in color and normal signals are lighter in color. Buy when the line turns green and sell when it turns red.
Let me know if there are any other indicators or scripts you would like to see me publish!
Natural Stochastic Indicator [CC]The Natural Stochastic Indicator was created by Jim Sloman and this is another indicator from his Ocean series which I will eventually publish all of them. Big thanks to @altcoinz and @tmac87 for giving me all of the source code in order to publish Jim's life work. This is another momentum indicator but unlike a traditional stochastic indicator, this one doesn't use overbought and oversold levels. Instead it becomes a sell signal when the indicator starts getting lower and vice versa. This takes the classic approach to a stochastic and combines it with the time factor from Jim's Ocean Theory to create this new indicator. I have included strong buy and sell signals as darker colors and normal buy and sell signals as lighter colors. Buy when the line turns green and sell when it turns red.
Let me know if there are any other indicators you would like to see me publish!

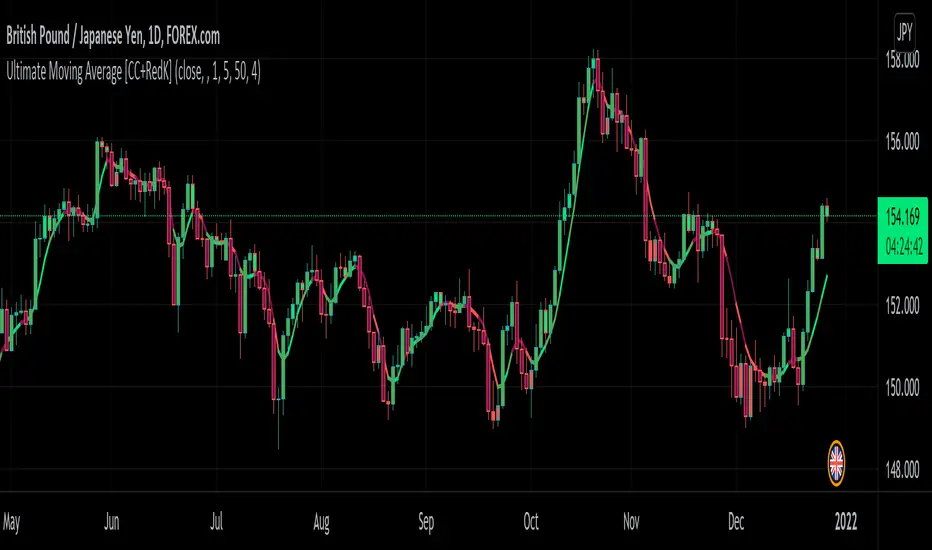
Ultimate Moving Average [CC+RedK]The Ultimate Moving Average was created by myself and @RedKTrader and I can proudly say that this is the holy grail of moving averages. Not only does this moving average react to the current price trends like a normal moving average but we have also included the ability to react to volume, momentum, and volatility. The only thing this moving average can't do is wash your car.
The Ultimate Moving Average doesn't even use a set length so it is fully adaptable to any type of market whether it is choppy or trending. It tightens during volatile markets and loosens during choppy markets. I have included 3 of the main moving averages of a fixed length of 20 days to show you just how much better our moving average is.
The overall concept of this moving average was to fully adapt to any and all changes of the underlying stock. We used my Variable Power Weighted Moving Average as a base and changed the script to adapt to momentum instead. The idea behind this was when momentum reaches an extreme in either direction we tighten the moving average to be able to react accordingly. We then used the idea behind my Variable Length Moving Average to be able to react to volatility and make the length itself into a separate variable.
All of this work combined to create the most reactive moving average out there and I guarantee you will be using this in your daily trading! Let me know if there are any other scripts you would like to see me publish.
Average Band by HarmanUsually, Moving Averages (Simple & Exponential) consider "close" of each candle to form a line for a particular period. In this indicator, we have considered all the parameters (Open, Close, Low & High) of each candle to form a Band or a wave which act as a zone to provide support & resistance. It works well on all the time frames. It perfectly works on lower time frames of 15 min & 5 min for intraday trades and even for scalping. There is a line that moves very near to candles known as "Candle Line" provide support & resistance to each individual candle and a leading line which moves ahead also acts as support & resistance and helps in determining trend direction.
How to use the indicator ?
Indicator consists of 3 components :
1) A Band or wave of 3 lines (upper, middle & lower line)
2) A "Candle Line" which moves along with the candles
3) A Leading line which moves ahead of the candles
Method 1 : When candles are being formed above the candle line (line near to candles) and it crosses the band or wave from below to upside, then long trade can be initiated. Similarly, When candles are being formed below the Candle line and it crosses the band or wave from upside then short trade can be initiated. Stop loss can be maintained below the band for Long trade and above the band for short trade. Candle line can be used to trail the stop loss.
Method 2: If candles moves above and below of the band very often and frequently and candle line is in the middle of candles then it is NO TRADING ZONE. If you still want to trade, then select a higher time frame and check the price movement. If there is a stability in the higher time frame, then take the trade in the higher timeframe with stable movement.
Method 3 : Candle line acts as "First line of Defence". In a uptrend, all the candles are formed above the candle line and in case of down trend, all the candles are formed below the candle line. When a newly formed candle cross the candle line then you can book profit. For Example : In uptrend , candles are being formed above the line, when a new candle started forming below the line and when the complete candle is formed below the line, profit can be booked. Vice-versa in case of downtrend.
Method 4: Direction of leading line, band and candle line helps in determining the trend. If all these three components are in upward direction, price trend is upward and if all these three components are in downward direction, then price trend is downward. When, leading line and band cross each other from opposite direction for consecutive 2-3 times, then price movement is sideways.
Method 5 : Thickness of band play an important role in determining price action. If band is narrow, it means small candles are being formed and no any huge price movement is observed in this period. When band started expanding, it signifies that big candles are begin to form and there is a more price movement than before. Similarly, If contraction of band started, it means that small candles are being formed and there is low price movement as compared to the price movement when Band was expanded. If Band is expanded (wider) and volumes are high, It means the Band will act as strong Support or Resistance than usual. In case, candles and candle line cross the expanded Band, you can enter the Long or Short trade.
Method 6: When the Band, leading line and candle line collides or meet at a single point, then it is either strong support or resistance.
Method 7 : Usage in Scalping : Select the shorter time frame of 1 min or 5 min. If the candles are crossing the band very frequently in 1 min, then select 5 min time frame or wait for few minutes for stability. Now, when candles started forming above the candle line and it crosses the band from below then take a long position and book profit after few candles above the band. Place stop loss below the Band. Similarly, when candles started forming below the candle line and it crosses the band from above, then enter into short trade and book profit after few candles. Place stop loss above the band in the case of short trade.
You can combine above methods to give a sharp edge to your trade and increase the probability of your winning in the trade.
Indicator Settings : Default period selected is 50 for both the Band and leading line. You can change the period to 26 or 100 or 200. Select the period and check the chart, if the indicator looks fine and smooth, then you can use your settings. For most of the time, default settings work perfectly.
Proudly Developed by :
Harmandeep Singh
Graduate in Computer Science with Physics & Mathematics
MBA in Business Marketing and Finance
Experienced Computer programmer & Software developer
Stock Market & Crypto Trader

RP trend readerThis tool is a momentum reader
You can use this tools at any timeframe
When the momentum is meet the condition then it will show the signal
The signal are "Buy" and "Sell"
Buy means that you Long or exit your Short at the price
Sell means that you Short or exit your Long at the price
There's pivot line at there
Pivot line is showing how strong the momentum right now
If the price above or way above the pivot line then the uptrend is strong (very bullish)
If the price below or way below the pivot line then the downtrend is strong (very bearish)
Don't blindly Buy or Sell just because the signal is coming out
Combine it with the market structure, look at the big picture instead lower TF and the edge is yours
The best entry is when the price bounce close to the pivot point
Be carefull with the sideway or choppy market. You can see that the price is going up and down at the pivot line and the signals come out quite often
Follow your trading plan, be patience (don't FOMO) and be discipline with your plan... Cheers...
Gann HiLo Activator [CC]The HiLo Activator was created by W.D. Gann and I was surprised to not see more of his technical indicators on here. I will start adding more of his indicators on here if I get more interest. This is the original version of the indicator that performs like a trailing stop that also works well as a trend line. Buy when the line turns green and sell when it turns red.
Let me know if there are any other indicators you want me to publish!

Fishing with SignalsFishing with Signals
HOW DOES IT WORK?
Fishing with Signals comprises of 3 indicators
1) Buy / Sell Signals
2) Band for Trend Recognition
3) ADX-DI Trend Identifier
Indicator 1 == Buy / Sell Signals
The signals are based on moving average exponential rectified by the previous high and low break at any real-time, it recognises the previous specified moving average deviation. If the predefined high and lows are broken along with current candle is closed below the specific moving average then sell is given and vice-versa for buy. The settings are not editable.
Indicator 2 == Band for Trend Recognition
The band comprises of 200 moving average with exponentially smoothening feature, there are three lines one can identify the trend if candles are below or above the band
Indicator 3 == ADX-DI Trend Identifier
The indicator gives a multiplication of ADX and the DI+ and DI-values, colour coded for bullish or bearish momentum and shows general market direction and divergence in a simpler visual way than the normal ADX-DI lines, a threshold value cannot be edited. The indicator is plotted relative to the 200 ema and can be seen as a "buffer" against price reversal. The ADX is used to indicate market direction, the existence or nonexistence of a trend and market momentum. Market direction is determined by the levels of the +DI and -DI. The ADX indicator, which varies in value from zero to 100, is the primary momentum indicator, default value is kept at +40 and -40. If the ADX is lowering or rising the DI line plotted will be moving as directed with change in colour and background filling. The Line hovering below and above the "buffer" is changing the colour with rising as navy and falling as maroon with intermittent colour of red and lime which also shows reversal.
HOW TO use the indicator?
For SHORT ==If the candles are below the Band for Trend Recognition and ADX-DI Trend Identifier is lowering and if the SELL SIGNAL comes one can go short with stop-loss be the close above top band and with momentum be positive.
For LONG == If the candles are above the Band for Trend Recognition and ADX-DI Trend Identifier is growing and if the BUY SIGNAL comes one can go Long with stop-loss be the close below lower band and with momentum be negative.
CAUTION!! : There will be false buy / sell signals also, where user have to verify with the other two indicators, for confirmation.
TARGET in any call = If the trend is up and buy signal comes then target may be trailed till next signal or close below band and vice versa for sell side.
USER OPTIONS : Choice of turning on / off the three indicators.
VISUAL CHECKS - The user could manually validate the back test results on various assets they would like to use this strategy on before putting it live.
USAGE MARKETS : Index Trading / Equities and also well with Commodities and Currencies.
TIME FRAME : Timeframe maybe any and as the user likes, still it works well with 5 min for less signals.
SETTING THE ALERTS : - Buy and Sell Signal alerts are advisable.
HOW TO GET ACCESS
Please click on the link / email available in the signature or send me a private message to get access.
FEEDBACK
Please click on the link/email in the signature or send me a private message for suggestions/feedbacks.
DISCLAIMER.
I AM NOT A FINANCIAL ADVISOR. THESE IDEAS ARE NOT ADVICE AND ARE FOR EDUCATION PURPOSES ONLY. ALWAYS DO YOUR OWN RESEARCH!
Utmost Care is taken to implement the suggestions of users and also tried to keep the chart neat and clean.
Greetings!!
Drop a mail to edgineer@yahoo.com or Drop a personal message for access.
Questions, Help, Discussion -> Telegram: Telegram: @miteysh

TREND +SIDEWAYS OPTIMIZED algo signalsThis indicator will try to capture maximum trend of a stock
it will keep trailing stoploss to capture maximum trend
Works best in trendy markets
FEATURES:
Done and backtested on indian stocks.
Trade session and exit session can be specified as inputs.
Optional Stoploss
Specially developed for intraday trading
It would be good to use on normal candlesticks and time frame between (3 to 15 min)
INPUTS:
TRADE FREQUENCY: it can be an integer from from 1 to 5 , Frequency denotes the trading frequency,
low frequency will take less number of trades and will have HIGHER risk rewads (to use lowest frequency 1 )
High freqency it will take more trades and with less profits good for scalpers , it will have low risk and low reward)
Frequency requirement can be given between 1 to 5 , 1 is the lowest and 5 is the Highest frequency
Sideways Bias:
This is an extra filter to reduce the loss in sideways movement,
Your sideways bias can be given between 0 to 3
0 if No bias on sideways
3 if biased on sideways
Reduce the risk filter:
This would try to bok profit quickly and begginers can use this
Optional stoploss:
you can define your risk in points
Trade Quantity:This is quantity you want to trade on particular day, it is used to plot buy or sell quantity on chart (quantity is not taken into consideration in backtest)
Trade session: Session for entries can be specified
Exit session: session for exit can be specified
Custom Bactesting:
This is to provide backtesting results of a stock in given range of dates

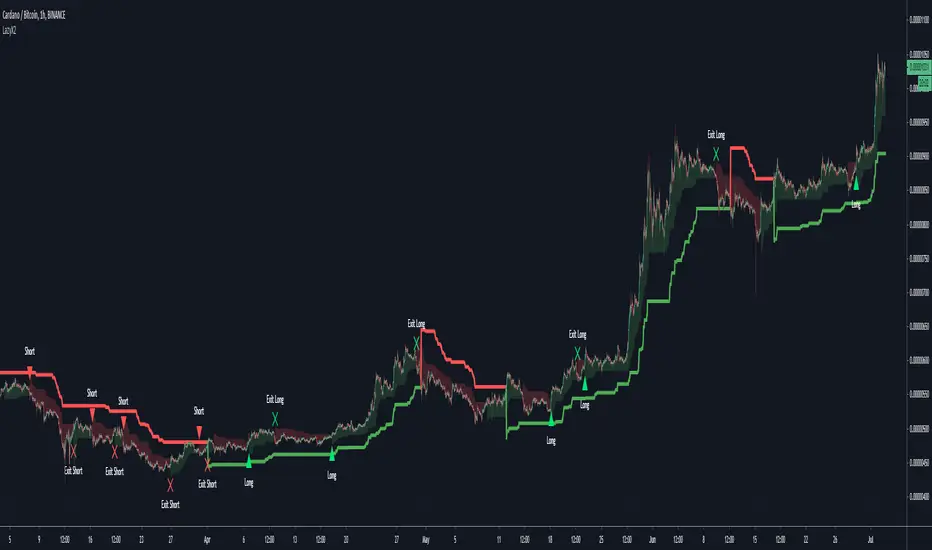
LazyX2We released LazyTrader all the way back in Aug of 2018, and it's still popular to this day among members, especially for those setting up trend trading bots.
LazyX2 uses the same algorithm, but has evolved into an alternative version with a second copy built in so that one is used as the long term trend and the other as the short term trend.
There are a couple of entry strategies to choose from, but over all LazyX2 allows you to fine tune even further than the original and reduce your strategies drawdown.
A couple of us have been testing this for a little while now so I'm happy to be able to finally release it to the world!
As always, for information on how to gain access please check the links below or on our profile page.
Viral Trend TraderSimple indicator.
Chose ADX Length and Timeframe and it will show translucent black candles for downtrends and white candles for uptrends.
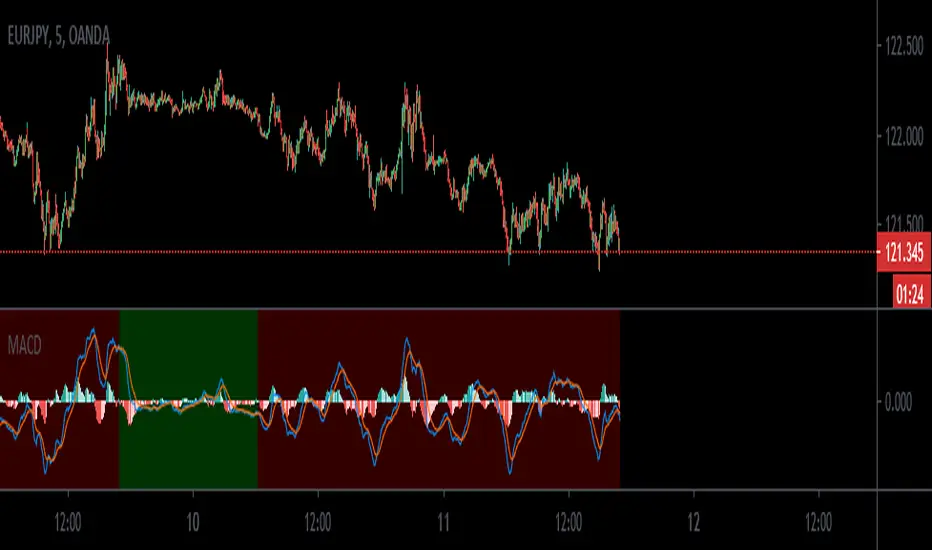
MACD_trendtraderThis is my modified macd indicator. It uses moving averages to determine the trend of the market. It is best used on lower time frames such as 5min and 15min. I found it useful especially with Forex pairs and also traditional markets.
This indicator will help you get in at a pullback in a trending market.
RED background tells you the trend is down. A possible entry happens when you get a sell signal from the macd oscillator above the 0 line.
GREEN background tells you the trend is up. A possible entry happens when you get a buy signal from the macd oscillator below the 0 line.
a couple of examples:
Leave your feedback in the comments. Enjoy:)
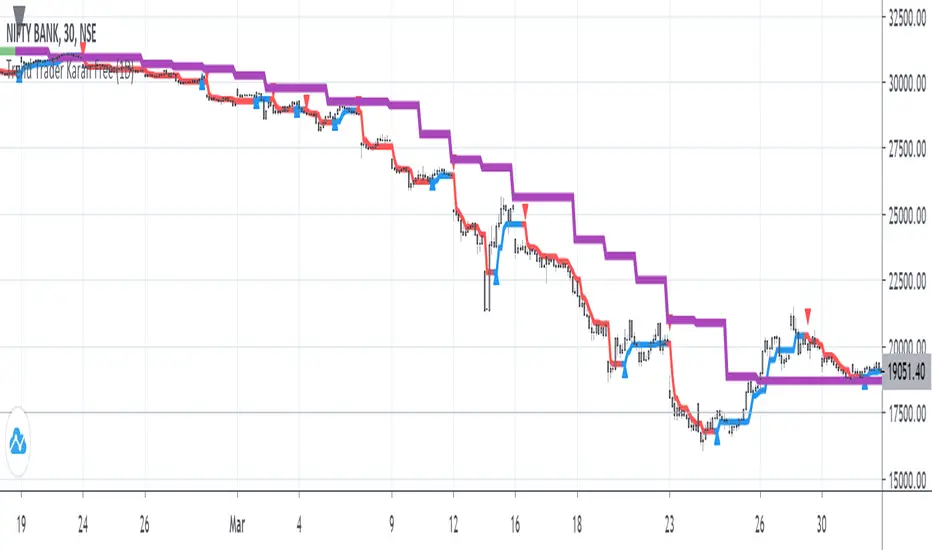
Trend Trader Karan TTK FreeNow, I have derived this code from Half Trend, after @jyotiprasad mentioned about it. And it was not difficult to convert to look like and work like Trend Trader Karan's Tool, who invested " Lakho Rupaya" and works on the basis of price action trading also.
Let me tell you guys, this is nothing but an ATR based system which people already traded as Half Trend, Super Trend and various names. Half Trend is no more a copyrighted indicator, which stopped marketing after being exposed, but people are still cheating with such indicators.
This Indicator will exactly do same way as the TTK indicator, even both of them overlaps including signals .
You can change colors to make matching/ look like even more similar.
I made a few modifications:
You can now add this to even 1 min chart keeping main trend 1 day or whatever, No more errors
Non repainting, but wait till closure of current candle to confirm the signal
Beware of morphed videos showing profits.
Please spread the word, comment and help others not to fall for such things. Remember, this indicator is just a common trend following indicator and accuracy is good only when mixed with price action etc.
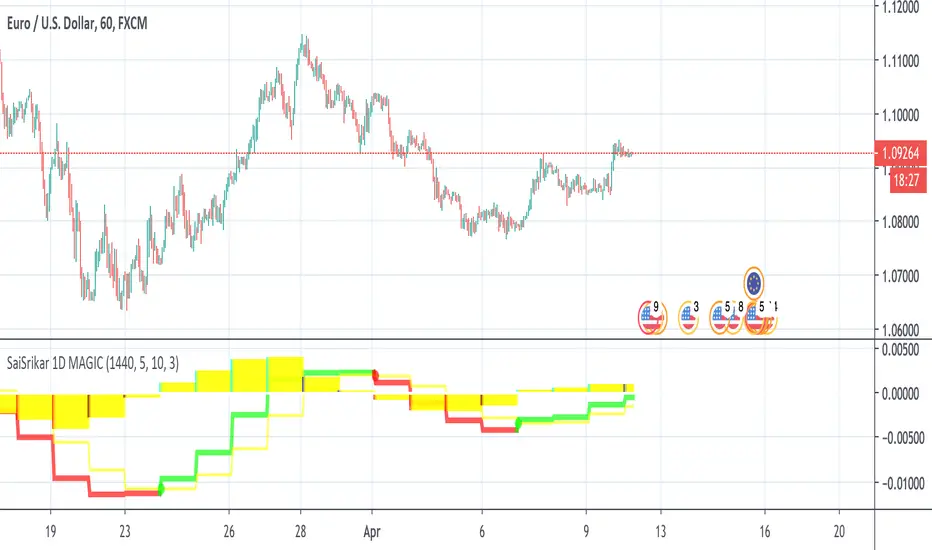
SaiSrikar 1D MAGICThis is an indicator derived from MACD indicator.
This indicator can be used for identifying trend and take positional trades everyday during asian session.
The signal will come once in 3 days at the time of releasing the script. Changes will be made to improve the script.
Recommened:
Apply indicator on 1 day TF and on Asian Market opening , depending on the signal, Green means buy or Red means Sell.
Take this signal as soon as asian market opens.
To get in a trend ASAP:
You can follow the trend very well if you apply to 15 Min TF. You can quickly get into a trend using the signals. Beware of fakeouts in the market
Trend GridTrend Grid is a responsive method to identify price movement and momentum. Mainly used to follow the trends.
This is for Level 3 members only.

Filthy REPAINTING of McNasty Profits*** THIS SCRIPT REPAINTS ***
Looking at the history will go you NO IDEA as to actual performance, or alerts that triggered within each bar. I made all of the alerts repaint in order to allow an alert each minute a condition is met, and never again after.
For instance; receive an alert each time the price is within a particular plotted area on the chart (as defined by settings). This could not be accomplished without repainting.
In order to receive a notification of the price crossing a particular line, YOU NEED TO SET ALERTS TO "ONCE PER MINUTE."
This way, if you use an alert to enter a position and then get stopped out, you can re-enter on the next alert if the price moves in the original direction again within the same bar.
Also, I made this script so that each entry has an available Stop Loss alert that will get you out of a position going in the wrong direction (and option to enter in opposite direction). You set the parameters within the settings.
Although each position has a tight Stop Loss available via Alert, I also recommend using a similar tight Stop Loss directly on your exchange in case an error occurs anywhere within the chain.
This script HAS A LOT OF OPTIONS for how you can use it, from very conservative to extremely aggressive. There are NINE customizable alerts for the user to decide how/when to use, or ignore entirely.
When the Alerts are set to "ONCE PER MINUTE" you will get an alert each time the price crosses the corresponding area on the chart, but the characters only remain on the charts history if the alert was still firing (Once Per Minute) when the bar closed. This is why the Alerts on the chart's history are completely irrelevant.
As you can imagine, this is a LOT OF ALERTS. Consequently, this is meant for use with "bot trading" using the Alerts to automatically Open and Close positions.
I am using it with 3Commas to make trades on Bybit.
At the time of publishing, this is "Invite Only." I need to test it out over a range of time, conditions, chart time frames, pairs, etc... before opening it to the public.

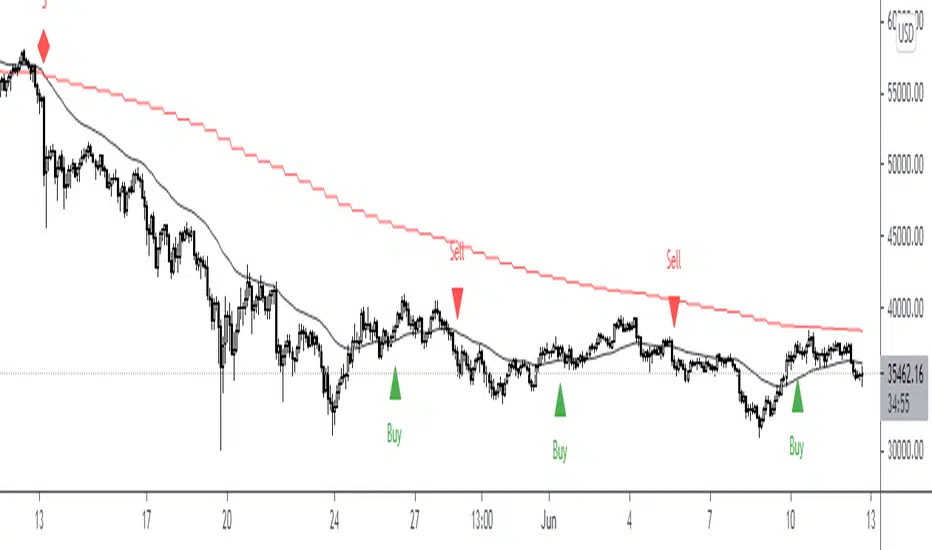
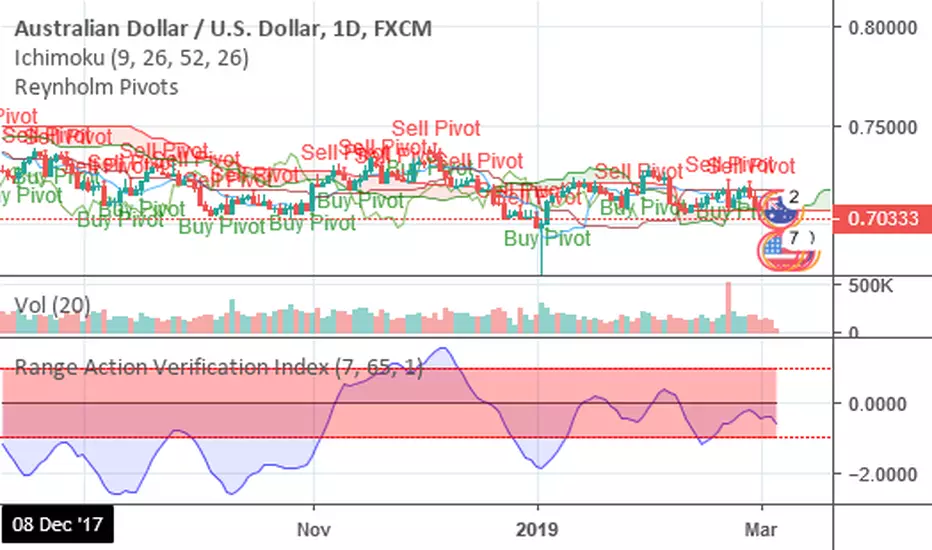
Range Action Verification IndexThe Range Action Verification Index or RAVI as it is commonly known is a trend detection indicator.
When RAVI is greater than 1% for longs and -1% for shorts (FX setting), the currency is in a trend.
The standard MA settings are 7 and 65 days for use on the daily chart, which are the cycles of 7 days and 3 months.
For trading the hourly charts the moving averages should be set to 24 and 120 with a threshold of 3%.
RAVI also keeps you out of a trend less market, so if the RAVI does not break above or below the set threshold,
the market is trend less.
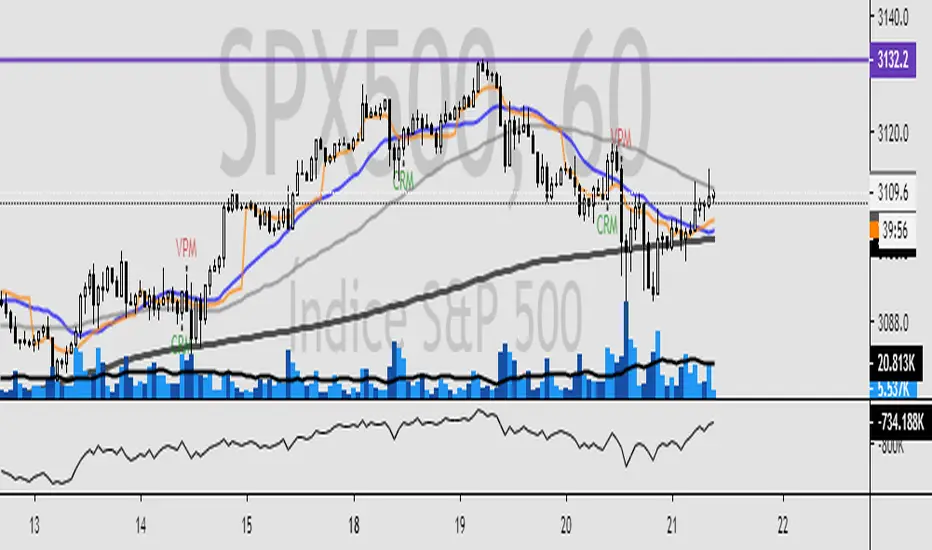
Trading Trend IndicatorEsse indicador plota na tela do ativo avaliado, pontos de compra e venda baseado em regras de tendência e confirmação por volume. Caso o ativo entre em tendência, o script plota na tela os dizeres "CPM" = Comprar na perda da máxima, ou seja comprar assim que o preço perder a máxima no próximo candle, e "VPM" = Vender na perda da mínima, assim que o preço perder a mínima no próximo candle. O indicador também avalia o volume, se o volume for 3x superior a média de 21 períodos, plota-se na tela "Vol. 3x" e se a barra de volume for 3x maior que a barra anterior, plota-se "3x" sobre o gráfico de volume.
Caso tenham interesse, solicitem o teste gratuito de 7 dias.
Description in english
This indicator plots on the screen of the evaluated asset, points of purchase and sale based on trend rules and confirmation by volume. If the asset is in trend, the script will display the words "CPM" = Buy at the loss of the maximum, ie to buy as soon as the price loses the maximum in the next candle, and "VPM" = Sell at the minimum loss, so that the price to lose the minimum in the next candle. The indicator also evaluates the volume, if the volume is 3x higher than the average of 21 periods, it is plotted in the "Vol 3x" screen and if the volume bar is 3x larger than the previous bar, it is plotted "3x" on the volume chart.
If you are interested, request a free 7-day trial.