Moonbot - Cryptocurrency Trading StrategyThis is a greatly improved upon version of my cryptoTurtle. Enough has changed I didn't think it was appropriate to just update cryptoTurtle. I will possibly be selling this bot on bitcointalk in the future, stay tuned!
Setup:
Buy: Above green line and green up arrow.
Sell: Sell when above top red line or bottom red line. Also sell if arrow turns down and red.
Trend

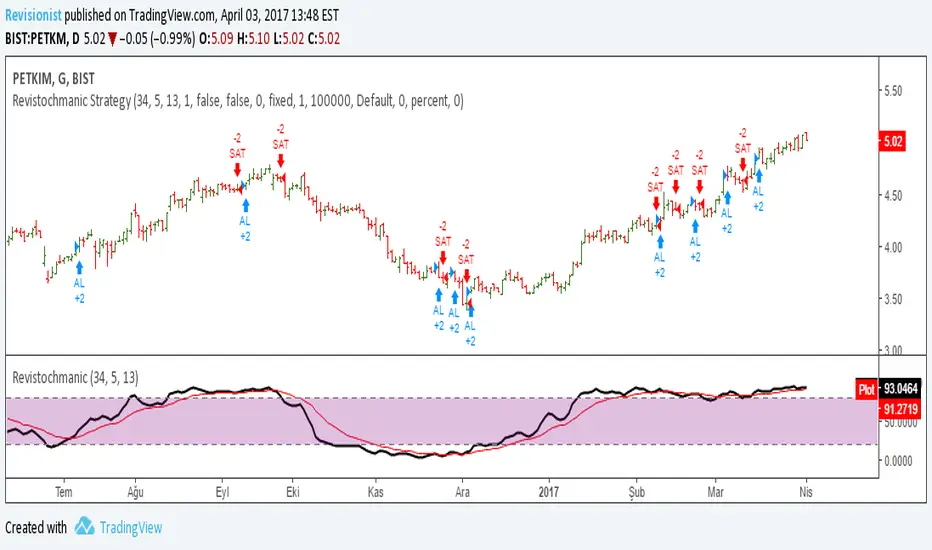
Revistochmanic StrategyRevistochmanic Wave is a stock tracking trends indicator & strategy for medium & long term investing.
15 Minute Gold Trend-Following StrategyThis is the main strategy that I will be forward testing on demo for a month or two, then making it an EA in MetaTrader4
You can see the code for yourself this time, all the strategy is, is a crossover of various moving averages.
Commission included, $10,000 account.
Results over the past 3 months, beginning in January 2017.

GMAE Original (By Kevin Manrrique)This script is called GMAE Original by me (Kevin Manrrique). I'm publishing this to the public because we are all traders and we need to support each other as a TVcommunity. This is something I built for fun. This script uses a series of EMA's. NO REPAINT, NO LAGGING! It works better for short-term trends as you can see. Please leave the copyright on the script at all times even if you rebuild it. If you need any help or have questions please inbox me privately. If you interested in joining up and building an indicator or strategy please inbox me as well. Thank you and I hope you enjoy this script as much as I do.
Remember there are no holy grails. The only holy grail there is are indicators built together to stop faulty signals and be as accurate as possible and this is one of them.
Sincerely,
Kevin Manrrique

Updated Gold Strategy - Trend Following Script v4.0This strategy improves on the latest one that I posted in several ways.
the %profit is reduced by 3%
Success rate reduced by 2%
Drawdown decreased by half (from 40% to 20%)
Average trade $ increased by $500

B3 Edge Trail-TraderAnswer to the locked strategy... Formerly "High-Low Trader" .. Changed the name to Edge Trail Trader to delineate from the locked version, which is no different. You can add this one to your favorites now.
Similar to SuperTrend or the ATR trailing stop lines that are common-place in chart indicator circles, the B3 High-Low Trail-Trader works as a back-break line to flip binary long and short biasing. Here is the strategy set to 7 bars back. You can find this style of trading system in several books, and there are many ways to come to the trailing stop line, so I imagine the bars back length can be slid around to suit certain charts. This happens to be my favorite trailing line.

K.M Trend Strategy (BETA 1.2)My beautiful traders, how is everyone doing? This indicator I built detects trends, I haven't seen any repaints, I only had 3 minor ones. It is still on BETA version.
To all new traders, and busy traders I will be posting one that you can set alerts. Please look under my profile or type " K.M Trend Alerts (BETA 1.2) " .
I ask for everyone to try this script out, please provide any feedback under in the comments below. Any feedback will be amazing! Thank you to everyone, and www.tradingview.com.
Sincerely,
Kevin Manrrique
Follow us on Instagram: TWTForexGroup, we have amazing content and also sell signals!

[STRATEGY][RS]MicuRobert EMA cross V2Great thanks Ricardo , watch this man . Start at 2014 December with 1000 euro.
