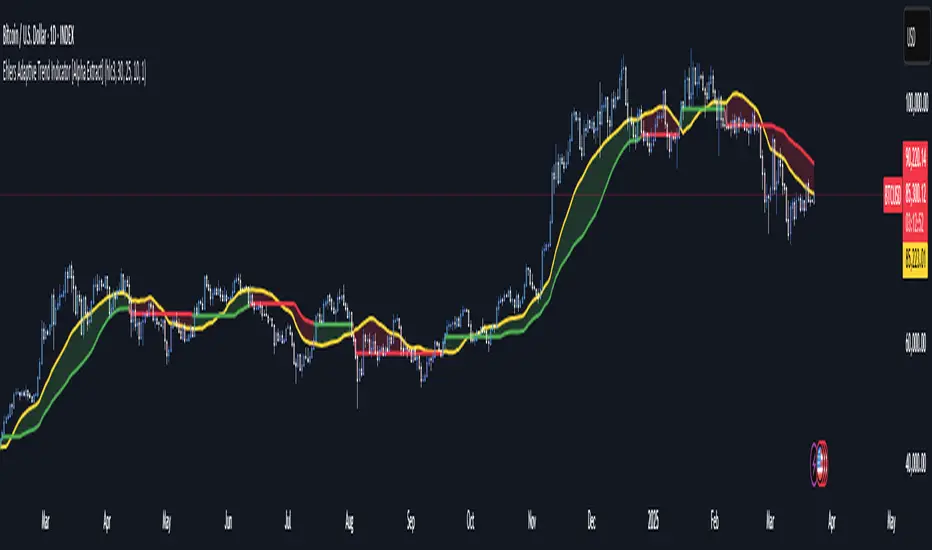
Ehlers Adaptive Trend Indicator [Alpha Extract]Ehlers Adaptive Trend Indicator
The Ehlers Adaptive Trend Indicator combines Ehlers' advanced digital signal processing techniques with dynamic volatility bands to identify robust trend conditions and potential reversals. This powerful tool helps traders visualize trend strength, adaptive support/resistance levels, and momentum shifts across various market conditions.
🔶 CALCULATION
The indicator employs a sophisticated adaptive algorithm that responds to changing market conditions:
• Ehlers Filter : Calculates a weighted average based on momentum differences to create an adaptive trend baseline.
• Dynamic Bands : Volatility-adjusted bands that expand and contract based on recent price action.
• Trend Level : A dynamic support/resistance level that adapts to the current trend direction.
• Smoothed Volatility : Market volatility measured and smoothed to provide reliable band width.
Formula:
• Ehlers Basis = Weighted average of price, with weights determined by momentum differences
• Volatility = Standard deviation of price over Ehlers Length period
• Smoothed Volatility = EMA of volatility over Smoothing Length
• Upper Band = Ehlers Basis + Smoothed Volatility × Sensitivity
• Lower Band = Ehlers Basis - Smoothed Volatility × Sensitivity
• Trend Level = Adaptive support in uptrends, resistance in downtrends
🔶 DETAILS
Visual Features :
• Ehlers Basis Line (Yellow): The core adaptive trend reference that serves as the primary trend indicator.
• Trend Level Line (Dynamic Color): Changes between green (bullish) and red (bearish) based on the current trend state.
• Fill Areas : Transparent green fill during bullish trends and transparent red fill during bearish trends for clear visual identification.
• Bar Coloring : Optional price bar coloring that reflects the current trend direction for enhanced visualization.
Interpretation :
• **Bullish Signal**: Price crosses above the upper band, triggering a trend change with the Trend Level becoming dynamic support.
• **Bearish Signal**: Price drops below the lower band, confirming a trend change with the Trend Level becoming dynamic resistance.
• **Trend Continuation**: Trend Level rises in bullish markets and falls in bearish markets, providing adaptive trailing support/resistance.
🔶 EXAMPLES
The chart demonstrates:
• Bullish Trend Identification : When price breaks above the upper band, the indicator shifts to bullish mode with green trend level and fill.
• Bearish Trend Identification : When price falls below the lower band, the indicator shifts to bearish mode with red trend level and fill.
• Trend Persistence : Trend Level adapts to market movement, rising during uptrends to provide dynamic support and falling during downtrends to act as resistance.
Example Snapshots :
• During a strong uptrend, the Trend Level continuously adjusts upward, keeping traders in the trend while filtering out minor retracements.
• During trend reversals, clear color changes and Trend Level shifts provide early warning of potential direction changes.
🔶 SETTINGS
Customization Options :
• Ehlers Length (p1) (Default: 30): Controls the primary adaptive calculation period, balancing responsiveness with stability.
• Momentum Length (p2) (Default: 25): Determines the lag for momentum calculations used in the adaptive weighting.
• Smoothing Length (Default: 10): Adjusts the volatility smoothing period—higher values provide more stable bands.
• Sensitivity (Default: 1.0): Multiplier for band width—higher values increase distance between bands, lower values tighten them.
• Visual Settings : Customizable colors for bullish and bearish trends, basis line, and optional bar coloring.
The Ehlers Adaptive Trend Indicator combines John Ehlers' digital signal processing expertise with modern volatility analysis to create a robust trend-following system that adapts to changing market conditions, helping traders stay on the right side of the market.
Trailingstop
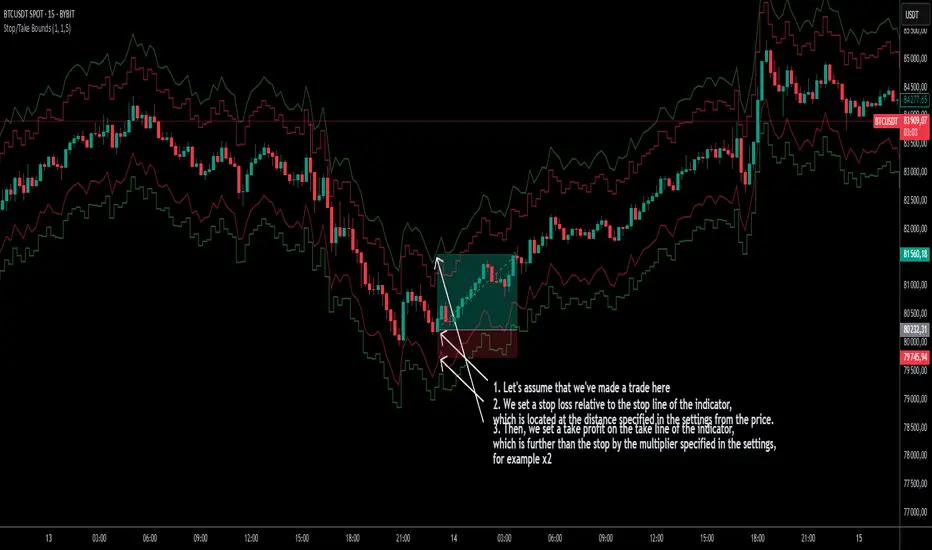
Stop/Take BoundsThe Stop/Take Bounds indicator is tool for setting dynamic stop-loss and take-profit levels based on percentage distance from the price. Unlike traditional ATR-based methods, this indicator allows traders to set stop levels as a fixed percentage of the price and define the take-profit multiple.
- Stop-loss distanceis determined as a percentage of the current price (e.g., 1% means the stop-loss is always 1% away from the price).
- Take-profit distance is calculated by multiplying the stop-loss distance by a user-defined multiplier (e.g., a multiplier of 2 places the take-profit level twice as far as the stop-loss).
- The indicator plots red lines for stop-loss levels and green lines for take-profit levels, making it easy to visualize risk-to-reward scenarios.
How to Use
1. Set Stop-Loss Distance (%) – Define how far the stop-loss should be from the price.
2. Set Take-Profit Multiplier – Choose how many times larger the take-profit should be compared to the stop-loss.
3. Apply to Long and Short Trades – The indicator automatically plots levels for both long and short positions.
4. Use in Manual or Algorithmic Trading – Ideal for discretionary traders as well as for integration into algorithmic strategies.
Use Cases
- Risk Management – Helps maintain disciplined risk-to-reward ratios.
- Strategy Development – Can be used in the creation of algorithmic trading systems.
- Trailing Stop Simulation – Can act as a trailing stop mechanism when used dynamically.
This indicator is a great addition to any trading strategy!
Adaptive RSI with Real-Time Divergence [AIBitcoinTrend]👽 Adaptive RSI Trailing Stop (AIBitcoinTrend)
The Adaptive RSI Trailing Stop is an indicator that integrates Gaussian-weighted RSI calculations with real-time divergence detection and a dynamic ATR-based trailing stop. This advanced approach allows traders to monitor momentum shifts, identify divergences early, and manage risk with adaptive trailing stop levels that adjust to price action.
👽 What Makes the Adaptive RSI with Signals and Trailing Stop Unique?
Unlike traditional RSI indicators, this version applies a Gaussian-weighted smoothing algorithm, making it more responsive to price action while reducing noise. Additionally, the trailing stop feature dynamically adjusts based on volatility and trend conditions, allowing traders to:
Detects real-time divergences (bullish/bearish) with a smart pivot-based system.
Filter noise with Gaussian weighting, ensuring smoother RSI transitions.
Utilize crossover-based trailing stop activation, for systematic trade management.
👽 The Math Behind the Indicator
👾 Gaussian Weighted RSI Calculation
Traditional RSI calculations rely on simple averages of gains and losses. Instead, this indicator weights recent price changes using a Gaussian distribution, prioritizing more relevant data points while maintaining smooth transitions.
Key Features:
Exponential decay ensures recent price changes are weighted more heavily.
Reduces short-term noise while maintaining responsiveness.
👾 Real-Time Divergence Detection
The indicator detects bullish and bearish divergences using pivot points on RSI compared to price action.
👾 Dynamic ATR-Based Trailing Stop
Bullish Trailing Stop: Activates when RSI crosses above 20 and dynamically adjusts based on low - ATR multiplier.
Bearish Trailing Stop: Activates when RSI crosses below 80 and adjusts based on high + ATR multiplier
This allows traders to:
Lock in profits systematically by adjusting stop-losses dynamically.
Stay in trades longer while maintaining adaptive risk management.
👽 How It Adapts to Market Movements
✔️ Gaussian Filtering ensures smooth RSI transitions while preventing excessive lag.
✔️ Real-Time Divergence Alerts provide early trade signals based on price-RSI discrepancies.
✔️ ATR Trailing Stop dynamically expands or contracts based on market volatility.
✔️ Crossover-Based Activation enables the stop-loss system only when RSI confirms a momentum shift.
👽 How Traders Can Use This Indicator
👾 Divergence Trading
Traders can use real-time divergence detection to anticipate reversals before they happen.
Bullish Divergence Setup:
Look for RSI making a higher low, while price makes a lower low.
Enter long when RSI confirms upward momentum.
Bearish Divergence Setup:
Look for RSI making a lower high, while price makes a higher high.
Enter short when RSI confirms downward momentum.
👾 Trailing Stop Signals
Bullish Signal and Trailing Stop Activation:
When RSI crosses above 20, a trailing stop is placed using low - ATR multiplier.
If price crosses below the stop, it exits the trade and removes the stop.
Bearish Signal and Trailing Stop Activation:
When RSI crosses below 80, a trailing stop is placed using high + ATR multiplier.
If price crosses above the stop, it exits the trade and removes the stop.
This makes trend-following strategies more efficient, while ensuring proper risk management.
👽 Why It’s Useful for Traders
✔️ Dynamic and Adaptive: Adjusts to changing market conditions automatically.
✔️ Noise Reduction: Gaussian-weighted RSI reduces short-term price distortions.
✔️ Comprehensive Strategy Tool: Combines momentum detection, divergence analysis, and automated risk management into a single indicator.
✔️ Works Across Markets & Timeframes: Suitable for stocks, forex, crypto, and futures trading.
👽 Indicator Settings
RSI Length: Defines the lookback period for RSI smoothing.
Gaussian Sigma: Controls how much weight is given to recent data points.
Enable Signal Line: Option to display an RSI-based moving average.
Divergence Lookback: Configures how far back pivot points are detected.
Crossover/crossunder values for signals: Set the crossover/crossunder values that triggers signals.
ATR Multiplier: Adjusts trailing stop sensitivity to market volatility.
Disclaimer: This indicator is designed for educational purposes and does not constitute financial advice. Please consult a qualified financial advisor before making investment decisions.

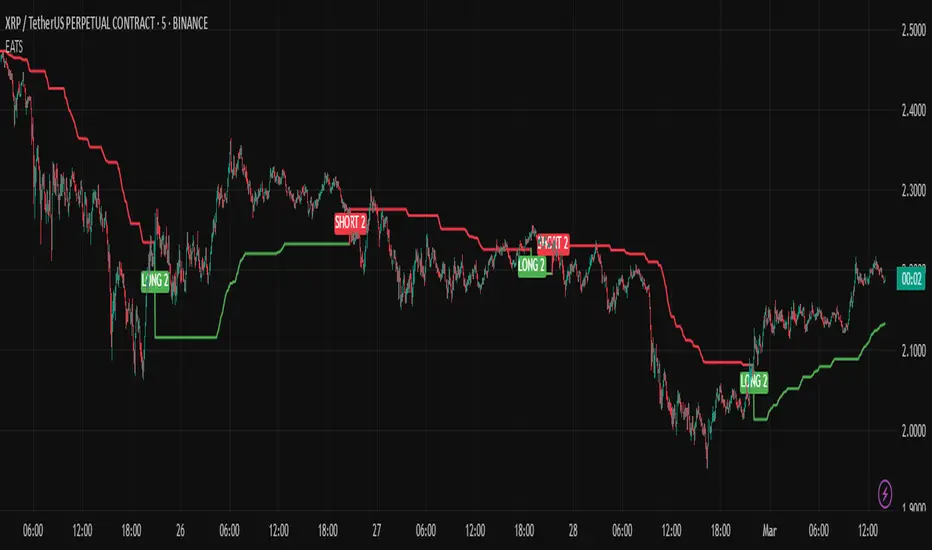
EMA Adaptive Trailing StopThe EMA Adaptive Trailing Stop Strategy is a versatile and comprehensive Pine Script designed for TradingView. This script provides an adaptive trailing stop mechanism that leverages the Exponential Moving Average (EMA) to adjust trailing stops based on market conditions. The strategy dynamically switches between trending and ranging markets by utilizing both Average True Range (ATR) and Average Directional Index (ADX) to detect market conditions.
Key Features:
EMA-Based Trailing Stop:
The script uses the EMA value to set trailing stops precisely. The EMA offers a more responsive calculation to price changes, ensuring closer and more accurate trailing stops that follow market movements effectively.
Market Condition Detection:
The script employs ATR and ADX to distinguish between trending and ranging markets. ATR measures market volatility, while ADX gauges trend strength. The combination of these two indicators provides a more accurate market condition detection.
Customizable Settings:
The script offers various flexible parameters to adjust EMA length, multipliers, and ATR length. Users can customize these settings according to their preferences and trading strategy.
Two Modes:
The script adapts to market conditions by providing two modes: trending mode and ranging mode. In trending mode, the trailing stop is tighter to follow price movements closely, whereas in ranging mode, the trailing stop is looser to accommodate lower volatility.
Entry and Exit Conditions:
The script detects market conditions to set buy and sell signals. These conditions include the calculations of EMA, ATR, and ADX to ensure the signals generated are valid and profitable.
Alerts:
The script provides buy and sell signals through alert conditions for efficient trade management. Users can enable these alerts to get real-time notifications when valid buy or sell signals are detected.
Suitable for Scalping and Swing Trading:
The script is well-suited for both scalping and swing trading strategies. Scalpers can benefit from the responsive and tighter trailing stops during trending conditions, while swing traders can take advantage of the adaptive and looser trailing stops during ranging conditions, allowing them to capture larger price movements.
Explanation of Mode 1 and Mode 2:
Mode 1: Trending Market:
In this mode, the market is identified as trending based on the ADX and ATR values.
LONG 1: This label indicates a buy signal in the trending market mode. It signifies that the trailing stop has been activated and a long position (buy) should be taken when the market is trending.
SHORT 1: This label indicates a sell signal in the trending market mode. It signifies that the trailing stop has been activated and a short position (sell) should be taken when the market is trending.
Mode 2: Ranging Market:
In this mode, the market is identified as ranging based on the ADX and ATR values.
LONG 2: This label indicates a buy signal in the ranging market mode. It signifies that the trailing stop has been activated and a long position (buy) should be taken with a looser trailing stop when the market is ranging.
SHORT 2: This label indicates a sell signal in the ranging market mode. It signifies that the trailing stop has been activated and a short position (sell) should be taken with a looser trailing stop when the market is ranging.
Technical Usage:
Variable Initialization:
The script initializes variables to store values such as trailing stop, long position status, and short position status.
Market Condition Detection:
The script calculates ATR and ADX values to detect whether the market is trending or ranging. This includes the use of f_adx function to calculate ADX values and determine market conditions.
EMA-Based Trailing Stop Calculation:
The script adjusts the trailing stop based on EMA values and ATR. The calculation involves customizable multipliers and parameters that influence the trailing stop's precision.
Plot Trailing Stop:
The script displays the trailing stop on the chart for clear visualization. This includes plotting the trailing stop line with appropriate colors to indicate long and short positions.
Entry and Exit Conditions:
The script determines the entry (buy) and exit (sell) conditions based on market condition detection and trailing stop settings. These conditions are crucial for generating valid buy or sell signals.
Plotshape and Alert:
The script provides plotshapes for buy and sell signals and sets up alert conditions for real-time notifications when a valid buy or sell signal is detected.
ATR stop lossPlots the stop loss level based on average true range (ATR) and a multiplier of choice (1 to 2.5, default is 1.5), subtracted from closing price.
Additions in this version:
You can now show percentage labels to help evaluate the level of risk.
The color of the plotted line and the text labels can be picked by the user.

Multi Timeframe Market Formation [LuxAlgo]The Multi Timeframe Market Formation tool allows traders to analyze up to 6 different timeframes simultaneously to discover their current formation, S/R levels and their degree of synchronization with the current chart timeframe. Multi timeframe analysis made easy.
🔶 USAGE
By default, the tool displays the chart's timeframe formation plus up to 5 other formations on timeframes higher than the one in the chart.
When the chart formation is synchronized with any enabled timeframe formation, the tool displays labels and a trailing channel, it uses a gradient by default, so the more timeframes are synchronized, the more visible the labels and the trailing channel are.
All timeframes enabled in the settings panel must be higher than the chart timeframe, otherwise the tool will display an error message.
🔹 Formations
A formation is a market structure defined by a lower and an upper boundary (also known as support & resistance).
Each formation has a different symbol and color to identify it at a glance.
It helps traders to know the current market behavior and the tool displays up to 5 of them.
BULLISH (green ▲): higher high and higher low
BEARISH (red ▼): lower high and lower low
CONTRACTION (orange ◀): lower high and higher low
EXPANSION (blue ▶): higher high and lower low
SIDEWAYS (yellow ◀): Any that does not fit with the others
🔹 Multi Timeframe Formations
The tool displays up to 6 different timeframe formations, the chart timeframe plus 5 more configurable from the settings panel.
Each of them has an upper and lower limit, a timeframe, a color and an icon.
If a bound level is shared by more than one formation, the timeframes and symbols are displayed on the same line.
These are significant levels shared by different timeframes and traders need to be aware of them.
🔹 Sync With Chart Timeframe
If the current formation on the chart timeframe is in sync with any of the timeframes enabled in the settings panel, the tool will display this on the chart.
The more timeframes are in sync, the more they are visible, providing a clear visual representation of the common market behavior on multiple timeframes at the same time.
🔶 SETTINGS
Formation size: Size of market formations on the chart timeframe
🔹 Timeframes
TF1 to TF5: Activate/deactivate timeframe, set size of market formation and activate/deactivate high and low levels
🔹 Style
Show Labels: Enable/Disable Timeframe Sync Labels
Transparency Gradient: Enable/Disable Transparency Gradient
Show Trailing Channel | Multiplier: Enable/Disable Trailing Channel and set multiplier
Color for each formation

3 EMA + RSI with Trail Stop [Free990] (LOW TF)This trading strategy combines three Exponential Moving Averages (EMAs) to identify trend direction, uses RSI to signal exit conditions, and applies both a fixed percentage stop-loss and a trailing stop for risk management. It aims to capture momentum when the faster EMAs cross the slower EMA, then uses RSI thresholds, time-based exits, and stops to close trades.
Short Explanation of the Logic
Trend Detection: When the 10 EMA crosses above the 20 EMA and both are above the 100 EMA (and the current price bar closes higher), it triggers a long entry signal. The reverse happens for a short (the 10 EMA crosses below the 20 EMA and both are below the 100 EMA).
RSI Exit: RSI crossing above a set threshold closes long trades; crossing below another threshold closes short trades.
Time-Based Exit: If a trade is in profit after a set number of bars, the strategy closes it.
Stop-Loss & Trailing Stop: A fixed stop-loss based on a percentage from the entry price guards against large drawdowns. A trailing stop dynamically tightens as the trade moves in favor, locking in potential gains.
Detailed Explanation of the Strategy Logic
Exponential Moving Average (EMA) Setup
Short EMA (out_a, length=10)
Medium EMA (out_b, length=20)
Long EMA (out_c, length=100)
The code calculates three separate EMAs to gauge short-term, medium-term, and longer-term trend behavior. By comparing their relative positions, the strategy infers whether the market is bullish (EMAs stacked positively) or bearish (EMAs stacked negatively).
Entry Conditions
Long Entry (entryLong): Occurs when:
The short EMA (10) crosses above the medium EMA (20).
Both EMAs (short and medium) are above the long EMA (100).
The current bar closes higher than it opened (close > open).
This suggests that momentum is shifting to the upside (short-term EMAs crossing up and price action turning bullish). If there’s an existing short position, it’s closed first before opening a new long.
Short Entry (entryShort): Occurs when:
The short EMA (10) crosses below the medium EMA (20).
Both EMAs (short and medium) are below the long EMA (100).
The current bar closes lower than it opened (close < open).
This indicates a potential shift to the downside. If there’s an existing long position, that gets closed first before opening a new short.
Exit Signals
RSI-Based Exits:
For long trades: When RSI exceeds a specified threshold (e.g., 70 by default), it triggers a long exit. RSI > short_rsi generally means overbought conditions, so the strategy exits to lock in profits or avoid a pullback.
For short trades: When RSI dips below a specified threshold (e.g., 30 by default), it triggers a short exit. RSI < long_rsi indicates oversold conditions, so the strategy closes the short to avoid a bounce.
Time-Based Exit:
If the trade has been open for xBars bars (configurable, e.g., 24 bars) and the trade is in profit (current price above entry for a long, or current price below entry for a short), the strategy closes the position. This helps lock in gains if the move takes too long or momentum stalls.
Stop-Loss Management
Fixed Stop-Loss (% Based): Each trade has a fixed stop-loss calculated as a percentage from the average entry price.
For long positions, the stop-loss is set below the entry price by a user-defined percentage (fixStopLossPerc).
For short positions, the stop-loss is set above the entry price by the same percentage.
This mechanism prevents catastrophic losses if the market moves strongly against the position.
Trailing Stop:
The strategy also sets a trail stop using trail_points (the distance in price points) and trail_offset (how quickly the stop “catches up” to price).
As the market moves in favor of the trade, the trailing stop gradually tightens, allowing profits to run while still capping potential drawdowns if the price reverses.
Order Execution Flow
When the conditions for a new position (long or short) are triggered, the strategy first checks if there’s an opposite position open. If there is, it closes that position before opening the new one (prevents going “both long and short” simultaneously).
RSI-based and time-based exits are checked on each bar. If triggered, the position is closed.
If the position remains open, the fixed stop-loss and trailing stop remain in effect until the position is exited.
Why This Combination Works
Multiple EMA Cross: Combining 10, 20, and 100 EMAs balances short-term momentum detection with a longer-term trend filter. This reduces false signals that can occur if you only look at a single crossover without considering the broader trend.
RSI Exits: RSI provides a momentum oscillator view—helpful for detecting overbought/oversold conditions, acting as an extra confirmation to exit.
Time-Based Exit: Prevents “lingering trades.” If the position is in profit but failing to advance further, it takes profit rather than risking a trend reversal.
Fixed & Trailing Stop-Loss: The fixed stop-loss is your safety net to cap worst-case losses. The trailing stop allows the strategy to lock in gains by following the trade as it moves favorably, thus maximizing profit potential while keeping risk in check.
Overall, this approach tries to capture momentum from EMA crossovers, protect profits with trailing stops, and limit risk through both a fixed percentage stop-loss and exit signals from RSI/time-based logic.

Fractal Trail [UAlgo]The Fractal Trail is designed to identify and utilize Williams fractals as dynamic trailing stops. This tool serves traders by marking key fractal points on the chart and leveraging them to create adaptive stop-loss trails, enhancing risk management and trade decision-making.
Williams fractals are pivotal in identifying potential reversals and critical support/resistance levels. By plotting fractals dynamically and providing configurable options, this indicator allows for personalized adjustments based on the trader's strategy.
This script integrates both visual fractal markers and adjustable trailing stops, offering insights into market trends while catering to a wide variety of trading styles and timeframes.
🔶 Key Features
Williams Fractals Identification: The indicator marks Williams Fractals on the chart, which are significant highs and lows within a specified range. These fractals are crucial for identifying potential reversal points in the market.
Dynamic Trailing Stops: The indicator generates dynamic trailing stops based on the identified fractals. These stops adjust automatically as new fractals are formed, providing a responsive and adaptive approach to risk management.
Fractal Range: Users can specify the number of bars to the left and right for analyzing fractals, allowing for flexibility in identifying significant price points.
Trail Buffer Percentage: A percentage-based safety margin can be added between the fractal price and the trailing stop, providing additional control over risk management.
Trail Invalidation Source: Users can choose whether the trailing stop flips based on candle closing prices or the extreme points (high/low) of the candles.
Alerts and Notifications: The indicator provides alerts for when the price crosses the trailing stops, as well as when new Williams Fractals are confirmed. These alerts can be customized to fit the trader's notification preferences.
🔶 Interpreting the Indicator
Fractal Markers: The triangles above and below the bars indicate Williams Fractals. These markers help traders identify potential reversal points in the market.
Trailing Stops: The dynamic trailing stops are plotted as lines on the chart. These lines adjust based on the latest identified fractals, providing a visual representation of potential support and resistance levels.
Fill Colors: The optional fill colors between the trailing stops and the price action help traders quickly identify the current trend and potential pullback zones.
🔶 Disclaimer
Use with Caution: This indicator is provided for educational and informational purposes only and should not be considered as financial advice. Users should exercise caution and perform their own analysis before making trading decisions based on the indicator's signals.
Not Financial Advice: The information provided by this indicator does not constitute financial advice, and the creator (UAlgo) shall not be held responsible for any trading losses incurred as a result of using this indicator.
Backtesting Recommended: Traders are encouraged to backtest the indicator thoroughly on historical data before using it in live trading to assess its performance and suitability for their trading strategies.
Risk Management: Trading involves inherent risks, and users should implement proper risk management strategies, including but not limited to stop-loss orders and position sizing, to mitigate potential losses.
No Guarantees: The accuracy and reliability of the indicator's signals cannot be guaranteed, as they are based on historical price data and past performance may not be indicative of future results.

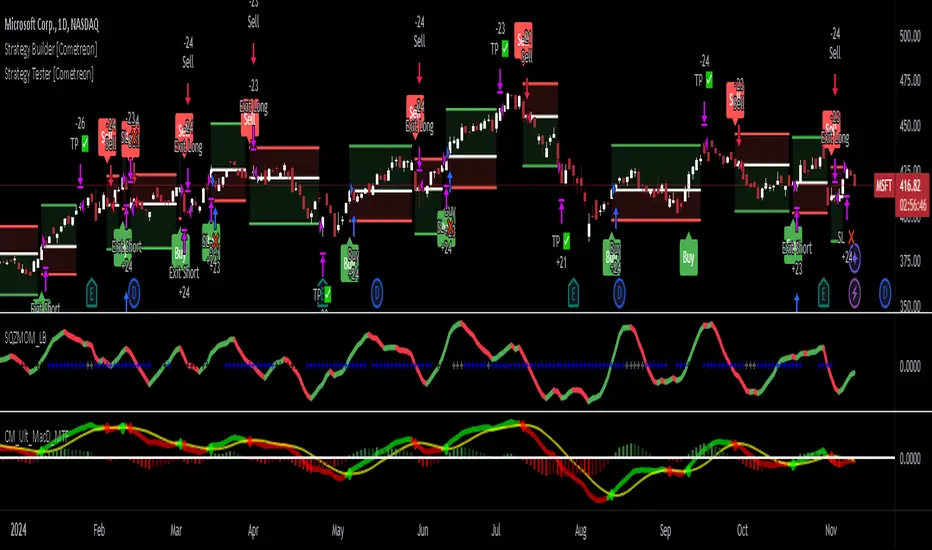
Strategy Tester [Cometreon]Strategy Tester is a powerful backtesting engine designed to evaluate and optimize trading strategies built with the Strategy Builder or signals triggered by the Signal Tester.
It provides a full-featured environment for assessing strategy performance across symbols and timeframes, offering smart tools for risk management, capital allocation, and alert handling.
Whether you're refining a custom strategy or validating signals, Strategy Tester helps you test with confidence and clarity.
🔷 Key Features
🟩 Multi-Symbol, Multi-Timeframe Testing
Easily test strategies across different assets and timeframes to understand how they behave in diverse market conditions.
🟩 Advanced Risk Management
Implement multiple Take Profit and Stop Loss combinations, break-even, trailing systems, and exit rules tailored to your style.
🟩 Flexible Session and Capital Settings
Customize trading hours, session windows, and initial capital allocation for ultra-precise testing scenarios.
🟩 Custom Alerts
Generate personalized alerts for entries, exits, and SL/TP adjustments to simulate real-time execution.
🔷 Technical Details and Customizable Inputs
1️⃣ Source Entry Long and Short - Select entry conditions for the strategy from the "Signal Tester" or "Strategy Builder".
2️⃣ Source Exit Long and Short - Select exit conditions for the strategy from the "Signal Tester" or "Strategy Builder".
3️⃣ Trading Session - Choose the period in which the strategy will enter positions, selecting from: Months, Days, up to 3 hourly sessions, and the strategy's activity range, i.e., start and end date.
4️⃣ Alert Message - Set custom messages for each type of Alert, such as Entry Long, Exit Short, or Change SL Long.
5️⃣ Plot - Choose whether to show Long and Short positions on the chart.
🔷 Risk Management Settings
1️⃣ Initial Capital - Set the starting capital for the strategy.
2️⃣ Quantity - Choose the entry quantity for each type of position, selecting from: Contracts, USD, Percentage of equity, or percentage of initial capital.
3️⃣ Take Profit - Configure up to 4 Take Profits using one of the following types:
%: Percentage from the entry price
USD: Distance in dollars
Pip: Distance in Pips
ATR: Based on ATR multiplier
Swing: Uses swing length
Risk Reward: Linked to Stop Loss or vice versa
4️⃣ Stop Loss - Set the SL using the same types as TP for maximum flexibility.
5️⃣ Break Even - Automatically modify SL when price hits a TP level, adjusting by % / USD / Pip from entry.
6️⃣ Trailing Take Profit - Activates a dynamic TP when a condition is met, updating it as price evolves (e.g., new highs).
7️⃣ Trailing Stop Loss - Updates SL automatically when the market moves in your favor (e.g., new lows in long trades).
8️⃣ Exit Before End Session - Exit positions a few candles before the session ends to avoid overnight risks.
🔍 How to Use Strategy Tester
🧩 Add the Indicator:
Load Strategy Tester onto your chart and connect it to any Cometreon signal generator.
⚙️ Configure Risk Settings:
Set up capital, risk, SL/TP parameters, and time filters to match your strategy profile.
🧪 Run the Test:
Execute the backtest and analyze the visual + data output for insight.
📊 Optimize and Repeat:
Adjust key parameters and re-run until your strategy achieves optimal performance.
☄️ Take your trading to the next level with TradeLab Beta's Strategy Tester this powerful backtesting tool and start optimizing your trading strategies today.
👉 Don't waste any more time and visit the link to get access to all Cometreon indicators.
Trailing Stop Loss Smart [TradingFinder] Market Trend + CVD/EMA🔵 Introduction
Trailing Stop Loss (TSL) is one of the most powerful tools available. A Trailing Stop Loss is a modification of a typical stop order that adjusts dynamically based on market price movement. It can be set at a defined percentage or dollar amount away from the security's current market price, making it a flexible tool for locking in profits while minimizing risk. Unlike standard stop-loss orders, a Trailing Stop follows the market in the direction of the trade, protecting gains without requiring constant manual adjustments.
The Trailing Stop Loss Smart (TFlab Trailing Stop) indicator takes this concept even further by incorporating advanced metrics like Cumulative Volume Delta (CVD), volume dynamics, and Average True Range (ATR). This combination not only enhances risk management but also acts as a trend identifier, providing traders with a powerful tool to capitalize on both short-term and long-term price movements.
This indicator also supports various Order Types, allowing for flexible strategies that include a trailing stop/stop-loss combo to maximize winning trades while minimizing losses. The trailing stop limit is particularly useful for traders who want to set their stop at a precise level relative to the current market price, either by a percentage or a dollar amount. The Trailing Stop Loss Smart indicator can help ensure that traders do not exit too early during trends, while the stop-loss feature kicks in during reversals.
The advantages of using a Trailing Stop Loss are its ability to protect profits and reduce the emotional decision-making process in volatile markets. However, like all trading strategies, it has disadvantages, such as the risk of triggering too early during normal market fluctuations. By understanding how the Trailing Stop Loss Smart indicator integrates features like CVD, ATR, and volume analysis, traders can leverage its full potential while navigating these pros and cons.
With its unique ability to track market movements and trends using Cumulative Volume Delta, volume dynamics, and ATR-based trailing stops, this indicator offers a complete solution for traders looking to secure profits while minimizing downside risk. Whether you're employing a simple trailing stop or a trailing stop/stop-loss combo, this tool provides all the flexibility and precision needed to execute winning trades in various markets, including Forex, Crypto, and Stock.
🔵 How to Use
The Trailing Stop Loss Smart indicator integrates multiple advanced components to provide traders with superior risk management and trend identification.
Here’s how each part of the logic works :
🟣 Cumulative Volume Delta (CVD) Logic
The CVD tracks buying and selling pressure by calculating the difference between upward and downward price movements. When there’s more buying pressure, the CVD is positive, indicating a potential bullish trend. Conversely, more selling pressure results in a negative CVD, pointing to a bearish trend.
CVD Trend Detection : The indicator determines whether the market is in a bullish or bearish phase by comparing the CVD to its moving average. A bullish trend is confirmed when the CVD is above its moving average and the price is closing higher.
A bearish trend occurs when the CVD is below its moving average and the price is closing lower. This trend detection is critical for determining whether the trailing stop should be placed below the price (bullish) or above it (bearish).
🟣 Volume Dynamics
Volume is a key factor in identifying market strength. The Trailing Stop Loss Smart indicator pulls volume data based on the market selected (Forex, Crypto, or Stock) and adjusts the trailing stop based on whether the market is experiencing high volume or low volume.
High Volume : When the current volume exceeds the average volume, the market is in a high-volume state. During these conditions, the trailing stop is placed closer to the price, as high volume often indicates strong trends with less chance of reversals.
Low Volume : In low-volume conditions, the trailing stop gives the market more room to breathe by placing the stop further away from the price. This prevents premature stop-outs in periods of reduced market activity.
🟣 ATR-Based Trailing Stop
The Average True Range (ATR) is used to measure market volatility. The Trailing Stop Loss Smart uses the ATR to dynamically adjust the stop-loss distance.
Bullish Market : When a bullish trend is detected, the trailing stop is placed below the lowest price of the recent bars (determined by the Bar Back parameter), and adjusted by the ATR Multiplier. This allows for tighter protection during strong bullish trends.
Bearish Market : When the market is bearish, the trailing stop is placed above the highest price of recent bars, also adjusted by the ATR Multiplier. This ensures that short positions are safeguarded against sudden reversals.
🟣 Dynamic Stop-Loss Updates
The trailing stop is updated every few bars (according to the Refiner parameter), ensuring it remains relevant to the most recent price action and volume changes. This dynamic feature ensures the stop-loss adapts to both trending and volatile market conditions, without requiring manual intervention.
High Volume with Trends : In periods of high volume and a confirmed trend, the stop-loss is positioned tightly to lock in profits while minimizing the risk of reversal.
Low Volume with Trends : In low-volume conditions, the stop-loss is placed further from the price, allowing the market to move freely without triggering premature exits.
🟣 Visual Representation
The indicator visually represents the trailing stop on the chart, with green lines indicating bullish trends and red lines for bearish trends. This visual aid helps traders quickly assess the state of the market and the position of their trailing stop in real-time.
🔵 Settings
The Trailing Stop Loss Smart indicator offers several customizable settings to suit various trading strategies. Understanding these inputs is key to optimizing the tool for your specific trading style.
🟣 General Settings
Cumulative Mode : This controls how the CVD is calculated.
You can choose between :
EMA : Exponential Moving Average smoothing.
Periodic : Sums the delta over a fixed period.
CVD Period : Defines the look-back period for CVD calculation. A longer period smooths the data, making it less sensitive to short-term fluctuations.
Ultra Data : This Boolean input aggregates volume across multiple exchanges for a more comprehensive view of market activity.
Market Ultra Data : Select between Forex, Crypto, and Stock to ensure the indicator pulls accurate volume data for your market.
🟣 Logical Settings
Moving Average CVD Period : Defines the period for the moving average of the CVD. A longer period smooths the trend, reducing noise.
Moving Average Volume Period : Sets the period for the moving average used to distinguish between high and low volume conditions.
Level Finder Bar Back : Determines how many bars to look back when identifying the highest or lowest price for trailing stop placement.
Levels update per candles : Sets how often (in bars) the trailing stop should be updated to remain in sync with market movements.
ATR On : Toggles the use of ATR to adjust the trailing stop based on volatility.
ATR Multiplie r: Defines how far the stop is placed from the price based on the ATR. A larger multiplier increases the stop distance, reducing the likelihood of getting stopped out during market fluctuations.
ATR Multiplier Adjusts the distance of the trailing stop based on the ATR. A higher multiplier places the stop further from the price, providing more breathing room in volatile markets.
🔵 Conclusion
The Trailing Stop Loss Smart indicator is a comprehensive tool for traders looking to manage risk while identifying market trends. By incorporating Cumulative Volume Delta (CVD) to detect buying and selling pressure, volume dynamics to gauge market activity, and ATR to adjust for volatility, this indicator ensures that stop-loss levels are both adaptive and protective.
Whether you’re trading in Forex, Crypto, or Stock markets, the Trailing Stop Loss Smart allows you to capitalize on trends while dynamically adjusting to changing market conditions. Its ability to distinguish between high-volume and low-volume periods ensures that you’re not stopped out prematurely during periods of consolidation or market hesitation.
By providing real-time visual feedback, dynamic adjustments, and trend identification, this indicator serves as a vital tool for traders aiming to maximize profits while minimizing risk. Its versatility and adaptability make it an essential part of any trader’s toolkit, helping you stay ahead in fast-moving markets while safeguarding your positions.

Chandelier Exit Pro w/ExtensionsChandelier Exit Pro w/Extensions
The Chandelier Exit Pro w/Extensions indicator is designed to assist traders in managing risk and identifying trend reversals. The strategy is based on the Chandelier Exit concept, originally created by Charles Le Beau. It uses the Average True Range (ATR) to calculate dynamic stop levels that adjust based on market volatility. This script not only implements the standard Chandelier Exit, but also introduces extension levels and alerts to enhance decision-making.
Key Features:
➡️Dynamic Stop Levels: The indicator calculates stop levels for both long and short positions based on an ATR multiple. This allows traders to determine exit points by monitoring when the price crosses above or below these levels. These levels adapt in real-time based on price volatility, making them a versatile tool for trend-following strategies.
➡️Extension Levels: In addition to the primary stop levels, the script includes extension levels for more advanced stop-loss management. Traders can view active and extension levels separately, providing more flexibility in their exit strategies.
➡️Labels and Visual Cues: The indicator provides dynamic labels that automatically update and follow the plotted stop levels. Labels include the ATR multiplier value (e.g., "2.5" or "2.5ext"), clearly showing the significance of each level. When price crosses below or above a level, the corresponding label is highlighted, aiding traders in quickly identifying the most relevant stop level.
➡️Bar Confirmation and Alerts: The script includes an "await bar confirmation" option to ensure that the stop levels and alerts only trigger after the bar has closed. Alerts are customizable and will notify traders when price crosses critical levels, helping to make timely decisions without the need to constantly monitor charts.
➡️Multiple ATR Levels for Enhanced Precision: The indicator supports up to four different ATR levels, each with customizable multipliers. This allows traders to set different thresholds for exits based on varying degrees of volatility. For example, Level 1 (2.5x ATR) might represent a tighter stop, while Level 4 (10x ATR) could serve as a wider stop for long-term positions.
➡️Calc_bars_count: Improves efficiency of the indicator by reducing the on-chart calculations in to the past. This input can be found at the bottom of the INPUTS tab.
How it Helps Traders:
💥Trend Identification: By using the Chandelier Exit levels, traders can identify when the trend is likely to reverse. When the price crosses below the stop level in a long trade or above the stop level in a short trade, it signals a potential exit point.
💥Volatility-based Adjustments: Unlike static stop-loss methods, the ATR-based stop levels dynamically adjust based on the market’s volatility. This means tighter stops during low volatility periods and wider stops during high volatility periods, reducing the chance of being stopped out prematurely.
💥Risk Management: The dynamic stop levels and extension levels provide a structured way to manage risk. Traders can set tighter stops for short-term trades and wider stops for longer-term trades. The script's visual labels make it easy to track these levels in real-time.
💥Automation with Alerts: The built-in alert system ensures that traders are notified when key levels are crossed. This helps to avoid emotional decision-making and allows for better execution of trading strategies.
Confluence and Price Fluidity:
One of the powerful ways to enhance the effectiveness of the Chandelier Exit indicator is by using it in conjunction with other technical analysis tools to create confluence. Confluence occurs when multiple indicators or price action signals align, providing stronger confirmation for a trade decision. For example:
🎯Support and Resistance Levels: Traders can use the Chandelier Exit levels in combination with key support and resistance zones. If the price is nearing a support level and the Chandelier Exit signals a bullish reversal, this alignment strengthens the case for entering a long position.
🎯Moving Averages: When the Chandelier Exit signals a trend reversal and this is confirmed by a crossover in moving averages (such as a 50-day and 200-day moving average), traders gain additional confidence in the trade direction.
🎯Momentum Indicators: Traders can also look for momentum indicators like RSI or MACD to confirm the strength of a trend or potential reversal. For instance, if the Chandelier Exit triggers a short signal and the RSI also shows overbought conditions, this could provide stronger confirmation to exit a long trade or enter a short position.
🎯Candlestick Patterns: Price fluidity can be monitored using candlestick formations. For example, a bearish engulfing pattern near a Chandelier Exit resistance level offers confluence, adding confidence to the signal to close or short the trade.
By combining the Chandelier Exit with other tools, traders ensure that they are not relying on a single indicator. This layered approach can reduce the likelihood of false signals and improve overall trading accuracy.
Practical Use Case:
Imagine a trader enters a long position, and the price moves favorably. Using the Chandelier Exit, the trader sets the initial stop level at 2.5x ATR below the highest close. As the price continues to rise, the stop level follows the price, locking in profits. If the market suddenly turns, the price crossing below the stop level signals an exit, helping the trader preserve gains. With extension levels, the trader can further refine exits, adjusting based on their risk tolerance and market conditions.
Good luck and I hope that you can find a place in your tool bag to use this dynamic indicator 🙏

TS CalculatorWhat is Trailing Stop?
A trailing stop is a type of stop-loss order that adjusts itself as the price of an asset moves in a favorable direction. It’s designed to lock in profits or limit losses by following the asset’s price movement. Here’s how it works:
How a Trailing Stop Works
Initial Setup: You set a trailing stop at a certain percentage or dollar amount below (for long trades) or above (for short trades) the current market price.
Price Movement: As the price moves in your favor, the trailing stop moves with it, maintaining the set distance.
Locking in Profits: If the price reverses direction by the set amount, the trailing stop triggers a market order to sell (for long trades) or buy (for short trades), locking in your profits or limiting your losses.
Example
Long Trade: If you buy a stock at $100 and set a trailing stop at 10%, the stop-loss order will initially be at $90. If the stock price rises to $120, the trailing stop moves up to $108 (10% below $120). If the price then drops to $108, the trailing stop triggers a sell order.
Short Trade: If you short a stock at $100 and set a trailing stop at 10%, the stop-loss order will initially be at $110. If the stock price falls to $80, the trailing stop moves down to $88 (10% above $80). If the price then rises to $88, the trailing stop triggers a buy order.
Benefits
Automated Risk Management: It helps manage risk without the need to constantly monitor the market.
Profit Protection: It locks in profits as the price moves in your favor.
Flexibility: It adjusts dynamically with the market price, unlike a fixed stop-loss order.
What this script does ?
This script plots the Trailing Stop from the point of entry to current date, until it hits the trailing stop. Some of the market did not give the trailing stop values exactly so this script may give you a wise view of that.
Variables
Date : Date with YYYY-MM-DD format
Time : Time with HH:MM:SS format
Entry Price : Activation Price of TS order
Bounceback Ratio : Ratio for TS
Order Type : Position of order as Long/Short
There is an also a table implemented which shows
Entry
Ratio
Position
Current Stop
For possible updates feel free to contact me via DM.

Trailing Stop ProTrailing Stop Pro is a sophisticated TradingView indicator designed to enhance your trading strategy by dynamically managing trailing stops based on market volatility. This tool leverages the Average True Range (ATR) to adjust stop levels, providing traders with a robust mechanism to protect profits and minimize losses.
Key Features:
Dynamic Trailing Stops: Automatically adjusts stop levels using ATR, allowing for responsive and adaptive risk management.
Customizable Inputs: Tailor the indicator to your trading style with adjustable parameters such as ATR Length, ATR Multiplier, and Source Vector.
Visual Clarity: Distinct color settings for long and short stops, with adjustable line thickness and transparency, ensuring clear visualization on your charts.
Professional Grade: The "Pro" designation signifies advanced features suitable for both novice and experienced traders seeking reliable and efficient stop management.
How It Works:
To set up the indicator, begin by defining the Chrono Point, which specifies the exact time you want the trailing stop mechanism to activate. This allows for precise control over when your stops begin to trail. Next, set the Credit Unit as the initial entry price for your trade, serving as the baseline from which the trailing stops will adjust.
The indicator uses ATR-based adjustments to determine stop levels. Customize the sensitivity of the trailing stop by adjusting the ATR Length (default is 14) and ATR Multiplier (default is 0.5). A longer ATR length smooths out volatility, while a higher multiplier increases the distance of the stop from the price.
Select your Source Vector from "High/Low," "Close," or "Open" prices as the basis for stop calculation. This flexibility allows you to align the indicator with your preferred trading strategy. The indicator plots trailing stops directly on the chart, with color-coded lines indicating long (teal) and short (red) positions. You can adjust the line thickness and transparency for optimal visibility.
The Mission Status feature automatically detects whether the trade is long or short and adjusts the trailing stop accordingly. If the price hits the trailing stop, the trade is considered exited, and the indicator calculates the profit or loss percentage.
Benefits:
Risk Management: Protect your trades from adverse market movements while locking in profits as prices move favorably.
Automation: Reduce manual intervention with automatic stop adjustments, allowing you to focus on strategic decision-making.
User-Friendly Interface: Intuitive settings and clear visual cues make it easy to integrate into your existing trading workflow.
Conclusion:
Trailing Stop Pro is an essential tool for traders looking to enhance their risk management strategies with precision and ease. By automating the trailing stop process and providing clear visual feedback, this indicator empowers you to navigate the markets with confidence. Whether you're a seasoned trader or just starting, Trailing Stop Pro offers the functionality and flexibility needed to optimize your trading performance.
The Trailing Stop Pro indicator is a tool designed to assist traders in managing risk and optimizing their trading strategies. However, it should not be considered as financial advice or a guarantee of profitability. Trading involves significant risk, and it is possible to lose more than your initial investment. Users are encouraged to thoroughly test the indicator in a demo environment and consider their own financial situation and risk tolerance before using it in live trading. Past performance is not indicative of future results, and users should seek advice from a qualified financial advisor if needed.

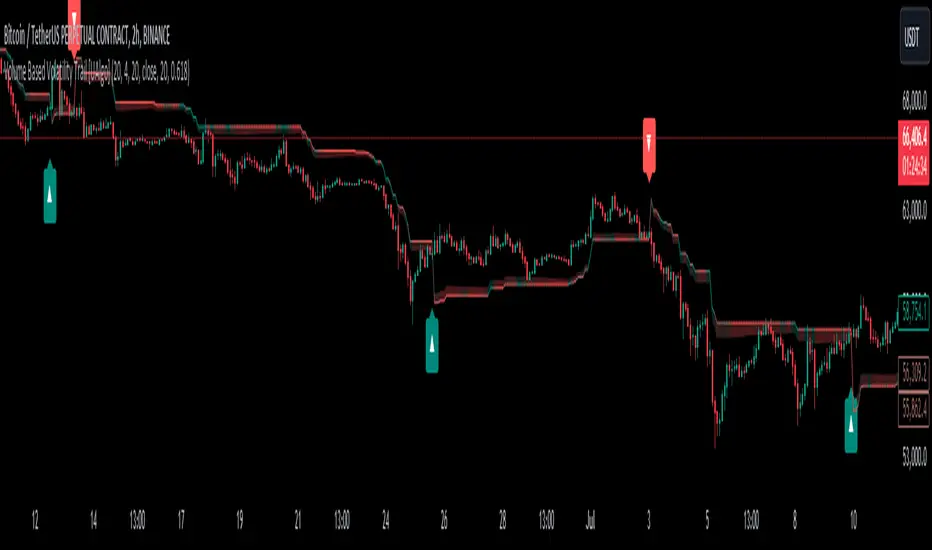
Volume Based Volatility Trail [UAlgo]"Volume Based Volatility Trail ", is designed to identify potential trading opportunities based on volatility and volume analysis. It calculates the Average True Range (ATR) to gauge market volatility and uses a volume-based multiplier to dynamically adjust a trailing stop level. The indicator also incorporates volume analysis to identify high volume periods that might signal potential breakouts.
🔶 Key Features
Volume-Based Volatility Trail: The indicator calculates a trailing stop level based on the ATR, which is then adjusted based on volume. Higher volume periods can lead to a wider trailing stop to account for increased volatility.
Price Source: Users can select the price source (e.g., close, open) for volume calculations.
Customizable Inputs: Users can adjust various parameters like the ATR period, multiplier, smoothing period, volume SMA period, ATR adjustment factor, and colors for buy/sell signals and the trailing stop area.
Buy/Sell Alerts: The indicator generates alerts for potential buy and sell opportunities based on the trailing stop crossing the price.
🔶 Usage
Look for buy signals (▲ marker) when the price crosses above the trailing stop level, potentially indicating a bullish trend.
Conversely, sell signals (▼ marker) appear when the price falls below the trailing stop, suggesting a bearish trend.
The shaded area around the trailing stop represents a buffer zone that might offer some protection against price fluctuations, but it can also indicate areas of potential pullbacks. During volatile periods or after strong price movements, the price might retrace back towards the trailing stop before continuing its trend. This shaded area can help visualize these potential retracement zones.
High volume periods (highlighted by the indicator) can be used in conjunction with other technical analysis to confirm potential breakouts. Analyze these high volume periods alongside price action and other indicators to assess the strength of the breakout and the likelihood of the price continuing its upward move.
🔶 Disclaimer:
Use with Caution: This indicator is provided for educational and informational purposes only and should not be considered as financial advice. Users should exercise caution and perform their own analysis before making trading decisions based on the indicator's signals.
Not Financial Advice: The information provided by this indicator does not constitute financial advice, and the creator (UAlgo) shall not be held responsible for any trading losses incurred as a result of using this indicator.
Backtesting Recommended: Traders are encouraged to backtest the indicator thoroughly on historical data before using it in live trading to assess its performance and suitability for their trading strategies.
Risk Management: Trading involves inherent risks, and users should implement proper risk management strategies, including but not limited to stop-loss orders and position sizing, to mitigate potential losses.
No Guarantees: The accuracy and reliability of the indicator's signals cannot be guaranteed, as they are based on historical price data and past performance may not be indicative of future results.
Custom ATR Trailing StopThis Script creates a custom ATR (Average True Range) trailing stop. It allows traders to set up automated stop-loss levels based on the ATR, which adjusts dynamically to market volatility. The script is designed to support both long and short trades, offering flexibility and precision in trade management.
When loading the indicator to your chart, simply click to set the trade begining time, confirm various settings and you are set.
Check tooltips for more details in the input settigns menu.
User Inputs
Trade Setup: Allows users to set the trade direction (Long or Short), the signal source for entries, and the specific bar time for the trade setup.
ATR Settings: Configurable ATR lookback period, ATR smoothing period, initial ATR multiplier for setting the stop-loss, breakeven ATR multiplier, and a manual breakeven level.
ATR Calculations
Computes the ATR and its moving average.
Determines initial and breakeven stop levels based on the ATR.
Signal Validation
Validates long or short trade signals based on the specified bar time and trade direction.
Triggers alerts when a valid trade signal is detected.
Trailing Stop Logic
For long trades, adjusts the stop-loss level dynamically based on the ATR.
For short trades, performs similar adjustments in the opposite direction.
Updates the trailing stop level to ensure it follows the price, moving closer as the price moves favorably.
Resets the trade state when the stop-loss is hit, triggering an alert.
Plotting
Plots the trailing stop levels on the chart.
Uses green for stop levels indicating profit and red for stop levels indicating a loss.

FVG Instantaneous Mitigation Signals [LuxAlgo]The FVG Instantaneous Mitigation Signals indicator detects and highlights "instantaneously" mitigated fair value gaps (FVG), that is FVGs that get mitigated one bar after their creation, returning signals upon mitigation.
Take profit/stop loss areas, as well as a trailing stop loss are also included to complement the signals.
🔶 USAGE
Instantaneous Fair Value Gap mitigation is a new concept introduced in this script and refers to the event of price mitigating a fair value gap one bar after its creation.
The resulting signal sentiment is opposite to the bias of the mitigated fair value gap. As such an instantaneously mitigated bearish FGV results in a bullish signal, while an instantaneously mitigated bullish FGV results in a bearish signal.
Fair value gap areas subject to instantaneous mitigation are highlighted alongside their average level, this level is extended until reached in a direction opposite to the FVG bias and can be used as a potential support/resistance level.
Users can filter out less volatile fair value gaps using the "FVG Width Filter" setting, with higher values highlighting more volatile fair value gaps subject to instantaneous mitigation.
🔹 TP/SL Areas
Users can enable take-profit/stop-loss areas. These are displayed upon a new signal formation, with an area starting from the mitigated FVG area average to this average plus/minus N ATRs, where N is determined by their respective multiplier settings.
Using a higher multiplier will return more distant areas from the price, requiring longer-term variations to be reached.
🔹 Trailing Stop Loss
A trailing-stop loss is included, increasing when the price makes a new higher high or lower low since the trailing has been set. Using a higher trailing stop multiplier will allow its initial position to be further away from the price, reducing its chances of being hit.
The trailing stop can be reset on "Every Signal", whether they are bullish or bearish, or only on an "Inverse Signal", which will reset the trailing when a signal of opposite bias is detected, this will preserve an existing trailing stop when a new signal of the same bias to the present one is detected.
🔶 DETAILS
Fair Value Gaps are ubiquitous to price action traders. These patterns arise when there exists a disparity between supply and demand. The action of price coming back and filling these imbalance areas is referred to as "mitigation" or "rebalancing".
"Instantaneous mitigation" refers to the event of price quickly mitigating a prior fair value gap, which in the case of this script is one bar after their creation. These events are indicative of a market more attentive to imbalances, and more willing to correct disparities in supply and demand.
If the market is particularly sensitive to imbalances correction then these can be excessively corrected, leading to further imbalances, highlighting a potential feedback process.
🔶 SETTINGS
FVG Width Filter: Filter out FVGs with thinner areas from returning a potential signal.
🔹 TP/SL
TP Area: Enable take-profit areas for new signals.
Multiplier: Control the distance from the take profit and the price, with higher values returning more distant TP's.
SL Area: Enable stop-loss areas for new signals.
Multiplier: Control the distance from the stop loss and the price, with higher values returning more distant SL's.
🔹 Trailing Stop
Reset Trailing Stop: Determines when the trailing stop is reset.
Multiplier: Controls the initial position of the trailing stop, with higher values returning more distant trailing stops.

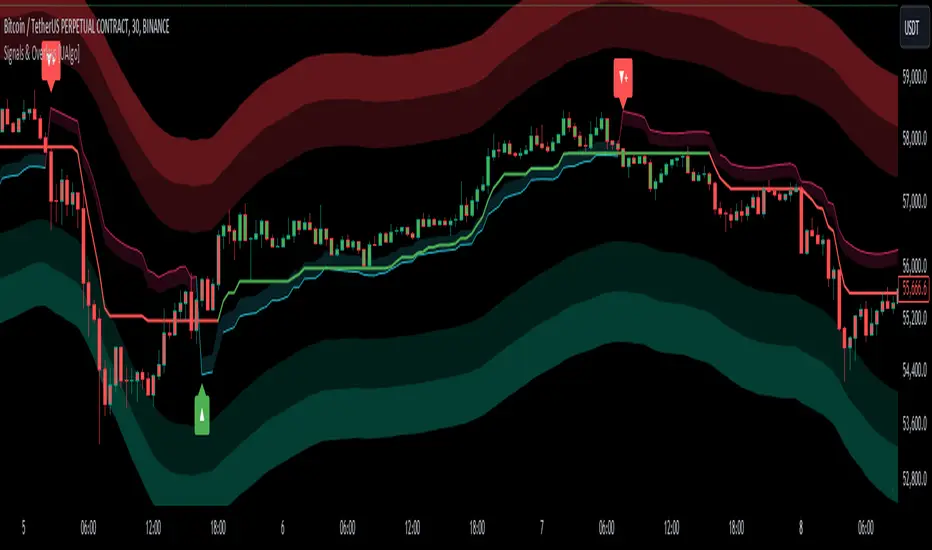
Signals & Overlays [UAlgo]The Signals & Overlays indicator is a comprehensive trading tool designed to provide traders with a holistic view of market conditions. It combines multiple analysis techniques to offer insights into trend direction, potential reversal points, and optimal entry and exit levels. This versatile indicator is suitable for various trading styles and timeframes, also has Beginner-Friendly presets to enable multiple features at once within one-click.
🔶 Key Features:
🔹 Contrarian Signals:
This feature identifies potential trend reversals and market turning points. These contrarian signals are displayed as arrow markers on the chart, alerting traders to possible opportunities that go against the prevailing trend. The signals are based on a combination of price action, momentum, and volatility factors, providing a multi-faceted approach to market analysis.
Customizable Settings :
Signal Sensitivity: Adjustable from 0.1 to 10.0. This controls how sensitive the indicator is to potential reversal signals.
🔹 Reversal Zones:
This feature utilizes statistical methods that compute a smoothed average and associated bands around a data series using Gaussian weights. The Gaussian distribution helps to assign more weight to data points near the center of the window, and the bands represent the average plus/minus a scaled measure of deviation.
This technique is often used in financial analysis to detect trends and measure volatility to identify key areas where price reversals are more likely to occur. These zones providing a dynamic representation of potential support and resistance areas. Traders can use these zones to anticipate potential price reactions and plan their entries and exits accordingly.
Users can also customize the responsiveness of the Reversal Zones through the "Zone Speed" setting. This allows for fine-tuning the model's sensitivity to price changes:
Swift Mode: Quickly adapts to recent price movements, ideal for short-term trading.
Standard Mode: Balances recent and historical data for a medium-term perspective.
Slow Mode: Emphasizes longer-term trends, suitable for position trading.
Customizable Settings :
Zone Data Source: Users can select which price data (open, high, low, close, etc.) to use for zone calculations.
Zone Speed: Choosable between "Swift", "Standard", and "Slow", affecting how quickly the zones adapt to price changes.
🔹 Smart Trail:
The Smart Trail feature provides an adaptive trend-following mechanism. It plots a dynamic line that adjusts based on price action and volatility, helping traders stay in trending moves while providing a trailing stop-loss reference. This feature is particularly useful for managing open positions and optimizing exit points.
🔹 Trend Cloud:
Generates a specialized trend indicator using double-smoothed EMAs applied to closing prices and the high-low price range. It visualizes market trends and volatility by shading the area between different indicator values over time. The color of the shading changes to reflect whether the current trend is strengthening or weakening.
The Trend Cloud feature provides a visually intuitive representation of the overall market trend. It generates a dynamic colored cloud on the chart that helps traders quickly assess the current market direction and strength. Bullish trends represented by blue clouds and bearish trends by red clouds.
🔹 Trend Analyzer:
The Trend Analyzer component provides an in-depth analysis of the current market trend. It uses a customizable moving average system to determine the trend direction and strength. The analyzer can be configured to focus on short-term, medium-term, or long-term trends, allowing traders to align their strategy with their preferred trading timeframe.
Customizable Settings :
Analyzer Calculation Period: Adjustable period for trend analysis calculations.
Analyzer Mode: Selectable between "Short-Term", "Medium-Term", and "Long-Term".
Analyzer Calculation Source: Customizable price data source for trend analysis.
Use Heikin Ashi: Option to use Heikin Ashi candles instead of regular candles for calculations.
🔹 TP/Exit/Entry Levels:
The indicator calculates and displays potential take profit (TP), exit, and entry levels based on market structure and volatility. These levels are marked on the chart, offering traders guidance on optimal points for trade management. This feature can be particularly helpful for setting profit targets and managing risk.
🔹 Dashboard:
The customizable dashboard provides a quick overview of key market metrics. It displays information such as trend strength, volume analysis, market volatility, the current state of the Trend Catcher and the market is "Bearish" or "Bullish". This at-a-glance summary helps traders make informed decisions without the need to switch between multiple indicators.
Customizable Settings :
Toggle: Option to display or hide the dashboard.
Dashboard Position and Size: Selectable between "Top Right", "Bottom Right", and "Bottom Left". Adjustable size to "Tiny", "Small" or "Normal".
🔶 Disclaimer:
Use with Caution: This indicator is provided for educational and informational purposes only and should not be considered as financial advice. Users should exercise caution and perform their own analysis before making trading decisions based on the indicator's signals.
Not Financial Advice: The information provided by this indicator does not constitute financial advice, and the creator (UAlgo) shall not be held responsible for any trading losses incurred as a result of using this indicator.
Backtesting Recommended: Traders are encouraged to backtest the indicator thoroughly on historical data before using it in live trading to assess its performance and suitability for their trading strategies.
Risk Management: Trading involves inherent risks, and users should implement proper risk management strategies, including but not limited to stop-loss orders and position sizing, to mitigate potential losses.
No Guarantees: The accuracy and reliability of the indicator's signals cannot be guaranteed, as they are based on historical price data and past performance may not be indicative of future results.
RSI Trail [UAlgo]The RSI Trail indicator is a technical analysis tool designed to assist traders in making informed decisions by utilizing the Relative Strength Index (RSI) and various moving average calculations. This indicator dynamically plots support and resistance levels based on RSI values, providing visual cues for potential bullish and bearish signals. The inclusion of a trailing stop mechanism allows traders to adapt to market volatility, ensuring optimal entry and exit points.
🔶 Key Features
Multiple Moving Average Types: Choose from Simple Moving Average (SMA), Exponential Moving Average (EMA), Weighted Moving Average (WMA), Running Moving Average (RMA), and McGinley Dynamic for diverse analytical approaches.
Configurable RSI Bounds: Tailor the RSI lower and upper bounds to your specific trading preferences, with default settings at 40 and 60.
Signals: The indicator determines bullish and bearish market states and plots corresponding signals on the chart.
Customizable Visualization: Options to display the midline and color candles based on market state enhance visual analysis.
Alerts: Integrated alert conditions notify you of bullish and bearish signals.
🔶 Calculations
The RSI Trail indicator calculates dynamic support and resistance levels using a combination of moving averages and the Relative Strength Index (RSI). It starts by computing a chosen moving average (SMA, EMA, WMA, RMA, or McGinley) over a period of 27 using the typical price (ohlc4).
The indicator then defines upper and lower bounds based on customizable RSI levels (default 40 and 60) and adjusts these bounds using the Average True Range (ATR) to account for market volatility. The upper bound is calculated by adding a volatility-adjusted value to the moving average, while the lower bound is found by subtracting this value. Bullish signals occur when the price crosses above the upper bound, and bearish signals when it falls below the lower bound.
The RSI Trail indicator also can be used to identify pullback opportunities. When the price high/low crosses above/below the calculated upper/lower bound, it indicates a potential pullback, suggesting a favorable point to enter a trade during a pullback.
🔶 Disclaimer
This indicator is for informational purposes only and should not be considered financial advice.
Always conduct your own research and due diligence before making any trading decisions. Past performance is not necessarily indicative of future results.

[INVX] Trailing StopDescription:
The Adjustable Trailing Stop Indicator is a practical tool designed to enhance your trading strategy by allowing for automatic modifications of stop-loss orders according to your specified parameters. This indicator provides a dynamic alternative to the traditional static stop-loss orders, assisting in managing your potential profits and curbing possible losses.
Features and Functionality:
The Trailing Stop Indicator provides three main inputs for customization:
"Trailing Stop Start Date" : This input enables you to set the start date for the trailing stop. From this date forward, the indicator begins tracking price changes and adjusts the stop-loss order in response.
"Trigger Delta (%)" : This represents the percentage for the trailing stop. It denotes the set percentage at which the stop order adjusts.
"Order" : This input determines whether the trailing stop applies to a Buy or Sell order. Depending on the selection, the indicator adjusts the stop price as the price escalates (for Sell order) or declines (for Buy order).
How Does the Trailing Stop Indicator Work?
The Trailing Stop Indicator functions by dynamically adjusting the stop price in line with market fluctuations. If the market price rises (for Sell order), the stop price automatically ascends, securing potential profits. In a declining market (for Buy order), the stop price descends according to the market.
This indicator eliminates the need for constant manual adjustments, reducing the impact of emotional trading and helping traders maintain their risk management strategy. By using this tool, traders can implement a more disciplined and systematic approach to trading.

[Support and Resistance with Trend Lines] with Backtest (TSO) with Backtest (TSO)
===========================================================================
===========================================================================
This indicator serves as a comprehensive full-cycle trading system, providing alerts at each stage of the trade, from opening to closure. The algorithm uses most recent and historical S&R (Support and Resistance) levels with most recent and historical Trend Lines, generating signals for trades when Breaks/Bounces occur (Trade Open Signal triggers can be configured via very customizable indicator Input "Signal Trigger Matrix" settings). With signal for trade open, TP (Take Profit and SL (Stop Loss) levels are calculated as well and marked on the chart including alerts for each action of the trade. The indicator offers a variety of automated approaches for TP (Take-Profit) and SL (Stop-Loss) settings. These include static current/historical S&R (Support and Resistance) levels or S&R/Trend Lines dynamic breaks for TP (Take-Profit) and various SL (Stop-Loss) approaches, including ATR Trailing SL, opposite S&R (Support and Resistance) levels SL, opposite Trend Lines SL and more. This diverse set of tools ensure flexibility in tailoring TP (Take-Profit) and SL (Stop-Loss) parameters to different market conditions, contributing to a more adaptive and robust trading system. Additionally, a series of signal analysis tools, including market sentiment, candle bar analysis, divergence, and volume, enhance the precision of trading signals.
* Works with popular timeframes: 1M, 3M, 5M, 15M, 30M, 45M, 1H.
* Works well with Futures and Indices, can be used to trade Stocks, Crypto and FOREX.
* Includes LIVE alert/labels Breakouts and Bounces signal trigger feature, which can be used for scalping (NOTE: This approach cannot be backtested).
* Every action of the trade is calculated on a confirmed closed candle bar state (barstate.isconfirmed), so the indicator will never repaint.
==============================================================
Indicator examples:
---------------------------------------------------------------------------
Strategy Config: SRTL_MES_15M3Y_EODoff_ALL
Here is a nice example of MES (Micro E-Mini S&P 500 Index Futures) configuration, which uses S&R (Support and Resistance) breakouts as signal trigger with Elliot Wave confirmation and previous S&R historical levels for TP (Take-Profit).
---------------------------------------------------------------------------
An example of an intraday Tesla trade. Also the green arrows will be displayed IMMEDIATELY when Breakout/Reverse Bounce occurs (same an Alert will be triggered immediately).
===========================================================================
Trading open/close/TP/SL labels, plots and colors explanations:
---------------------------------------------------------------------------
>>> S&R (Support and Resistance) levels/lines: orange - support, blue - resistance (can be hidden).
>>> Trend Lines: yellow - support, green - resistance (can be hidden).
>>> Blue labels show resistance breakouts and bounces, light-blue - bullish, dark-blue - bearish
>>> Yellow labels show resistance breakouts and bounces, light-yellow - bullish, dark-yellow - bearish
>>> Green/Red arrows on top/bottom of candle bar will show LIVE breakouts (if turned on)
>>>>> LONG open: green "house" looking arrow below candle bar.
>>>>> SHORT open: red "house" looking arrow above candle bar.
>>>>> LONG/SHORT take-profit target: green/red circles (multi-profit > TP2/3/4/5 smaller circles).
>>>>> LONG/SHORT stop-loss target: green/red + crosses.
>>>>> LONG/SHORT take-profit hits: green/red diamonds.
>>>>> LONG/SHORT stop-loss hits: green/red X-crosses.
>>>>> LONG/SHORT EOD (End of Day | Intraday style) close (profitable trade): green/red squares.
>>>>> LONG/SHORT EOD (End of Day | Intraday style) close (loss trade): green/red PLUS(+)-crosses.
===========================================================================
STATS TABLE ///////////////////////////////////////////////////////////////
---------------------------------------------------------------------------
>>> Trading STATS table on the chart showing current trade direction, Last TP (Take-Profit) Taken, Current Trade PL (profit/loss in price difference from trade open to the very current state).
---------------------------------------------------------------------------
CUSTOM TRADING DATE RANGE /////////////////////////////////////////////////
---------------------------------------------------------------------------
>>>>> This feature can be used to manually set indicator trading range from and to a specific date and time. NOTE: This is not intended for a very long date range backtesting, utilize TradingView Strategy Tester for that.
* Use TradingView “Strategy Tester” to see Backtesting results
NOTE: If Strategy Tester does not show any results with Date Ranged fully unchecked, there may be an issue where a script opens a trade, but there is not enough TradingView power to set the Take-Profit and Stop-Loss and somehow an open trade gets stuck and never closes, so there are “no trades present”. In such case - manually check “Start”/“End” dates or use “Deep Backtesting” feature!
---------------------------------------------------------------------------
INTRADAY ACTIVE TRADING SESSION CONFIGURATION /////////////////////////////
---------------------------------------------------------------------------
>>> Regional Active Trading Session Hours Schedule: If selected - trades will only open during regional active trading session, if 'OFF', there will be no trading schedule and trades will open 24/7.
>>> EOD(End of Day) Close - On/Off: Close the trade if it's still open at the end of active trading session (on the very last candle bar). NOTE: If no region is selected at 'Regional Active Trading Session Schedule' - there will be no EOD(End of Day) Close and trades will run overnight until either SL(Stop-Loss) or TP(Take-Profit) is hit!
>>>>> EOD(End of Day) Close - 1 candle bar before last: This is specifically for stocks as while usually indices can be closed 15minutes after the market closes, for stocks - the last candle bar closes at the same time with the market active trading session, which if closed - trades can't be closed until next day/session! Enable this setting for the trade to close/alert 1 candle bar before the last one, so there is still time to close the trade at the Broker (NOTE: depending on the timeframe, 1 candle bar can be: 15sec, 30sec, 1min, 3min, 5min, 15min, 30min, 45min, 1h).
---------------------------------------------------------------------------
SIGNAL TRIGGER MATRIX ////////////////////////////////////////////////
---------------------------------------------------------------------------
>>> Trading Engine: This setting turns on TradingView Strategy trading engine for backtesting.
>>> Market Session Only: With this setting turned on, all signal trigger Breaks/Bounces will be hidden during Pre/Post market time.
>>> Plot S&R Levels/Lines: Plot S&R (Support and Resistance) on chart. Note: historical levels/lines will only be plotted if hit (Break/Bounce).
>>> Plot Trend Lines Levels/Lines: Plot Trend Lines levels/lines on chart. Note: historical levels/lines will only be plotted if hit (Break/Bounce).
>>> Use S&R Current Levels | Use S&R Historical Levels | Use Trend Lines Current Levels | Use Trend Lines Historical Levels |: Choose which levels should be used for Breaks/Bounces to be captured on. If all triggers are turned on/checked - whatever happens 1st wins the trigger.
>>> Breaks | Bounces: 'Breaks': Turn on Breaks through levels/lines signal trigger. | 'Bounces': Turn on Bounces off levels/lines signal trigger.
>>> Signal: Regular | Signal: S&R Combo | Signal: TL Combo | Signal: S&R + TL Combo | Signal: Repeat Action |: Trade open signal trigger execution approach MATRIX (If 1 or more turned on at the same time - whatever comes first will be the trade signal trigger). 'Regular': A single Break/Bounce must occur on a closed bar for signal trigger. 'S&R Combo': A combination of 2 Current + Historical S&R (Support and Resistance) Break/Bounce must happen in the same direction on same bar for signal trigger. 'TL Combo': A combination of 2 Current + Historical Trend Lines Break/Bounce must happen in the same direction on same bar for signal trigger. 'S&R + TL Combo': a combination of ANY S&R and Trend Line Break/Bounce must happen in the same direction on same bar for signal trigger. 'Repeat Action': Initial and then confirmation (2nd/3rd/etc. consecutive occurence) Break/Bounce must occur on same level/line for signal trigger.
>>> Historical - Look Back (# of days): How far back (in # of days) will historical S&R/Trend Lines will be used for Trade Open signals/TP/SL/etc.
>>> Historical - Look Back Invalidation (# of days): IF THERE IS TOO MUCH HISTORICAL LEVELS/LINES ON CHART - LOWER THIS SETTING + MAKE SURE IT'S SMALLER THAN 'Historical - Look Back (# of days)'. With big Look back period (5+ days) - it can become very messy with too many historical levels/lines. To clear oldest historical levels/lines - set Look Back Invalidation # of days to less than Historical Look Back # of days. (After X # of Look Back Invalidation days - older levels/lines will become invalidated and no longer used for opening trades/TP (Take-Profit)/SL (Stop-Loss), while newer levels/lines will still be discovered.
>>> S&R/Trend Lines - Support/Resistance combined into 1 entity: Every level or a line becomes simply a level or a line, regardless if it originally was a support or resistance. By default, depending on the level/line originally being support or resistance - the signal direction will be such as: Resistance is broken > LONG / bounced > SHORT; Support is broken > SHORT / bounced > LONG; with this setting on, either level or line can be both broken or bounced off in ANY direction, trade open direction will depend on current market sentiment only.
---------------------------------------------------------------------------
S&R CONFIGURATION ////////////////////////////////////////////////
---------------------------------------------------------------------------
>>> S&R Search - Left Bars (current): This setting is for calculating optimal S&R (Support and Resistance) levels (in combination with below - Right Bars).
>>> S&R Search - Right Bars (current): This setting is for calculating optimal S&R (Support and Resistance) levels (in combination with above - Left Bars).
>>> S&R Search - Custom Resolution (current): This is a custom timeframe setting specifically for S&R Search, it disregards current chart timeframe. This is great to use for scalping, for example: with main chart set to 1min and the custom timeframe set to 3min or 5min - there will be stronger support/resistance levels with more detailed price action.
>>> S&R Search - Left Bars (historical): This setting is for calculating optimal S&R (Support and Resistance) levels (in combination with below - Right Bars).
>>> S&R Search - Right Bars (historical): This setting is for calculating optimal S&R (Support and Resistance) levels (in combination with above - Left Bars).
>>> S&R Search - Custom Resolution (historical): This is a custom timeframe setting specifically for S&R Search, it disregards current chart timeframe. This is great to use for scalping, for example: with main chart set to 1min and the custom timeframe set to 3min or 5min - there will be stronger support/resistance levels with more detailed price action.
>>> S&R - Historical S&R Levels - Extend to the right: Extend all S&R lines to the right.
>>> S&R (Current/Historical) - Live Breakout/Bounce - ALERT/SHOW: NOTE: Alert wlil trigger immediately at price Breaking thru or Bouncing off level/line and an arrow above /below the bar will show the direction of breakout/bounce. If on that same live bar - price comes back causing the Breakout/Bounce become no longer valid - the arrow will disappear as the condition of the Break/Bounce will no longer be valid.
---------------------------------------------------------------------------
TREND LINES CONFIGURATION ////////////////////////////////////////////////
---------------------------------------------------------------------------
>>> Show: Trend Line development (where it 'did not exist' yet): It takes 2 pivots to develop a trend line, pivot is established at least 3 candle bars later from where the pivot is. With this setting turned on - it will plot dashed lines where trend lines originated connecting the 1st and 2nd pivot point up to where the trend line became established (where in reality you would now be able to draw a certain trend line). Established already generated trend line are plotted with a solid line.
>>> Trend Lines - Line Slope Confirmation: LONG breakout will only be shown if trend line is goind downslope \. SHORT breakout will only be shown if trend line is goind upslope /.
>>> Trend Lines - Search - Left Bars (current): This setting is for calculating optimal Trend Lines.
>>> Trend Lines - Search - Right Bars (current): This setting is for calculating optimal Trend Lines.
>>> Trend Lines - Custom Resolution (current): This is a custom timeframe setting specifically for S&R Search, it disregards current chart timeframe. This is great to use for scalping, for example: with main chart set to 1min and the custom timeframe set to 3min or 5min - there will be stronger support/resistance levels with more detailed price action.
>>> Trend Lines - Search - Left Bars (historical): This setting is for calculating optimal Trend Lines.
>>> Trend Lines - Search - Right Bars (historical): This setting is for calculating optimal Trend Lines.
>>> Trend Lines - Custom Resolution (historical): This is a custom timeframe setting specifically for S&R Search, it disregards current chart timeframe. This is great to use for scalping, for example: with main chart set to 1min and the custom timeframe set to 3min or 5min - there will be stronger support/resistance levels with more detailed price action.
>>> Trend Lines - Historical Trend Lines - Extend to the right: Extend all Trend Lines to the right.
>>> Trend Lines (Current/Historical) - Live Breakout/Bounce - ALERT/SHOW: NOTE: Alert will trigger immediately at price Breaking thru or Bouncing off level/line and an arrow above /below the bar will show the direction of breakout/bounce. If on that same live bar - price comes back causing the Breakout/Bounce become no longer valid - the arrow will disappear as the condition of the Break/Bounce will no longer be valid.
---------------------------------------------------------------------------
TAKE-PROFIT/STOP-LOSS CONFIGURATION ///////////////////////////////////////
---------------------------------------------------------------------------
>>> TP (Take-Profit) System: 'S&R Static Current/Historical': TP (Take-Profit) is calculated using current/historical S&R (Support & Resistance) levels at trade open and remains static. 'S&R/Trend Lines Dynamic Breaks': TP (Take-Profit) is fully dynamic and will be trigger at price above trade open price and with Breakout occurence (S&R or Trend Line current/historical breakout).
>>> TP (Take-Profit) # of targets: It is wise to divide the trade into several profit targets. With this setting - up to 5 TP (Take-Profit) targets can be approached. The trade will be equally divided up by the selected # of TP (Take-Profit) targets.
>>> SL (Stop-Loss) System: 'ATR-Trailing-SL': SL (Stop-Loss) is trail-following the ATR (Average True Range) line, NOTE: If at signal trigger, ATR will be against the trade direction - trade open signal will be skipped; 'S&R-Static-SL': SL (Stop-Loss) is set at trade open per optimal most recent S&R level and remains there until trade closes; 'TrendLines-Static-SL': SL (Stop-Loss) is set at trade open per optimal most recent trend line and remains there until trade closes; 'TrendLines-Dynamic-SL': SL (Stop-Loss) will be set per current opposite trend line and follow it until trade is open.; 'Oppos-Sig-Trd-in-Loss': SL (Stop-Loss) will trigger at opposite signal with trade currently at loss.
>>> SL (Stop-Loss) - On/Off: Without SL (Stop-Loss), unless EOD (End of Day) Close is turned on - there will be no SL (Stop-Loss) at all!
---------------------------------------------------------------------------
MARKET SENTIMENT CONFIRMATION ///////////////////////////////////////
---------------------------------------------------------------------------
>>> Market Sentiment: Signal is confirmed per Market Sentiment direction. If Market Sentiment is turned off - whatever signal comes 1st will be the trade open trigger.
---------------------------------------------------------------------------
SIGNAL ANALYSIS AND CLEANUP ///////////////////////////////////////////////
---------------------------------------------------------------------------
>>> Signal Cleanup - Bar Color: Include Bar Color (bullish/bearish) confirmation, LONG signal will only be opened if signal bar is green/bullish, SHORT if red/bearish.
>>> Signal Cleanup - Bar Directional Structure: Skip opposite bar structure types signals (For example: bearish green hammer).
>>> Signal Cleanup - Bar Doji Skip: Skip doji (indecisive) candles signals.
>>> Signal Cleanup - EWO (Elliott Wave Oscillator): Include EWO (Elliott Wave Oscillator), LONG will only be opened if EWO is bullish / SHORT if EWO is bearish.
>>> Signal Cleanup - VWAP (Volume-Weighted Average Price): Include VWAP (Volume-Weighted Average Price), LONG will only be opened if price is above VWAP / SHORT if price is below VWAP.
>>> Signal Cleanup - MA (Moving Average) Confirmation: Include MA (Moving Average), LONG will only be opened if MA is bullish / SHORT if MA is bearish.
>>> Signal Cleanup - ATR (Average True Range): Include ATR (Average True Range) confirmation, LONG will only be opened if ATR is bullish / SHORT if ATR is bearish.
>>> Signal Cleanup - Divergence(RSI + MACD): Include Divergence (RSI + MACD ) confirmation, LONG will only be opened if Divergence is bullish / SHORT if Divergence is bearish.
>>> Signal Cleanup - Volume % Strength: Include Volume strength/percentage confirmation, LONG/SHORT will only be opened with strong Volume matching the signal direction | By default, strong Volume percentage is set to 150% and weak to 50%.
>>> Signal Cleanup - Volume Above Average: Include Volume Above Moving Average (Volume closing bar closes above volume moving average) confirmation, LONG/SHORT will only be opened with Volume above average - Volume closed bar color must match the closed price color (bullish/bearish direction) + Volume bar must be closed above volume MA line).
---------------------------------------------------------------------------
===========================================================================
||||||||||||||||||||||||||||||||||| *** ||||||||||||||||||||||||||||||||||| *** |||||||||||||||||||||||||||||||||||
||||||||||||||||||||||||||||||||||| *** ||||||||||||||||||||||||||||||||||| *** |||||||||||||||||||||||||||||||||||
TP System - VERY IMPORTANT INFO!
-------------------------------------------------------------------------------------------------------------------
"TP PERCENTAGE" - amount by which current trade/position needs to be reduced/partially closed/sold.
-------------------------------------------------------------------------------------------------------------------
TP System: Dynamic
"TP PERCENTAGE" - will always be the same amount (trade/position size divided by the # of take-profit(TP) targets) and percentage to be closed will always be of the ORIGINAL trade/position.
-------------------------------------------------------------------------------------------------------------------
TP System: Static
"TP PERCENTAGE" - will always be the same amount IF take-profit(TP) targets are hit 1-by-1 (TP1 > TP2 > TP3 > TP4 > TP5), otherwise it will vary and unless it is a 1st take-profit(TP1), the REMAINING trade/position size will always be smaller than original and therefore the percentage to be closed will always be of the REMAINING trade/position and NOT the original one!
-------------------------------------------------------------------------------------------------------------------
"TP PERCENTAGE" CheatSheet (these are the only percentages you may see)
-----------------------------------------------------------------------
TP PERCENTAGE---Close/Sell Amount-------------Example (trade size: 50 stocks)
20%-------------trade size * 0.2--------------50 * 0.2 = 10 stocks
25%-------------trade size * 0.25-------------50 * 0.25 = 12.5(~13) stocks
34%-------------trade size * 0.34-------------50 * 0.34 = 17 stocks
40%-------------trade size * 0.4--------------50 * 0.4 = 20 stocks
50%-------------trade size * 0.5--------------50 * 0.5 = 25 stocks
60%-------------trade size * 0.6--------------50 * 0.6 = 30 stocks
66%-------------trade size * 0.66-------------50 * 0.66 = 33 stocks
75%-------------trade size * 0.75-------------50 * 0.75 = 37.5(~38) stocks
80%-------------trade size * 0.8--------------50 * 0.8 = 40 stocks
100%------------trade size--------------------50 = 50 stocks
-----------------------------------------------------------------------
If for any reason a portion of the current/remaining trade closed at such occurrence was slightly wrong, it is not an issue. Such occurrences are rare and with slight difference in partial TP closed is not significant to overall performance of our algorithms.
||||||||||||||||||||||||||||||||||| *** ||||||||||||||||||||||||||||||||||| *** |||||||||||||||||||||||||||||||||||
||||||||||||||||||||||||||||||||||| *** ||||||||||||||||||||||||||||||||||| *** |||||||||||||||||||||||||||||||||||
===========================================================================
Alert Settings (you don’t have to touch this section unless you will be using TradingView alerts through a Webhook to use with trading bot)
---------------------------------------------------------------------------
Here is how a LONG OPEN alert looks like.
NOTE: Each label , , etc. is customizable, you can change the text of it within indicator Input settings.
ALERT >>>>>>>>>>>>>>>>>>>>>>>>>>>>>>>>>>>>>>>>>>>>>>>
COIN: BTCUSD
TIMEFRAME: 15M
LONG: OPEN
ENTRY: 20000
TP1: 20500
TP2: 21000
TP3: 21500
TP4: 22500
TP5: 23500
SL: 19000
Leverage: 0
---------------------------------------------------------------------------
Here is how a TP1 alert will look with 5 TPs breakdown of the trade.
NOTE1: Next to TP1 taken it will show at which price it was triggered.
NOTE2: Next to "TP Percentage" it shows how much of the CURRENT/ACTIVE/REMAINING trade needs to be closed.
NOTE2: If TP2/3/4/5 comes before TP1 - the alert will tell you exactly how many percent of the trade needs to be closed!
ALERT >>>>>>>>>>>>>>>>>>>>>>>>>>>>>>>>>>>>>>>>>>>>>>>
COIN: BTCUSD
TIMEFRAME: 15M
LONG: TP1
TP1: 20500
TP Percentage: 20%
---------------------------------------------------------------------------
Here is how an alert will look for LONG - STOP-LOSS.
ALERT >>>>>>>>>>>>>>>>>>>>>>>>>>>>>>>>>>>>>>>>>>>>>>>
COIN: BTCUSD
TIMEFRAME: 15M
ENTRY: 20000
LONG: SL
SL: 19000
---------------------------------------------------------------------------
Here is how an alert will look for LONG - EOD (End of Day) In Profit close.
ALERT >>>>>>>>>>>>>>>>>>>>>>>>>>>>>>>>>>>>>>>>>>>>>>>
COIN: BTCUSD
TIMEFRAME: 15M
LONG: EOD-Close (profit)
ENTRY: 20000
EOD-Close: 21900
===========================================================================
Adding Alerts in TradngView
---------------------------------------------------------------------------
-Add indicator to chart and make sure the correct strategy is configured (check Backtesting results)
-Right-click anywhere on the TradingView chart
-Click on Add alert
-Condition: Select this indicator by it’s name
-Immediately below, change it to "alert() function calls only", as other wise there will be 2 alerts for every alert!
-Expiration: Open-ended (that may require higher tier TradingView account, otherwise the alert will need to be occasionally re-triggered)
-Alert name: Whatever you desire
-Hit “Create”
-Note: If you change ANY Settings within the indicator – you must DELETE the current alert and create a new one per steps above, otherwise it will continue triggering alerts per old Settings!
===========================================================================
Good Luck! (NOTE: Trading is very risky, past performance is not necessarily indicative of future results, so please trade responsibly!)
---------------------------------------------------------------------------
NOTE: There seems to be a strange glitch when strategy is running live, it will show "double-take" take-profits labels on the chart. This is not affecting the script logic and backtesting results, if you simply change the timeframe real quick to something else then back - it will no longer show the duplicate orders... this must be some sort of a glitch as every alert was thoroughly tested to make sure everything is working!

FVG Positioning Average [LuxAlgo]The FVG Positioning Average indicator aims to uncover potential price levels of interest by averaging together recent Fair Value Gap (FVG) initiation levels.
This indicator is grounded in the theory that significant buying or selling activity is the primary catalyst for creating FVGs.
By averaging together the prices where each FVG initiated, we may potentially reveal where major participants are positioned.
🔶 USAGE
By analyzing the average price of bullish or bearish FVGs, users can identify potential support or resistance areas where the larger participants may re-enter or defend their positions.
These areas could be used to adjust entries and exits or assist with risk management such as take-profit or stop-loss levels.
The indicator displays 2 lines, the Bull Average and the Bear Average.
The Bull Average is only displayed when the price holds above the bull Average.
The Bear Average is only displayed when the price holds below the bear average.
When only one average is displayed alone, this level is seen as support or resistance, it is anticipated that this level would be defended for the current trend to stay valid.
When both averages are displayed simultaneously, it can be interpreted as one side attempting to take over the trend.
The movements and reactions during these attempts can be analyzed to provide helpful information about where the price might be headed.
Possible outcomes:
Trend Confirmation/Re-Entry (From Weak Attempts)
Trend Reversal (Creating Support or Resistance)
Consolidation (Oscillating between/around Bull & Bear Averages)
🔶 DETAILS
🔹 Lookback Types
This indicator includes 2 lookback types:
Bar Count: Uses Bars to determine what data to include. This type can be utilized for averages that are more locally relevant to the current chart data.
FVG Count: Uses a specific # of FVGs for calculations. This type can be utilized for a continuous & consistent view, typically relevant with longer term analysis.
Note: When using bar lookback, if no data is in range, no lines will be displayed.
Below is an example of the 'FVG Count' Display.
🔹 Initiation Levels
Initiation Levels are the specific price points where each FVG starts, these are the last points the price was traded at before creating the gap.
Bull Initiation Level: Lowest Point (Bottom) of FVG
Bear Initiation Level: Highest Point (Top) of FVG
🔹 FVG Display
Each FVG being used for the current calculation of averages is displayed on the chart for reference.
Note: If you prefer to not display the FVGs, they can be toggled off in the settings, uncheck "Show FVGs on Chart".
🔶 Settings
FVG Lookback: As mentioned above in the 'Lookback Types', this sets the number of FVGs or Bars to use for consideration.
Lookback Type: As also mentioned above in 'Lookback Types', this determines the method of lookback to be used.
ATR Multiplier: The FVGs are required to have a Greater Width than (ATR * Multiplier) in order to be used for calculations. This allows you to focus on the data being considered if needed.

Trade Scanner Pro [MarketSignalsPro]
█ OVERVIEW
Trade Scanner Pro is a trade signal generator based on my trend following momentum reversal system. It identifies a pullback and then confirms momentum exhaustion which produces a signal appearing as a set of suggested orders (horizontal lines) on the chart. The goal is to help traders capitalize on price momentum while simplifying decision making and offering a way to gauge expectations. It can be used for any market, any time frame and configured for counter trend signals also.
█ CONCEPT
While markets are highly random, especially on smaller time frames, trends do exist.
Trade Scanner Pro offers a visually structured way to align the user
with price momentum that is relevant to the trend. It accomplishes this by incorporating a unique mix of standard technical formulas to identify a pullback followed by a momentum reversal. The process occurs in 3 steps:
1 — Identifying the trend of the current time frame.
2 — Evaluating the retrace in terms of how far it moves away from the typical price.
3 — Confirming price exhaustion by recognizing a reversal in price momentum.
Once the criteria are met, a signal appears as a blue horizontal line. This is the entry price suggestion (see label). Stop and take profit orders are also calculated simultaneously. These appear as a red line and green line respectively with price labels. The stop and take profit orders are based upon an average of previous price ranges and will be relative to the price action on the chosen time frame. The initial reward/risk ratio is set to 1.5:1, and can be changed in the settings menu.
This system can also be adjusted to cater to the experience level of the trader. For example, more advanced traders can select “counter trend” mode which will only show signals on the opposite side of the trend. A trailing stop can be activated to help stay in a trade after reaching the profit level. There is also a “heads up” mode which colors the candles orange which means a signal is more likely to appear over the next couple of candles. More on these features in the next section.
For best results, time frames of 1 minute and above should be considered. The smaller the time frame, the more signals, but also more noise and stop outs. Knowing your
market and the most active time of day is especially important for smaller time frames.
█ FEATURES
The following features can be found in the settings menu of Trade Scanner Pro.
Show Trend:
The initial setting is “on”. This shows the trend label on the upper right corner of the screen. Trend can be either bullish or bearish. At times there will be a “conflict” label that appears below the trend label. Conflict means the trend MAY be in the process of changing. This occurs when price persists against the prevailing trend for a prolonged amount of time.
Counter Trend:
When selected will ignore signals on the side of the trend and show counter trend signals only. If the “heads up” feature is selected, orange candles will only appear for potential counter trend signals.
Trailing Stop:
When selected, a trailing stop order suggestion (orange line) will appear beginning from the stop loss price (red line) after a few closed candles. The trailing stop line will follow the price upon each new close of the candles until it is touched. This serves as a point of reference to capture larger market movements and skew reward/risk favorably over time.
Heads Up:
When selected will paint orange candles when there is a greater chance a signal will appear. For example, in trend mode it will only evaluate signals on the side of the trend. In counter trend mode it will evaluate counter trend signals only. For advanced users, this “pre signal” can offer potential opportunities to enter a trade before the signal appears.
Reward Ratio:
This is the reward part of the reward/risk formula used to establish the take profit suggestion on the chart. Initially it is set at 1.5 which produces a line on the chart at a 1.5:1 ratio. The user can change this setting to better align with their expectations. For example, if a larger market movement is anticipated, 2 can be entered into the input field and will generate a take profit line 2X farther than the stop loss line (2:1 reward/risk).
█ LIMITATIONS
Markets are HIGHLY random, especially on smaller time frames. No system that is based on public domain formulas can be expected to be HIGHLY accurate. It is reasonable to expect a 50% win rate more often than not. Profitability in such systems depends on the reward/risk rather than win rate.
This is a system based on price momentum which means MOMENTUM must be present for best results especially on very short time frames.
While this system helps to reduce the burden of analysis, the user should have some basic familiarity with technical analysis. Basic knowledge can help to better determine a quality signal over noise.
█ RAMBLINGS
The stop loss orders MUST be respected otherwise the user puts their entire account at risk. Signals can appear at price locations where larger magnitude risk is extremely high. Respecting the stop loss suggestions can help to mitigate this risk.
For best results set up notifications to receive a message on your desktop, smart phone or tablet rather than sitting in front of a computer screen waiting for a signal to appear. Keep in mind a 1 minute chart in a single market can produce 5 or 6 signals throughout the entire daily session and NOT all will be profitable. A 1 hour time frame may produce 1 or 2 throughout the day. The larger the time frame the lower frequency of signals.
█ THANKS
Special thanks to Cryptosnagger for
helping me translate my concept into a pine script reality.
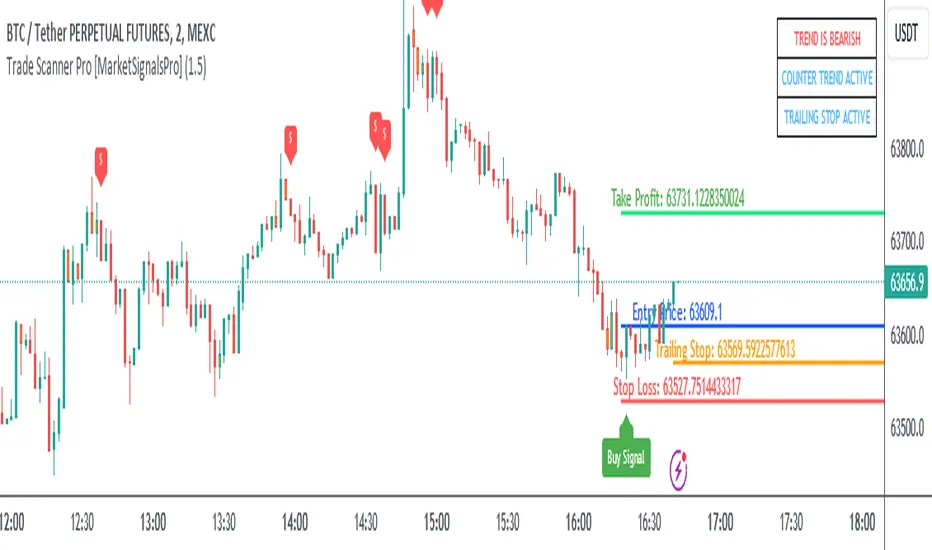
Trailing Management (Zeiierman)█ Overview
The Trailing Management (Zeiierman) indicator is designed for traders who seek an automated and dynamic approach to managing trailing stops. It helps traders make systematic decisions regarding when to enter and exit trades based on the calculated risk-reward ratio. By providing a clear visual representation of trailing stop levels and risk-reward metrics, the indicator is an essential tool for both novice and experienced traders aiming to enhance their trading discipline.
The Trailing Management (Zeiierman) indicator integrates a Break-Even Curve feature to enhance its utility in trailing stop management and risk-reward optimization. The Break-Even Curve illuminates the precise point at which a trade neither gains nor loses value, offering clarity on the risk-reward landscape. Furthermore, this precise point is calculated based on the required win rate and the risk/reward ratio. This calculation aids traders in understanding the type of strategy they need to employ at any given time to be profitable. In other words, traders can, at any given point, assess the kind of strategy they need to utilize to make money, depending on the price's position within the risk/reward box.
█ How It Works
The indicator operates by computing the highest high and the lowest low over a user-defined period and then applying this information to determine optimal trailing stop levels for both long and short positions.
Directional Bias:
It establishes the direction of the market trend by comparing the index of the highest high and the lowest low within the lookback period.
Bullish
Bearish
Trailing Stop Adjustment:
The trailing stops are adjusted using one of three methods: an automatic calculation based on the median of recent peak differences, pivot points, or a fixed percentage defined by the user.
The Break-Even Curve:
The Break-Even Curve, along with the risk/reward ratio, is determined through the trailing method. This approach utilizes the current closing price as a hypothetical entry point for trades. All calculations, including those for the curve, are based on this current closing price, ensuring real-time accuracy and relevance. As market conditions fluctuate, the curve dynamically adjusts, offering traders a visual benchmark that signifies the break-even point. This real-time adjustment provides traders with an invaluable tool, allowing them to visually track how shifts in the market could impact the point at which their trades neither gain nor lose value.
Example:
Let's say the price is at the midpoint of the risk/reward box; this means that the risk/reward ratio should be 1:1, and the minimum win rate is 50% to break even.
In this example, we can see that the price is near the stop-loss level. If you are about to take a trade in this area and would respect your stop, you only need to have a minimum win rate of 11% to earn money, given the risk/reward ratio, assuming that you hold the trade to the target.
In other words, traders can, at any given point, assess the kind of strategy they need to employ to make money based on the price's position within the risk/reward box.
█ How to Use
Market Bias:
When using the Auto Bias feature, the indicator calculates the underlying market bias and displays it as either bullish or bearish. This helps traders align their trades with the underlying market trend.
Risk Management:
By observing the plotted trailing stops and the risk-reward ratios, traders can make strategic decisions to enter or exit positions, effectively managing the risk.
Strategy selection:
The Break-Even Curve is a powerful tool for managing risk, allowing traders to visualize the relationship between their trailing stops and the market's price movements. By understanding where the break-even point lies, traders can adjust their strategies to either lock in profits or cut losses.
Based on the plotted risk/reward box and the location of the price within this box, traders can easily see the win rate required by their strategy to make money in the long run, given the risk/reward ratio.
Consider this example: The market is bullish, as indicated by the bias, and the indicator suggests looking into long trades. The price is near the top of the risk/reward box, which means entering the market right now carries a huge risk, and the potential reward is very low. To take this trade, traders must have a strategy with a win rate of at least 90%.
█ Settings
Trailing Method:
Auto: The indicator calculates the trailing stop dynamically based on market conditions.
Pivot: The trailing stop is adjusted to the highest high (long positions) or lowest low (short positions) identified within a specified lookback period. This method uses the pivotal points of the market to set the trailing stop.
Percentage: The trailing stop is set at a fixed percentage away from the peak high or low.
Trailing Size (prd):
This setting defines the lookback period for the highest high and lowest low, which affects the sensitivity of the trailing stop to price movements.
Percentage Step (perc):
If the 'Percentage' method is selected, this setting determines the fixed percentage for the trailing stop distance.
Set Bias (bias):
Allows users to set a market bias which can be Bullish, Bearish, or Auto, affecting how the trailing stop is adjusted in relation to the market trend.
-----------------
Disclaimer
The information contained in my Scripts/Indicators/Ideas/Algos/Systems does not constitute financial advice or a solicitation to buy or sell any securities of any type. I will not accept liability for any loss or damage, including without limitation any loss of profit, which may arise directly or indirectly from the use of or reliance on such information.
All investments involve risk, and the past performance of a security, industry, sector, market, financial product, trading strategy, backtest, or individual's trading does not guarantee future results or returns. Investors are fully responsible for any investment decisions they make. Such decisions should be based solely on an evaluation of their financial circumstances, investment objectives, risk tolerance, and liquidity needs.
My Scripts/Indicators/Ideas/Algos/Systems are only for educational purposes!
