Trade

🔗Blockchain Fundamentals - PUELL MULTIPLE! by Cryptorhythms🔗Blockchain Fundamentals - PUELL MULTIPLE! by Cryptorhythms
Intro
The PUELL MULTIPLE! is a way to gauge market cycles from a mining profitability / compulsory sellers' perspective. It takes total miner revenue and adjusts by its yearly moving average. Calculation = mining revenue / 365-day simple moving average of mining revenue.
(The indicator is written that way in all caps at the request of its Creator David Puell)
Still over half a dozen blockchain based indicators to come (follow me and dont miss them!)
IS THE BOTTOM IN ?
The PUELL MULTIPLE! seems to suggest it is. With an insanely accurate call history this is a long term bitcoin maximalists dream indicator. You're welcome!
Extras
As usual we took care of you with some selectable options for the MA type and length so you can experiment.
Want more information?
For a better write up that I could do, check out this thread here: medium.com
👍 Enjoying this indicator or find it useful? Please give me a like and follow! I post crypto analysis, price action strategies and free indicators regularly.
💬 Questions? Comments? Want to get access to an entire suite of proven trading indicators? Come visit us on telegram and chat, or just soak up some knowledge. We make timely posts about the market, news, and strategy everyday. Our community isn't open only to subscribers - everyone is welcome to join.
For Trialers & Chat: t.me

Great Expectations [LucF]Great Expectations helps traders answer the question: What is possible? It is a powerful question, yet exploration of the unknown always entails risk. A more complete set of questions better suited to traders could be:
What opportunity exists from any given point on a chart?
What portion of this opportunity can be realistically captured?
What risk will be incurred in trying to do so, and how long will it take?
Great Expectations is the result of an exploration of these questions. It is a trade simulator that generates visual and quantitative information to help strategy modelers visually identify and analyse areas of optimal expectation on charts, whether they are designing automated or discretionary strategies.
WARNING: Great Expectations is NOT an indicator that helps determine the current state of a market. It works by looking at points in the past from which the future is already known. It uses one definition of repainting extensively (i.e. it goes back in the past to print information that could not have been know at the time). Repainting understood that way is in fact almost all the indicator does! —albeit for what I hope is a noble cause. The indicator is of no use whatsoever in analyzing markets in real-time. If you do not understand what it does, please stay away!
This is an indicator—not a strategy that uses TradingView’s backtesting engine. It works by simulating trades, not unlike a backtest, but with the crucial difference that it assumes a trade (either long or short) is entered on all bars in the historic sample. It walks forward from each bar and determines possible outcomes, gathering individual trade statistics that in turn generate precious global statistics from all outcomes tested on the chart.
Great Expectations provides numbers summarizing trade results on all simulations run from the chart. Those numbers cannot be compared to backtest-produced numbers since all non-filtered bars are examined, even if an entry was taken on the bar immediately preceding the current one, which never happens in a backtest. This peculiarity does NOT invalidate Great Expectations calculations; it just entails that results be considered under a different light. Provided they are evaluated within the indicator’s context, they can be useful—sometimes even more than backtesting results, e.g. in evaluating the impact of parameter-fitting or variations in entry, exit or filtering strats.
Traders and strategy modelers are creatures of hope often suffering from blurred vision; my hope is that Great Expectations will help them appraise the validity of their setup and strat intuitions in a realistic fashion, preventing confirmation bias from obstructing perspective—and great expectations from turning into financial great deceptions.
USE CASES
You’ve identified what looks like a promising setup on other indicators. You load Great Expectations on the chart and evaluate if its high-expectation areas match locations where your setup’s conditions occur. Unless today is your lucky day, chances are the indicator will help you realize your setup is not as promising as you had hoped.
You want to get a rough estimate of the optimal trade duration for a chart and you don’t mind using the entry and exit strategies provided with the indicator. You use the trade length readouts of the indicator.
You’re experimenting with a new stop strategy and want to know how long it will keep you in trades, on average. You integrate your stop strategy in the indicator’s code and look at the average trade length it produces and the TST ratio to evaluate its performance.
You have put together your own entry and exit criteria and are looking for a filter that will help you improve backtesting results. You visually ascertain the suitability of your filter by looking at its results on the charts with great Expectations, to see if your filter is choosing its areas correctly.
You have a strategy that shows backtested trades on your chart. Great Expectations can help you evaluate how well your strategy is benefitting from high-opportunity areas while avoiding poor expectation spots.
You want more complete statistics on your set of strategies than what backtesting will provide. You use Great Expectations, knowing that it tests all bars in the sample that correspond to your criteria, as opposed to backtesting results which are limited to a subset of all possible entries.
You want to fool your friends into thinking you’ve designed the holy grail of indicators, something that identifies optimal opportunities on any chart; you show them the P&L cloud.
FEATURES
For one trade
At any given point on the chart, assuming a trade is entered there, Great Expectations shows you information specific to that trade simulation both on the chart and in the Data Window.
The chart can display:
the P & L Cloud which shows whether the trade ended profitably or not, and by how much,
the Opportunity & Risk Cloud which the maximum opportunity and risk the simulation encountered. When superimposed over the P & L cloud, you will see what I call the managed opportunity and risk, i.e the portion of maximum opportunity that was captured and the portion of the maximum risk that was incurred,
the target and if it was reached,
a background that uses a gradient to show different levels of trade length, P&L or how frequently the target was reached during simulation.
The Data Window displays more than 40 values on individual trades and global results. For any given trade you will know:
Entry/Exit levels, including slippage impact,
It’s outcome and duration,
P/L achieved,
The fraction of the maximum opportunity/risk managed by the trade.
For all trades
After going through all the possible trades on the chart, the indicator will provide you with a rare view of all outcomes expressed with the P&L cloud, which allows us to instantly see the most/least profitable areas of a chart using trade data as support, while also showing its relationship with the opportunity/risk encountered during the simulation. The difference between the two clouds is the managed opportunity and risk.
The Data Window will present you with numbers which we will go through later. Some of them are: average stop size, P/L, win rate, % opportunity managed, trade lengths for different types of trade outcomes and the TST (Target:Stop Travel) ratio.
Let’s see Great Expectations in action… and remember to open your Data Window!
INPUTS
Trade direction : You must first choose if you wish to look at long or short trades. Because of the way the indicator works and the amount of visual information on the chart, it is only practical to look at one type of trades at a time. The default is Longs.
Maximum trade Length (MaxL) : This is the maximum walk forward distance the simulator will go in analyzing outcomes from any given point in the past. It also determines the size of the dead zone among the chart’s last bars. A red background line identifies the beginning of the dead zone for which not enough bars have elapsed to analyze outcomes for the maximum trade length defined. If an ATR-based entry stop is used, that length is added to the wait time before beginning simulations, so that the first entry starts with a clean ATR value. On a sample of around 16000 bars, my tests show that the indicator runs into server errors at lengths of around 290, i.e. having completed ~4,6M simulation loop iterations. That is way too high a length anyways; 100 will usually be amply enough to ring out all the possibilities out of a simulation, and on shorter time frames, 30 can be enough. While making it unduly small will prevent simulations of expressing the market’s potential, the less you use, the faster the indicator will run. The default is 40.
Unrealized P&L base at End of Trade (EOT) : When a simulation ends and the trade is still open, we calculate unrealized P&L from an exit order executed from either the last in-trade stop on the previous bar, or the close of the last bar. You can readily see the impact of this selection on the chart, with the P&L cloud. The default is on the close.
Display : The check box besides the title does nothing.
Show target : Shows a green line displaying the trade’s target expressed as a multiple of X, i.e. the amplitude of the entry stop. I call this value “X” and use it as a unit to express profit and loss on a trade (some call it “R”). The line is highlighted for trades where the close reached the target during the trade, whether the trade ended in profit or loss. This is also where you specify the multiple of X you wish to use in calculating targets. The multiple is used even if targets are not displayed.
Show P&L Cloud : The cloud allows traders to see right away the profitable areas of the chart. The only line printed with the cloud is the “end of trade line” (EOT). The EOT line is the only way one can see the level where a trade ended on the chart (in the Data Window you can see it as the “Exit Fill” value). The EOT level for the trade determines if the trade ended in a profit or a loss. Its value represents one of the following:
- fill from order executed at close of bar where stop is breached during trade (which produces “Realized P/L”),
- simulation of a fill pseudo-fill at the user-defined EOT level (last close or stop level) if the trade runs its course through MaxL bars without getting stopped (producing Unrealized P/L).
The EOT line and the cloud fill print in green when the trade’s outcome is profitable and in red when it is not. If the trade was closed after breaching the stop, the line appears brighter.
Show Opportunity&Risk Cloud : Displays the maximum opportunity/risk that was present during the trade, i.e. the maximum and minimum prices reached.
Background Color Scheme : Allows you to choose between 3 different color schemes for the background gradients, to accommodate different types of chart background/candles. Select “None” if you don’t want a background.
Background source : Determines what value will be used to generate the different intensities of the gradient. You can choose trade length (brighter is shorter), Trade P&L (brighter is higher) or the number of times the target was reached during simulation (brighter is higher). The default is Trade Length.
Entry strat : The check box besides the title does nothing. The default strat is All bars, meaning a trade will be simulated from all bars not excluded by the filters where a MaxL bars future exists. For fun, I’ve included a pseudo-random entry strat (an indirect way of changing the seed is to vary the starting date of the simulation).
Show Filter State : Displays areas where the combination of filters you have selected are allowing entries. Filtering occurs as per your selection(s), whether the state is displayed or not. The effect of multiple selections is additive. The filters are:
1. Bar direction: Longs will only be entered if close>open and vice versa.
2. Rising Volume: Applies to both long and shorts.
3. Rising/falling MA of the length you choose over the number of bars you choose.
4. Custom indicator: You can feed your own filtering signal through this from another indicator. It must produce a signal of 1 to allow long entries and 0 to allow shorts.
Show Entry Stops :
1. Multiple of user-defined length ATR.
2. Fixed percentage.
3. Fixed value.
All entry stops are calculated using the entry fill price as a reference. The fill price is calculated from the current bar’s open, to which slippage is added if configured. This simulates the case where the strategy issued the entry signal on the previous bar for it to be executed at the next bar’s open.
The entry stop remains active until the in-trade stop becomes the more aggressive of the two stops. From then on, the entry stop will be ignored, unless a bar close breaches the in-trade stop, in which case the stop will be reset with a new entry stop and the process repeats.
Show In-trade stops : Displays in bright red the selected in-trade stop (be sure to read the note in this section about them).
1. ATR multiple: added/subtracted from the average of the two previous bars minimum/maximum of open/close.
2. A trailing stop with a deviation expressed as a multiple of entry stop (X).
3. A fixed percentage trailing stop.
Trailing stops deviations are measured from the highest/lowest high/low reached during the trade.
Note: There is a twist with the in-trade stops. It’s that for any given bar, its in-trade stop can hold multiple values, as each successive pass of the advancing simulation loops goes over it from a different entry points. What is printed is the stop from the loop that ended on that bar, which may have nothing to do with other instances of the trade’s in-trade stop for the same bar when visited from other starting points in previous simulations. There is just no practical way to print all stop values that were used for any given bar. While the printed entry stops are the actual ones used on each bar, the in-trade stops shown are merely the last instance used among many.
Include Slippage : if checked, slippage will be added/subtracted from order price to yield the fill price. Slippage is in percentage. If you choose to include slippage in the simulations, remember to adjust it by considering the liquidity of the markets and the time frame you’ll be analyzing.
Include Fees : if checked, fees will be subtracted/added to both realized an unrealized trade profits/losses. Fees are in percentage. The default fees work well for crypto markets but will need adjusting for others—especially in Forex. Remember to modify them accordingly as they can have a major impact on results. Both fees and slippage are included to remind us of their importance, even if the global numbers produced by the indicator are not representative of a real trading scenario composed of sequential trades.
Date Range filtering : the usual. Just note that the checkbox has to be selected for date filtering to activate.
DATA WINDOW
Most of the information produced by this indicator is made available in the Data Window, which you bring up by using the icon below the Watchlist and Alerts buttons at the right of the TV UI. Here’s what’s there.
Some of the information presented in the Data Window is standard trade data; other values are not so standard; e. g. the notions of managed opportunity and risk and Target:Stop Travel ratio. The interplay between all the values provided by Great Expectations is inherently complex, even for a static set of entry/filter/exit strats. During the constant updating which the habitual process of progressive refinement in building strategies that is the lot of strategy modelers entails, another level of complexity is no doubt added to the analysis of this indicator’s values. While I don’t want to sound like Wolfram presenting A New Kind of Science , I do believe that if you are a serious strategy modeler and spend the time required to get used to using all the information this indicator makes available, you may find it useful.
Trade Information
Entry Order : This is the open of the bar where simulation starts. We suppose that an entry signal was generated at the previous bar.
Entry Fill (including slip.) : The actual entry price, including slippage. This is the base price from which other values will be calculated.
Exit Order : When a stop is breached, an exit order is executed from the close of the bar that breached the stop. While there is no “In-trade stop” value included in the Data Window (other than the End of trade Stop previously discussed), this “Exit Order” value is how we can know the level where the trade was stopped during the simulation. The “Trade Length” value will then show the bar where the stop was breached.
Exit Fill (including slip.) : When the exit order is simulated, slippage is added to the order level to create the fill.
Chart: Target : This is the target calculated at the beginning of the simulation. This value also appear on the chart in teal. It is controlled by the multiple of X defined under the “Show Target” checkbox in the Inputs.
Chart: Entry Stop : This value also appears on the chart (the red dots under points where a trade was simulated). Its value is controlled by the Entry Strat chosen in the Inputs.
X (% Fill, including Fees) and X (currency) : This is the stop’s amplitude (Entry Fill – Entry Stop) + Fees. It represents the risk incurred upon entry and will be used to express P&L. We will show R expressed in both a percentage of the Entry Fill level (this value), and currency (the next value). This value represents the risk in the risk:reward ratio and is considered to be a unit of 1 so that RR can be expressed as a single value (i.e. “2” actually meaning “1:2”).
Trade Length : If trade was stopped, it’s the number of bars elapsed until then. The trade is then considered “Closed”. If the trade ends without being stopped (there is no profit-taking strat implemented, so the stop is the only exit strat), then the trade is “Open”, the length is MaxL and it will show in orange. Otherwise the value will print in green/red to reflect if the trade is winning/losing.
P&L (X) : The P&L of the trade, expressed as a multiple of X, which takes into account fees paid at entry and exit. Given our default target setting at 2 units of “X”, a trade that closes at its target will have produced a P&L of +2.0, i.e. twice the value of X (not counting fees paid at exit ). A trade that gets stopped late 50% further that the entry stop’s level will produce a P&L of -1.5X.
P&L (currency, including Fees) : same value as above, but expressed in currency.
Target first reached at bar : If price closed above the target during the trade (even if it occurs after the trade was stopped), this will show when. This value will be used in calculating our TST ratio.
Times Stop/Target reached in sim. : Includes all occurrences during the complete simulation loop.
Opportunity (X) : The highest/lowest price reached during a simulation, i.e. the maximum opportunity encountered, whether the trade was previously stopped or not, expressed as a multiple of X.
Risk (X) : The lowest/highest price reached during a simulation, i.e. the maximum risk encountered, whether the trade was previously stopped or not, expressed as a multiple of X.
Risk:Opportunity : The greater this ratio, the greater Opportunity is, compared to Risk.
Managed Opportunity (%) : The portion of Opportunity that was captured by the highest/low stop position, even if it occurred after a previous stop closed the trade.
Managed Risk (%) : The portion of risk that was protected by the lowest/highest stop position, even if it occurred after a previous stop closed the trade. When this value is greater than 100%, it means the trade’s stop is protecting more than the maximum risk, which is frequent. You will, however, never see close to those values for the Managed Opportunity value, since the stop would have to be higher than the Maximum opportunity. It is much easier to alleviate the risk than it is to lock in profits.
Managed Risk:Opportunity : The ratio of the two preceding values.
Managed Opp. vs. Risk : The Managed Opportunity minus the Managed Risk. When it is negative, which is most often is, it means your strat is protecting a greater portion of the risk than it captures opportunity.
Global Numbers
Win Rate(%) : Percentage of winning trades over all entries. Open trades are considered winning if their last stop/close (as per user selection) locks in profits.
Avg X%, Avg X (currency) : Averages of previously described values:.
Avg Profitability/Trade (APPT) : This measures expectation using: Average Profitability Per Trade = (Probability of Win × Average Win) − (Probability of Loss × Average Loss) . It quantifies the average expectation/trade, which RR alone can’t do, as the probabilities of each outcome (win/lose) must also be used to calculate expectancy. The APPT combine the RR with the win rate to yield the true expectancy of a strategy. In my usual way of expressing risk with X, APPT is the equivalent of the average P&L per trade expressed in X. An APPT of -1.5 means that we lose on average 1.5X/trade.
Equity (X), Equity (currency) : The cumulative result of all trade outcomes, expressed as a multiple of X. Multiplied by the Average X in currency, this yields the Equity in currency.
Risk:Opportunity, Managed Risk:Opportunity, Managed Opp. vs. Risk : The global values of the ones previously described.
Avg Trade Length (TL) : One of the most important values derived by going through all the simulations. Again, it is composed of either the length of stopped trades, or MaxL when the trade isn’t stopped (open). This value can help systems modelers shape the characteristics of the components they use to build their strategies.
Avg Closed Win TL and Avg Closed Lose TL : The average lengths of winning/losing trades that were stopped.
Target reached? Avg bars to Stop and Target reached? Avg bars to Target : For the trades where the target was reached at some point in the simulation, the number of bars to the first point where the stop was breached and where the target was reached, respectively. These two values are used to calculate the next value.
TST (Target:Stop Travel Ratio) : This tracks the ratio between the two preceding values (Bars to first stop/Bars to first target), but only for trades where the target was reached somewhere in the loop. A ratio of 2 means targets are reached twice as fast as stops.
The next values of this section are counts or percentages and are self-explanatory.
Chart Plots
Contains chart plots of values already describes.
NOTES
Optimization/Overfitting: There is a fine line between optimizing and overfitting. Tools like this indicator can lead unsuspecting modelers down a path of overfitting that often turns strategies into over-specialized beasts that do not perform elegantly when confronted to the real-world. Proven testing strategies like walk forward analysis will go a long way in helping modelers alleviate this risk.
Input tuning: Because the results generated by the indicator will vary with the parameters used in the active entry, filtering and exit strats, it’s important to realize that although it may be fun at first, just slapping the default settings on a chart and time frame will not yield optimal nor reliable results. While using ATR as often as possible (as I do in this indicator) is a good way to make strat parametrization adaptable, it is not a foolproof solution.
There is no data for the last MaxL bars of the chart, since not enough trade future has elapsed to run a simulation from MaxL bars back.
Modifying the code: I have tried to structure the code modularly, even if that entails a larger code base, so that you can adapt it to your needs. I’ve included a few token components in each of the placeholders designed for entry strategies, filters, entry stops and in-trade stops. This will hopefully make it easier to add your own. In the same spirit, I have also commented liberally.
You will find in the code many instances of standard trade management tasks that can be lifted to code TV strategies where, as I do in mine, you manage everything yourself and don’t rely on built-in Pine strategy functions to act on your trades.
Enjoy!
THANKS
To @scarf who showed me how plotchar() could be used to plot values without ruining scale.
To @glaz for the suggestion to include a Chandelier stop strat; I will.
To @simpelyfe for the idea of using an indicator input for the filters (if some day TV lets us use more than one, it will be useful in other modules of the indicator).
To @RicardoSantos for the random generator used in the random entry strat.
To all scripters publishing open source on TradingView; their code is the best way to learn.
To my trading buddies Irving and Bruno; who showed me way back how pro traders get it done.

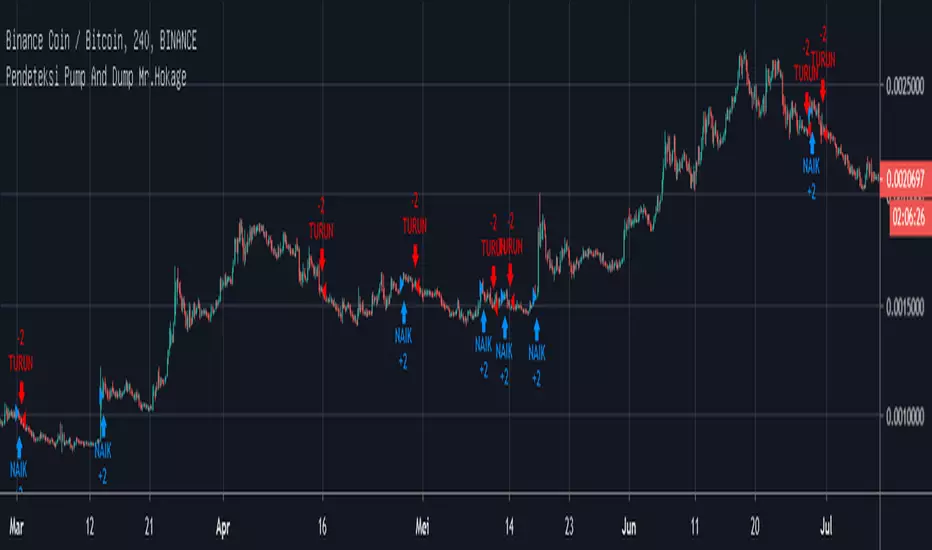
Pendeteksi Pump And Dump Mr.Hokage Tinggal ikuti arahnya kalau Naik harga akan naik kalau turun harga akan turun kalau ada signal bentrok ikutin aja maunya gimana
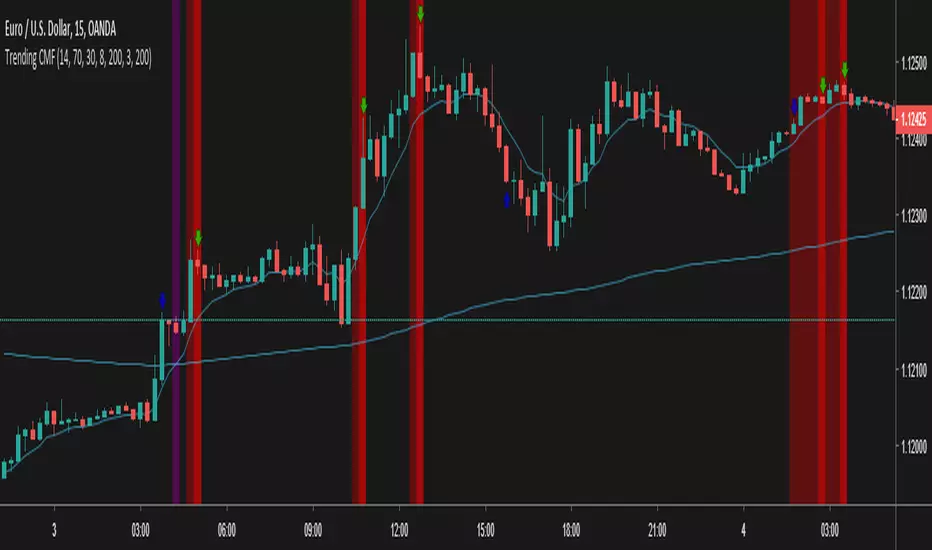
Trending CMF - InverseThis is an rsi based strategy for filtering trends and following nice signals
It is the reversal for the following script and strategy
Test and debug, lemme know what best fits, we are working to improve this

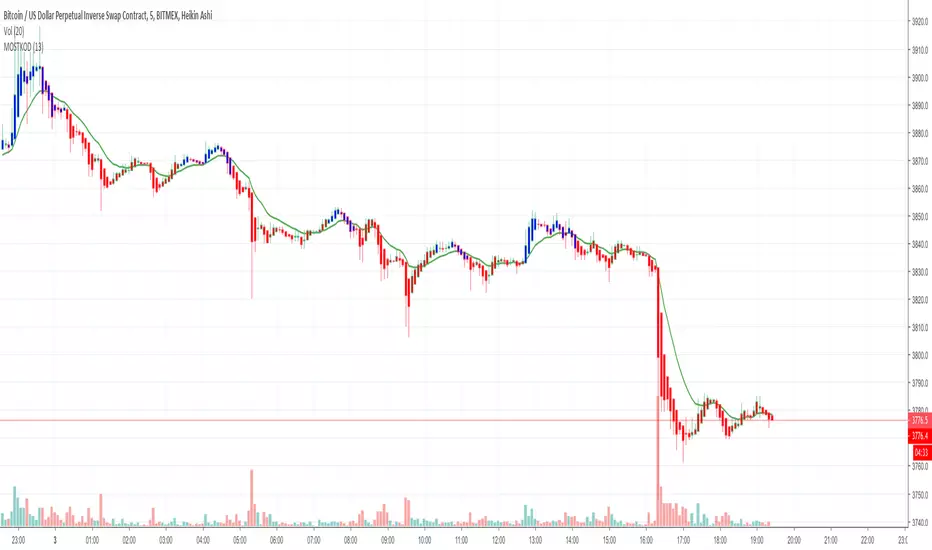
MOSTKOD INDCATOR v1Hello to everyone,
The Mostkod Indicator gives us the buying and selling points.
Blue color on buy;
Red color on sale.
You can contact us for more information.

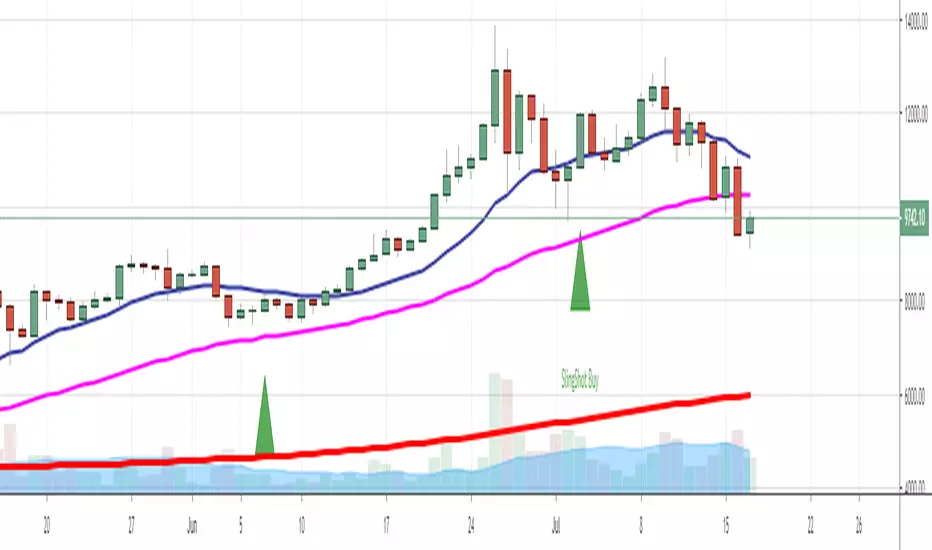
Trade Genius Sling Shot IndicatorOur proprietary reversal indicator with high profit factor, if interested: www.tradelikeagenius.com
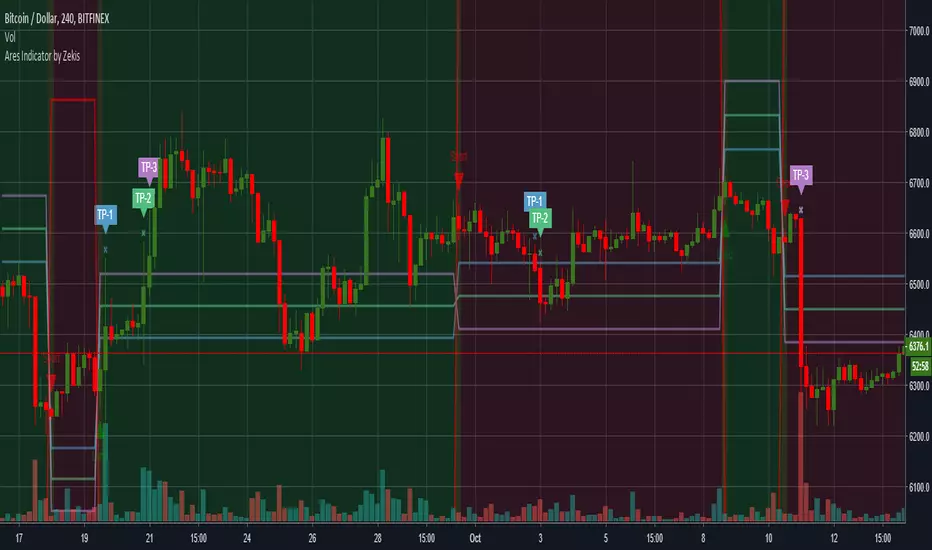
Ares Indicator by ZekisAres Indicator
System Algorithm based on historical price probabilities, with moving averages modified for optimal results.
Buy/Long when background turns green.
Sell/Short when background turns red.
There are 3 Take Profits and a Stop Loss, marked with lines for a better view and with symbols when it get there.
You can set them as you want to meet your requirements.
Alerts are added.
Enjoy!
@ Zekis
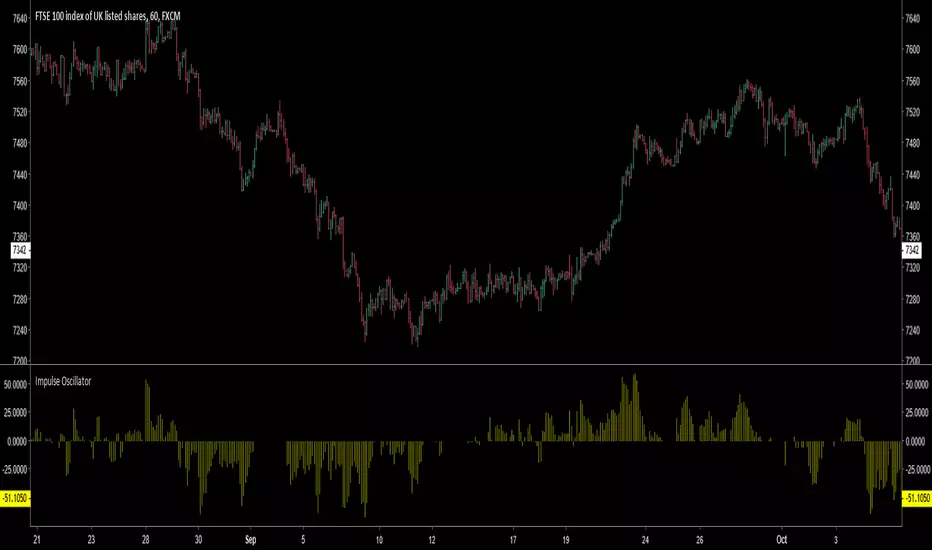
Impulse Oscillator without legs for Price Action & Elliott WavesHi Traders,
I have a newcomer for impulsetrading.
This indicator is an oscillator that show without legs impulses of Price Action .
For the expertise: you can use it for counting elliott waves !
Have fun and winning trades!
SpreadTrade - CorrelationCorrelation Based Pair Trading Strategy (Trading the spread)
There are three popular styles of Pair trading:
* Distance based pair trading
* Correlation based pair trading
* Cointegration based pair trading
The correlation based strategy is to short the outperforming instrument and go long on the underperforming one
whenever the temporary correlation weakens which means one instrument going up and another going down.
Here, instead of two different instruments two timeframes of the same instrument are used, lower and higher.
In order to calculate the trade size, we would need to calculate hedge_ratio,
which is simply the ratio of the closing price of the instrument in the current tf to the higher tf.
So whenever we want to go short on spread we’ll short 1 unit of current tf and go long on hedge ratio times units of higher tf.
In order to generate trading signals, we need to define our trading logic.
So, we’ll go long on the spread when the hedge ratio goes below its p rolling mean by mult times of its
rolling standard deviation and vice versa.
Note that both p and mult can be changed as per your selection of instruments.
See: analyticsprofile.com
NOTE:
There is a minor problem to it in Pinescript. After a while the signal line goes horizontal and the two bounds, upper and lower, converge unless you update the time frame.
Kepp me in the know if you find a solution to this problem)

Megalodon Pro+ Short Term IsolatorMEGALODON PRO+ Short Term Isolator
Megalodon Pro+ is designed for shorter term investors.
Megalodon Pro+ is really simple to use.
Megalodon Pro+ combines 16 different back-tested indicators , that each have more than 66% win rate.
Megalodon Pro+ lets you turn on or off any setups that have been used for a better analysis.
Megalodon Pro+ works with any kind of market state, and any kind of asset.
Megalodon Pro+ can be used to set alarms as soon as a candle closes with a green or red bar.
Megalodon Pro+ has more features than any other indicator in the market, these features can also be turned off in the settings:
Looks for 6 different shorter time frame setups automatically and prints them out.
Shows Mosasaur isolator and can also show Price, Volume and Momentum isolators.
Prints green or red bar s for shorter term signals .
--------------------------------------
MEGALODON PRO+ Short Term Isolator is designed for shorter term investors!
All you have to do is:
1- Apply it on any asset with 240 minutes and 60 minutes time frame and combine it with 1 Day MEGALODON PRO+ Long Term Isolator.
2- Look for green bar confirmation on all isolators.
3- Define your stop losses.
4- Define your target before you enter.
5-Repeat.
--------------------------------------
iPyra◬
Enlighten others

Megalodon Pro+ Long Term IsolatorMEGALODON PRO+ Long Term Isolator
Megalodon Pro+ is designed for longer term and shorter term investors.
Megalodon Pro+ is really simple to use.
Megalodon Pro+ combines 16 different back-tested indicators , that each have more than 66% win rate .
Megalodon Pro+ lets you turn on or off any setups that has been used for a better analysis.
Megalodon Pro+ works with any kind of market state, and any kind of asset.
Megalodon Pro+ can be used to set alarms as soon as a candle closes with a green or red bar.
Megalodon Pro+ has more features than any other indicator in the market, these features can also be turned off in the settings :
Looks for 12 different investing setups automatically and prints them out.
Shows 2 different viewing options: Setups View that shows how many bear or bull setups are currently formed, Isolator View that shows Megalodon Price,Volume and Momentum isolators.
Prints green or red bars for longer term signals.
--------------------------------------
MEGALODON PRO+ Long Term Isolator is designed for longer term and shorter term investors!
All you have to do is:
1- Apply it on any asset with 1Day time frame and combine it with 240minutes and 60 minutes Megalodon Pro+ Short Term Isolator.
2- Look for green bar confirmation on all isolators.
3- Define your stop losses.
4- Define your target before you enter.
5-Repeat
--------------------------------------
iPyra◬
Enlighten others

Megalodon ProMEGALODON PRO
Megalodon Pro is designed for longer term investors.
Megalodon Pro is really simple to use.
Megalodon Pro combines 16 different back-tested indicators , that each have more than 66% win rate .
Megalodon Pro works with any kind of market state, and any kind of asset.
Megalodon Pro can be used to set alarms as soon as a candle closes with a green or red arrow.
Megalodon Pro has more features than any other indicator in the market, these features can also be turned off in the settings :
Looks for 12 different investing setups automatically and prints them out.
Finds and prints longer term and shorter term Fibonacci Retracement levels.
Prints Long Fibonacci levels or Short Fibonacci levels.
Finds and prints a custom Fibonacci level that you might want.
Shows overlapping Fibonacci levels for longer term and shorter term.
Overlays Bollinger Bands.
--------------------------------------
Megalodon Pro is designed for longer term investors!
All you have to do is:
1- Apply it on any asset with 1Day time frame .
2- Look for green arrow close.
3- Define your stop loss if you prefer to have it.
4- Define your target before you enter.
5-Repeat
--------------------------------------
iPyra◬
Enlighten others


gentoku MACDThe gentokuMACD is the colored MACD to judge a trend easily.
In the gentokuMACD, both the MACD line and histogram are colored and it is enable to anticipate small movements and determine a convergence of trends.
It also can be used to find a price range by displaying a resistance and support levels, JYA!

Zanatta Buy & SellThis scrypt is for Long, Shorts, Buy, Sells, Stop Loss and Make Profit.
With this I can calculate the volume x moving average x volatility and shot alerts, that can be integrated easily and execute orders at BitMEX and Bitfinex.

Forex Trade Sessions / Zones + Next Session VisibleAllows User To See Next Session.
Contains all 5 Forex Sessions: New York, London, Frankfurt, Asia (Tokyo), Sydney
Warning! A little buggy on smaller time frames like the 5 minute. 15 minute seems to work fine!

Swing FilterSwing Filter allows you to identify market swings and use the settings to filter out the noise.
The concept is the same as Pine Script's built in pivothigh() and pivotlow(), except with a command center full of controls. Do you to only see swings that are a certain amount higher or lower than their neighboring candles? Want to filter out flash-crashes or freak-spikes? Do you want to count swing-highs or lows that are formed by multiple bars? ...how many? ...how strict? Do you only want swings that are already confirmed or do you want swings that are probably about to be confirmed? You get the idea.
Swing Filter was designed to be plugged into other tools. Swings are used to figure Support and Resistance in Technical Analysis (TA), so you'll find that it is swing filter working in the background of my Support & Resistance Indicator. The creator of this indicator would be happy to help you implement Swing Filter into your workflow, and even can unlock rewiring features that allow Trading View Premium customers to use outputs from other indicators as inputs to swing filter (indicator layering).
INDICATOR SETTINGS:
SWING HIGH VISIBILITY - Show the location of all filtered swing-highs, marked with green "H"
Show Unconfirmed Swing Highs - Whereas a confirmed swing high is shown with a green H, unconfirmed swing highs are shown with an orange H. Sometimes you want to see what could become a swing high before the final right-neighboring candle closes and confirms it. As long as the final right-side candle still has a lower high, we can show an unconfirmed swing high. Once the final right-side candle closes with a lower high, then we have a confirmed swing high. When the "# of Lower Bars to Right of Swing High" setting is set to a number greater than 1, keep in mind that unconfirmed candles will only ever appear one candle prior to confirmation.
# of Lower Bars to Left of Swing High - Swing highs are calculated based on being higher than neighboring candles. How many candles do you want to check to the left-side of a swing high?
# of Lower Bars to Right of Swing High - Swing highs are calculated based on being higher than neighboring candles. How many candles do you want to check to the right-side of a swing high?
Must be This % Higher Than Left Bars - Filter out highs that aren't high enough. "0.5" would require your swing highs to be at least half a percent higher than the high of its confirming left-side bars.
Must be This % Higher Than Right Bars - Filter out highs that aren't high enough. "1" would require your swing highs to be at least one percent higher than the high of its confirming right-side bars.
Multibar Highs - # Bars Allowed to Form High - Filter out or allow highs that are formed at a transition from one bar to another. Especially on low spread exchanges like GDAX, highs may be formed by many consecutive bars, formed by persistant impenetrable buy/sell walls. When using multibar highs, they are counted as a single candle: the swing high will be marked on the right-most high of the multi-bar high, and then the left-side bars are counted from the left-most high of the multi-bar high.
Multibar Highs Strict-Mode - Some multibar highs are just the result of chance, meaning that the first candle reached it's high, went back down, then the second candle reached the same high at a later time. Strict mode will filter these out and only show multibar swing highs that were formed when a candle closed at its high and the next candle opened at its same high. How strict? It allows a one penny difference (for negligible spreads). It also doesn't care about the candles' lows, which leaves room for a future super-strict mode.
*For the complete list of settings and instructions see comments below (sorry they're listed in backwards order below, and the publishing rules won't let me put them all here (too long))

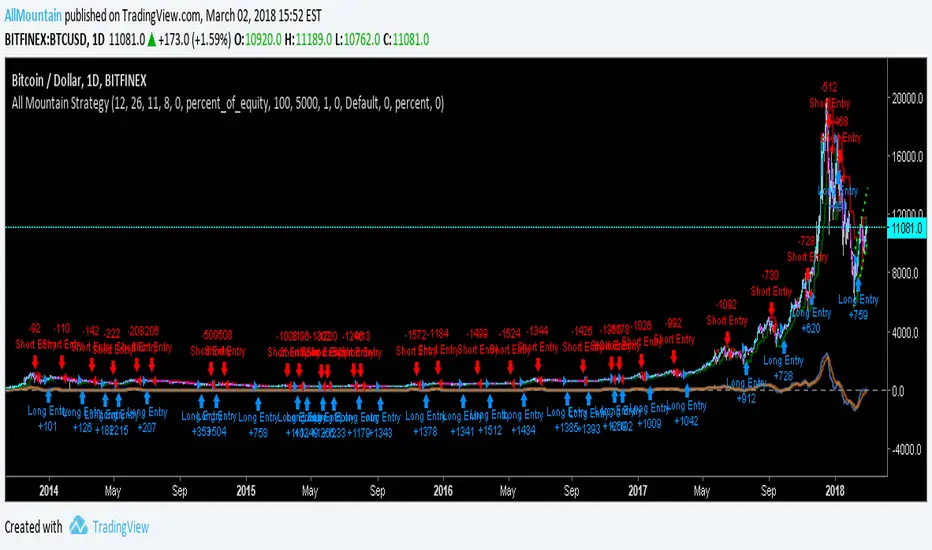
All Mountain StrategyBest use in cryptocurrency.
Use on daily chart for best results.
This strategy does not repaint. It works with trend trackers.
The strategy closes one operation on the inverse signal and initiates another trade.
Good Luck!
Bitcoin donations:: 19fGUD9WXNHxtPE4v2ugbNjqp5dT9VVE3N
MPT - MEDIAN PRICE TRADING - custom forex indicator
MPT is a unique custom indicator i created to enter a trade with the right timing
This indicator catches the momentum of a Forex pair and tells you when to enter
It's based on the idea that when the median price in the current timeframe is crossing the median price of the higher timeframe, the momentum is changing and that is an opportunity to trade
red line is median line of current timeframe (default is 1D)
aqua line is projection of past median line on higher timeframe (default is 1W)
white crosses can be used as a trail stop values to follow a trend
when red cross aqua up the background is green and so momentum of the pair is up
when red cross aqua down no background color and momentum down
You can try this indicator for a limited period, just ask for access in comments
If you want unlimited access you can PM me
Trading is a risky business, use it at your own risk. I'm not responsible for any profit or loss

Estimate exchange/broker fee commission from trade volumeThis script is used to estimate how much an exchange/broker makes off a particular pair/symbol. If Coinbase(GDAX) has a 0.25% taker fee and a 0.15% maker fee per trade and you estimate the average commission fee at 0.19% then you simple input that, and how many periods you'd like to know the total fee for (30 periods on the 1 day chart = last 30 days, 28 periods on 4 hour chart = last 7 days, etc).
This is for broad estimates of a single pair and only works well on exchanges that show only the volume on that exchange (stock markets may be less useful for this tool).
THIS TOOL IS TO PROVIDE A BROAD ESTIMATE , NOT AN EXACT FIGURE!
// percentage fee rate is entered as a percent: 3.5=3.5%, not 350%.
// pbtc , the one for calculating the USD value of fees that are in bitcoin, uses the price at time fees were realized. IE chart is on
// 1 day interval and XBARFEE is set at 4, then PBTC gives the USD value as if the exchange sold all btc at the end of each day for
// 4 days. i.e.:
// Day 1: BTCUSD= $5000 fees=1.5, Day 2: BTCUSD = $5000 fees=3.0, Day 3 BTCUSD = $10,000 fees=1.0, Day 4 BTCUSD = $20,000 fees=1.0
// PBTC would NOT show (1.5+ 3 + 1 + 1) = 6.5 * $20k = $130,000. It would do: (1.5*5000)+(3*5000)... = $52,500.
