Multi-Asset Cross Timeframe Divergence Ind. (MACDI) // AlgoFyreThe Multi-Asset Cross Timeframe Divergence Indicator (MACDI) identifies divergences in momentum like RSI across multiple assets and timeframes. It visually highlights lagging correlated asset momentum divergences, helping traders spot inefficiencies and potential trade opportunities in the following asset.
🔶 KEY FEATURES
🔸Average Momentum Trendline for Each Timeframe
The Average Momentum Trendline feature calculates the average momentum of multiple assets over specified timeframes. It uses smoothed values to determine the momentum trend for each timeframe on the average aggregated momentum of both assets. This trendline helps traders identify the overall direction of the market momentum, providing a clearer picture of potential price movements.
🔸Real-time Divergence Indication and Alert Table
The Real-time Divergence Indications and Alert Table feature visualizes detected divergences between the momentum values of the two assets across different timeframes. It identifies both bullish and bearish divergences, signaling lagging reversals in the the following asset and potential trading opportunities. When a divergence is detected, the system generates real-time visual indications on the chart and in an overview table for traders to act promptly. The alert table provides a comprehensive overview of all detected divergences, making it easier for traders to monitor and respond to market changes.
🔸Color and Size Based Labels on Price Chart based on Divergence Type
The Color and Size Based Labels feature visually represents divergences directly on the price chart. Bullish and bearish divergences are marked with distinct colors and sizes, making them easily identifiable at a glance. Larger labels indicate higher timeframes and thus generally more significance.
🔶 INSTRUCTION GUIDELINES
🔸Identify Divergence Clusters
The more divergences align, the higher the probability of a potential trend reversal in the asset. When multiple multi-timeframe divergences occur in both lower and higher timeframes within a local cluster, the probability of a reversal increases. This is valid for both for bullish and bearish divergences.
🔸Spot Low Probability Divergences
To further increase the probability, analyze the current state of the average momentum trendline. For a bullish reversal, a relatively low level of the average momentum trendline is preferred, whereas for a bearish reversal, a relatively high level is preferred.
🔶 INDIVIDUAL CONFIGURATION
🔸Leading Asset
This input allows the user to select the leading asset for the divergence analysis.
🔸Following Asset
This input allows the user to select the following asset for the divergence analysis.
🔸Higher Timeframe
This input sets the higher timeframe for the analysis.
🔸Lower Timeframe
This input sets the lower timeframe for the analysis.
🔸Show RSI Divergence
This input enables or disables the display of RSI divergence signals.
🔸RSI Length
This input sets the length of the RSI calculation.
🔸RSI Source
This input sets the source data for the RSI calculation (e.g., close price).
🔸RSI Smoothing Length
This input sets the length of the smoothing applied to the RSI values.
🔸Smoothing Method
This input sets the method used for smoothing the RSI values.
🔶 CONCLUSION
The Multi-Asset Cross Timeframe Divergence Indicator (MACDI) is a powerful tool for identifying momentum divergences across multiple assets and timeframes. Its visual cues and customizable table make it easy to use and interpret, providing valuable insights for trading decisions.
Timeframe

Stock Strength IndexScript Title: Stock Strength Index made by Vishal R Janjire
Description:
The Stock Strength Index combines several advanced technical analysis tools into one comprehensive Pine Script indicator designed to provide a nuanced view of market strength and trends. This script integrates Relative Strength (RS), Commodity Channel Index (CCI), and additional trend confirmation mechanisms to deliver actionable insights for traders.
( Must Read )
Important parameter read before use this indicator
0. Zero line green means stock is in up trend and if it is red means down trending.
1. Zero line is green it means stocks is outperforming its index that is Nifty 50 ( but dont consider its results on nifty itself that is it will not work only on nifty 50)
2. Zero line is red it means stocks is underperforming its index that is Nifty 50
3. bubble is confirmation tool when it show green bubble on zero line it means on short time frame it want go up trending and vise versa
4. Always remember higher time frame is greater than chart time frame like day vs hour
Key Features:
5. Best suitable time when higher time frame is 15 minutes and chart time is 5 minute for intraday trading. for short swing use HTF 1 Day and chart time is 1 hour or 2 hour.
1. Relative Strength (RS) Analysis:
- Calculation: Measures the performance of the base symbol relative to a comparative symbol over a specified period.
- Visualization: Plots the RS value with color-coded lines to indicate bullish (green) or bearish (red) conditions based on crossovers. Users can toggle the RS color based on its value or trend direction.
- Trend Analysis: Displays a simple moving average (SMA) of RS to visualize trend strength and direction. The SMA’s color changes to indicate rising or falling trends.
2. Commodity Channel Index (CCI):
- Current Timeframe CCI: Calculates the CCI for the current timeframe to assess price momentum.
- Higher Timeframe CCI: Computes the CCI for a higher timeframe to provide a broader market perspective.
- Background Color: Highlights the chart background in green or red based on whether both current and higher timeframe CCIs are above or below zero, respectively.
3. Alerts:
- CCI Alerts: Set up alerts for key CCI crossovers, including when both CCIs are above or below zero, or when CCI crosses key levels (100 and -100) on either timeframe.
4. Trend Confirmation:
- Price Confirmation: Uses price and its moving average to identify bullish or bearish divergence, with visual bubbles plotted on the chart to confirm potential trade signals.
5. Customization Options:
- RS Parameters: Adjust settings for RS period, comparative symbol, and whether to display reference labels or the zero line.
- CCI Parameters: Configure CCI lengths for both current and higher timeframes and select the source of the CCI calculation.
Concepts Underlying Calculations:
- Relative Strength (RS): Measures the relative performance of the base symbol compared to another symbol, adjusted over a specified period to capture momentum and trend strength.
- Commodity Channel Index (CCI): Calculates the deviation of the price from its average to identify overbought or oversold conditions and potential reversal points.
- Simple Moving Average (SMA): Smooths the RS values to highlight trends and potential trend reversals.
This indicator is designed for traders seeking a comprehensive tool that combines multiple analytical methods into one cohesive system. It aims to offer a clearer view of market trends, strengths, and potential trade opportunities based on a blend of relative strength and momentum indicators.
---
This description provides a detailed overview of the script's functionality and customization options while ensuring clarity and compliance with the publishing rules.

Horizontal Lines 0.5, BY ROSHAN SINGHThis indicator identify support and resistance to trade in 1min time frame, based of fib 0.5 level, on 15 min time frame find major high and low means major swing, low will be our start level and high will be our end level input in setting, substract high and end level and now divide answer with 2 till the daily volatility of a index or stock, if saying about nifty suppose nifty daily travel minimum for 65 pts then interval will be 65 input in settings, now all horizontals lines means support and level will be plotted on chart, buy on support, sell on resistance

Custom EMA Multi-Timeframe Indicator [Pineify]
This innovative indicator combines Exponential Moving Averages (EMAs) across multiple timeframes to provide traders with a comprehensive view of market trends and potential trading opportunities. By analyzing short, medium, and long-term EMAs simultaneously, this indicator offers valuable insights into market dynamics and helps identify high-probability entry and exit points.
Key Features
Multi-timeframe analysis using customizable EMAs
Visual representation of trend alignment across different timeframes
Customizable EMA lengths and sources for each timeframe
Buy and sell signals based on EMA crossovers
Alert functionality for real-time trade notifications
How It Works
The Custom EMA Multi-Timeframe Indicator calculates three separate EMAs:
1. Short-term EMA: Represents immediate market sentiment
2. Medium-term EMA: Captures intermediate trend direction
3. Long-term EMA: Reflects the overall market trend
These EMAs are plotted on the chart using different colors for easy identification. The indicator generates buy and sell signals based on the relative positions of these EMAs, providing traders with clear visual cues for potential trade entries and exits.
Trading Ideas and Insights
This indicator offers several powerful trading concepts:
Trend Alignment: When all three EMAs are aligned (short above medium above long), it indicates a strong trend. Traders can look for pullbacks to enter in the direction of the trend.
Trend Reversal: When the short-term EMA crosses above or below both the medium and long-term EMAs, it may signal a potential trend reversal. This can be used to exit existing positions or enter new trades in the opposite direction.
Range-bound Markets: When the EMAs are tightly grouped together, it suggests a consolidation phase. Traders can wait for a breakout or use range-trading strategies.
Momentum Confirmation: The speed at which the short-term EMA diverges from or converges with the longer-term EMAs can indicate the strength of the current move.
Unique Aspects
What sets this indicator apart is its ability to synthesize information from multiple timeframes into a single, easy-to-interpret visual display. Unlike traditional single-timeframe EMAs, this indicator provides a more holistic view of market trends, reducing false signals and improving trade timing.
The customizable nature of the indicator allows traders to adapt it to various trading styles and market conditions. By adjusting the EMA lengths and sources, traders can fine-tune the indicator to their specific needs and preferences.
How to Use
1. Apply the indicator to your chart
2. Customize the timeframes and EMA settings as desired
3. Look for buy signals when the short and medium EMAs cross above the long EMA
4. Look for sell signals when the short and medium EMAs cross below the long EMA
5. Use the relative positions of the EMAs to gauge overall trend strength and direction
6. Combine with other technical analysis tools for confirmation
Customization
The indicator offers extensive customization options:
Short, medium, and long timeframes can be adjusted
EMA lengths for each timeframe are customizable
EMA source (close, open, high, low, etc.) can be selected for each timeframe
Colors and line styles can be modified to suit personal preferences
Alert settings can be configured for automated trade notifications
Conclusion
The Custom EMA Multi-Timeframe Indicator is a powerful tool for traders seeking to gain a comprehensive understanding of market trends across different time horizons. By combining multiple EMAs and timeframes, it provides a unique perspective on market dynamics, helping traders make more informed decisions and potentially improve their trading results.
Whether you're a day trader looking for short-term opportunities or a swing trader focusing on longer-term trends, this indicator offers valuable insights that can enhance your trading strategy. Its flexibility and customization options make it suitable for a wide range of trading styles and market conditions.
Remember: While this indicator can be a valuable tool in your trading arsenal, it should not be used in isolation. Always combine it with other forms

HTF Multi Candles DisplayHTF Multi Candles Display
Description
The HTF Multi Candles Display is a powerful and versatile indicator that overlays higher timeframe (HTF) candles on your current chart, providing traders with a comprehensive multi-timeframe analysis tool in a single view. This indicator is particularly valuable for traders who employ strategies that rely on higher timeframe context, such as the Power of Three strategy, Turtle Soup, Candle Range Theory (CRT), and Inner Circle Trader (ICT) concepts like Price Delivery (PD) arrays.
> **Notice**: If you find this indicator beneficial for your trading, I would greatly appreciate any contribution in the form of TradingView Coins. Thank you for your support!
Key Features
1. Displays up to 5 higher timeframe candles
2. Customizable higher timeframe selection (5m to Monthly)
3. Adjustable candle appearance (colors, wicks, width)
4. Time labels for easy reference
5. Optional vertical lines to separate HTF candles
6. Offset adjustment to position candles away from the chart edge
7. Customizable wick and border colors
8. Flexible vertical line styles (solid, dashed, dotted)
9. Adjustable time label font sizes
How it Helps Traders
### 1. Multi-timeframe Analysis
By overlaying higher timeframe candles on your current chart, this indicator allows you to easily identify key levels, trends, and potential reversal points across different timeframes without switching between multiple charts.
### 2. Power of Three Strategy
This indicator is invaluable for traders using the Inner Circle Trader (ICT) Power of Three strategy, which focuses on accumulation, manipulation, and distribution phases. The higher timeframe candles help identify these phases more accurately, allowing for better trade entries and exits:
- Accumulation: Identify periods of sideways price action on higher timeframes.
- Manipulation: Spot false breakouts or breakdowns on lower timeframes that are contained within higher timeframe ranges.
- Distribution: Recognize when price is approaching significant higher timeframe levels where smart money may begin to distribute.
### 3. Turtle Soup
Traders can use this indicator to spot potential Turtle Soup setups by identifying key breakout levels on higher timeframes and comparing them to current price action. This helps in:
- Identifying false breakouts that may lead to Turtle Soup trade opportunities.
- Confirming the validity of breakouts by comparing lower timeframe momentum to higher timeframe structure.
### 4. Candle Range Theory (CRT)
This indicator is extremely useful for traders applying Candle Range Theory. CRT focuses on the relationship between the current candle's range and the previous candle's range. By displaying higher timeframe candles, traders can:
- Easily compare candle ranges across multiple timeframes.
- Identify potential breakout or breakdown levels based on the previous HTF candle's range.
- Spot instances where the current lower timeframe price action is testing or breaking significant HTF candle ranges.
- Recognize potential reversal points where price reaches the extremes of higher timeframe candle ranges.
### 5. Support and Resistance
Higher timeframe candles often represent significant support and resistance levels. This indicator makes it easy to spot these levels and incorporate them into your trading decisions, allowing you to:
- Identify key support and resistance levels from higher timeframes.
- Anticipate potential price reactions at these levels on your current timeframe.
- Plan entries, exits, and stop-loss placement with greater precision.
### 6. Trend Identification
By displaying multiple HTF candles, traders can quickly assess the overall trend direction on higher timeframes, helping to align trades with the broader market direction:
- Easily visualize the trend on higher timeframes without changing your chart.
- Identify potential trend changes or continuations based on HTF candle patterns.
- Align your trades with the higher timeframe trend for potentially higher probability setups.
### 7. Enhanced Decision Making
The combination of current timeframe price action and higher timeframe context allows for more informed decision-making, potentially improving trade quality and risk management:
- Validate trade setups by ensuring they align with higher timeframe structure.
- Avoid low-probability trades that conflict with higher timeframe trends or key levels.
- Adjust position sizing based on the proximity to significant HTF levels.
### 8. Time Efficiency
Instead of constantly switching between timeframes, traders can view all necessary information on a single chart, streamlining their analysis process:
- Reduce the time spent switching between multiple charts.
- Quickly assess market conditions across various timeframes.
- Improve focus by having all relevant information in one view.
### 9. ICT Price Delivery (PD) Arrays
The HTF Multi Candles Display is particularly useful for traders familiar with Inner Circle Trader (ICT) concepts, especially in identifying Price Delivery (PD) arrays:
- Visualize potential PD arrays across multiple timeframes without switching charts.
- Identify key swing highs and lows that form PD array structures.
- Recognize patterns such as Breaker Blocks, Inefficient Price Points, and Fair Value Gaps more easily on higher timeframes.
- Spot potential areas where smart money might be accumulating or distributing by analyzing the relationship between HTF candles.
- Use the series of HTF candles to identify potential Order Blocks, which are often key components of PD arrays.
- Recognize Mitigation Points and Liquidity Voids more effectively by analyzing the structure of multiple HTF candles.
By displaying a series of HTF candles, this indicator allows traders to more easily identify and validate ICT concepts like PD arrays, enhancing their ability to spot high-probability trading opportunities and potential market turning points.
Conclusion
The HTF Multi Candles Display indicator is suitable for traders of all levels, from beginners looking to understand market structure across timeframes to experienced traders refining their multi-timeframe analysis techniques. Whether you're day trading, swing trading, or looking for longer-term positions, this indicator provides valuable insights to enhance your trading strategy.
By incorporating higher timeframe context into your analysis, you can make more informed trading decisions, identify high-probability setups, and potentially improve your overall trading performance. The HTF Multi Candles Display is a versatile tool that adapts to various trading strategies and helps traders gain a deeper understanding of market dynamics across multiple timeframes, including advanced concepts like ICT Price Delivery arrays.

Multi-Timeframe EMA Distance & % Change TableDescription of Multi-Timeframe EMA Distance & % Change Table
The Multi-Timeframe EMA Distance & % Change Table indicator is designed to display the distance and percentage change between the current price and the Exponential Moving Averages (EMAs) on multiple timeframes. It creates a table to show these values, with customizable options for decimal precision .
Key Features:
Inputs:
- Timeframes (tf1, tf2, tf3, tf4): User-defined timeframes for EMA calculations (e.g., 1 minute, 15 minutes, daily, etc.).
- EMA Levels (emaLevel, emaLevel2, emaLevel3): User-defined periods for three different EMAs.
EMA Calculations:
- Computes EMAs for the specified levels (50, 100, 200) on each of the user-selected timeframes.
Plotting:
- Plots the EMAs on the chart with distinct colors: Orange, Teal, and Green for different EMAs.
Display Options:
- Checkbox (displayAsPercentage): Allows the user to toggle between displaying distances or percentage changes.
- Decimal Precision:
- decimalPlacesDistance: Specifies the number of decimal places for rounded distance values.
- decimalPlacesPercentage: Specifies the number of decimal places for rounded percentage values.
Table Creation:
- Location: Table is placed in the top-right corner of the chart.
- Headers: Includes columns for each timeframe and EMA distance/percentage.
Distance and Percentage Calculations:
- Distances: Calculated as the difference between the current price and the EMA values for each timeframe.
- Percentages: Calculated as the distance divided by the EMA value, converted to a percentage.
Decimal Rounding:
- Custom Rounding Function: Ensures that distance and percentage values are displayed with the user-specified number of decimal places.
Color Coding:
- Distance Values: Colored green if positive, red if negative.
- Table Entries: Display either the rounded distance or percentage, based on user selection.
Table Update:
- The table is dynamically updated with either distance or percentage values based on the user's choice and rounded to the specified number of decimal places.
This indicator provides a comprehensive overview of EMA distances and percentage changes across multiple timeframes, with detailed control over the precision of the displayed values.

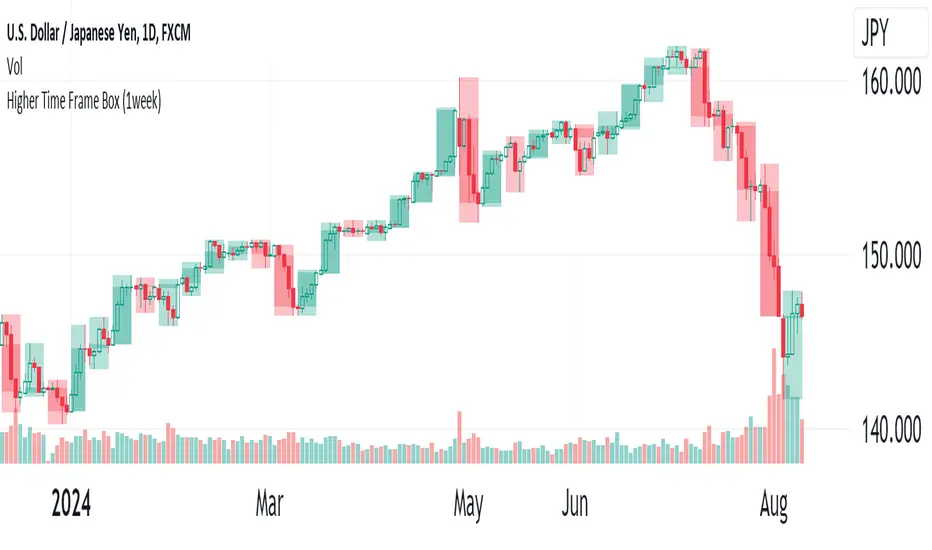
Higher Time Frame(HTF)The Higher Time Frame (HTF) will be displayed in a box. You can choose HTF periods from: 15min, 30min, 1hour, 2hour, 3hour, 4hour, 6hour, 8hour, 12hour, 1day, 1week, 2week, 4week, 1month, 2month, 3month, 4month, 6month, and 1year.
An error will occur if you set a period longer than the current candlestick period being displayed. The HTF Box can display a maximum of 500 boxes. There is no guarantee that all combinations of periods will work correctly.
----
上位足(Higher Time Frame, HTF) をボックスで表示します。
上位足の期間は、15分 30分 1時間 2時間 3時間 4時間 6時間 8時間 12時間 1日 1週 2週 4週 1月 2月 3月 4月 6月 1年から選べます。
表示しているローソク足の期間より長い期間を設定しないとエラーとなります。
上位足ボックスは最大500個表示することができます。
全ての期間の組み合わせで正しく動くことを保証するものではありません。
Custom Supertrend Multi-Timeframe Indicator [Pineify]Supertrend Multi-Timeframe Indicator
Introduction
The Supertrend Multi-Timeframe Indicator is an advanced trading tool designed to help traders identify trend directions and potential buy/sell signals by combining Supertrend indicators from multiple timeframes. This script is original in its approach to integrating Supertrend calculations across different timeframes, providing a more comprehensive view of market trends.
Concepts and Calculations
The indicator utilizes the Supertrend algorithm, which is based on the Average True Range (ATR). The Supertrend is a popular tool for trend-following strategies, and this script enhances its capabilities by incorporating data from a larger timeframe.
Supertrend Factor: Determines the sensitivity of the Supertrend line.
ATR Length: Defines the period for calculating the Average True Range.
Larger Supertrend Factor and ATR Length: Applied to the larger timeframe for a broader trend perspective.
Larger Timeframe: The higher timeframe from which the secondary Supertrend data is sourced.
How It Works
The script calculates the Supertrend for the current timeframe using the specified factor and ATR length.
Simultaneously, it requests Supertrend data from a larger timeframe.
Buy and sell signals are generated based on crossovers and crossunders of the Supertrend lines from both timeframes.
Visual cues (up and down arrows) are plotted on the chart to indicate buy and sell signals.
Background colors change to reflect the trend direction: green for an uptrend and red for a downtrend.
Usage
Add the indicator to your TradingView chart.
Customize the Supertrend factors, ATR lengths, and larger timeframe according to your trading strategy.
Enable or disable buy and sell alerts as needed.
Monitor the chart for visual signals and background color changes to make informed trading decisions.
Note: The indicator is best used in conjunction with other technical analysis tools and should not be relied upon as the sole basis for trading decisions.
Conclusion
The Supertrend Multi-Timeframe Indicator offers a unique and powerful way to analyze market trends by leveraging the strengths of the Supertrend algorithm across multiple timeframes. Its customizable settings and clear visual signals make it a valuable addition to any trader's toolkit.

Higher Timeframe Open High Low ClosePURPOSE
1. Multi-timeframe analysis (MTFA).
2. Better visualize intraday price action relative higher timeframe price action, and this is not limited to the current time frame or the higher time frame including current price movement.
3. Higher Timeframes provides an overview of the long-term trend (e.g., weekly or monthly charts).
4. Confirm trends occurring on more than one timeframe.
5. Improve choice of entry and exit points.
ORIGINALITY
1. Compare current lower time frame price movement to current or previous higher time frame movement. The user specifies in the settings the higher time frame (day, week, month, quarter, or year) and the associated price movement data, including OHLC, average prices, and moving average levels.
2. Previous time frames and all specified levels (OHLC, average prices, and moving averages) can be shifted together to overlay the current time frame. This allows analysis of lower/intraday price movement against that of any past higher time frames.
3. Use: In the settings, the current time frame (i.e., that including current price movement) 'count from current' is '0', a count of '1' would shift one higher level time frame such that the open date of that shifted time frame aligns with the open date of the current time frame. A count of '3' would shift three higher level time frames to align with the current."
4. Example: On the Wednesday July 24 intraday chart, overlay the daily OHLC, typical price, and 10-day EMA data occurring at the close of Wednesday July 17. This allows analyze current price movement against data from one week prior.
HIGHER TIMEFRAME DATA that can be PLOTTED and SHIFTED
1. Open, High, Low, Close.
2. Average prices: Median (HL/2), Typical (HLC/3), (Average OHLC/4), Body Median (OC/2), Weighted Close (HL2C/4), Biased 01 (HC/2 if Close > Open, else LC/2), Biased 02 (High if Close > HL/2, else Low), Biased 03 (High if Close > Open, else Low).
3. Moving averages with user specified source, length and type.

Six PillarsGeneral Overview
The "Six Pillars" indicator is a comprehensive trading tool that combines six different technical analysis methods to provide a holistic view of market conditions.
These six pillars are:
Trend
Momentum
Directional Movement (DM)
Stochastic
Fractal
On-Balance Volume (OBV)
The indicator calculates the state of each pillar and presents them in an easy-to-read table format. It also compares the current timeframe with a user-defined comparison timeframe to offer a multi-timeframe analysis.
A key feature of this indicator is the Confluence Strength meter. This unique metric quantifies the overall agreement between the six pillars across both timeframes, providing a score out of 100. A higher score indicates stronger agreement among the pillars, suggesting a more reliable trading signal.
I also included a visual cue in the form of candle coloring. When all six pillars agree on a bullish or bearish direction, the candle is colored green or red, respectively. This feature allows traders to quickly identify potential high-probability trade setups.
The Six Pillars indicator is designed to work across multiple timeframes, offering a comparison between the current timeframe and a user-defined comparison timeframe. This multi-timeframe analysis provides traders with a more comprehensive understanding of market dynamics.
Origin and Inspiration
The Six Pillars indicator was inspired by the work of Dr. Barry Burns, author of "Trend Trading for Dummies" and his concept of "5 energies." (Trend, Momentum, Cycle, Support/Resistance, Scale) I was intrigued by Dr. Burns' approach to analyzing market dynamics and decided to put my own twist upon his ideas.
Comparing the Six Pillars to Dr. Burns' 5 energies, you'll notice I kept Trend and Momentum, but I swapped out Cycle, Support/Resistance, and Scale for Directional Movement, Stochastic, Fractal, and On-Balance Volume. These changes give you a more dynamic view of market strength, potential reversals, and volume confirmation all in one package.
What Makes This Indicator Unique
The standout feature of the Six Pillars indicator is its Confluence Strength meter. This feature calculates the overall agreement between the six pillars, providing traders with a clear, numerical representation of signal strength.
The strength is calculated by considering the state of each pillar in both the current and comparison timeframes, resulting in a score out of 100.
Here's how it calculates the strength:
It considers the state of each pillar in both the current timeframe and the comparison timeframe.
For each pillar, the absolute value of its state is taken. This means that both strongly bullish (2) and strongly bearish (-2) states contribute equally to the strength.
The absolute values for all six pillars are summed up for both timeframes, resulting in two sums: current_sum and alternate_sum.
These sums are then added together to get a total_sum.
The total_sum is divided by 24 (the maximum possible sum if all pillars were at their strongest states in both timeframes) and multiplied by 100 to get a percentage.
The result is rounded to the nearest integer and capped at a minimum of 1.
This calculation method ensures that the Confluence Strength meter takes into account not only the current timeframe but also the comparison timeframe, providing a more robust measure of overall market sentiment. The resulting score, ranging from 1 to 100, gives traders a clear and intuitive measure of how strongly the pillars agree, with higher scores indicating stronger potential signals.
This approach to measuring signal strength is unique in that it doesn't just rely on a single aspect of price action or volume. Instead, it takes into account multiple factors, providing a more robust and reliable indication of potential market moves. The higher the Confluence Strength score, the more confident traders can be in the signal.
The Confluence Strength meter helps traders in several ways:
It provides a quick and easy way to gauge the overall market sentiment.
It helps prioritize potential trades by identifying the strongest signals.
It can be used as a filter to avoid weaker setups and focus on high-probability trades.
It offers an additional layer of confirmation for other trading strategies or indicators.
By combining the Six Pillars analysis with the Confluence Strength meter, I've created a powerful tool that not only identifies potential trading opportunities but also quantifies their strength, giving traders a significant edge in their decision-making process.
How the Pillars Work (What Determines Bullish or Bearish)
While developing this indicator, I selected and configured six key components that work together to provide a comprehensive view of market conditions. Each pillar is set up to complement the others, creating a synergistic effect that offers traders a more nuanced understanding of price action and volume.
Trend Pillar: Based on two Exponential Moving Averages (EMAs) - a fast EMA (8 period) and a slow EMA (21 period). It determines the trend by comparing these EMAs, with stronger trends indicated when the fast EMA is significantly above or below the slow EMA.
Directional Movement (DM) Pillar: Utilizes the Average Directional Index (ADX) with a default period of 14. It measures trend strength, with values above 25 indicating a strong trend. It also considers the Positive and Negative Directional Indicators (DI+ and DI-) to determine trend direction.
Momentum Pillar: Uses the Moving Average Convergence Divergence (MACD) with customizable fast (12), slow (26), and signal (9) lengths. It compares the MACD line to the signal line to determine momentum strength and direction.
Stochastic Pillar: Employs the Stochastic oscillator with a default period of 13. It identifies overbought conditions (above 80) and oversold conditions (below 20), with intermediate zones between 60-80 and 20-40.
Fractal Pillar: Uses Williams' Fractal indicator with a default period of 3. It identifies potential reversal points by looking for specific high and low patterns over the given period.
On-Balance Volume (OBV) Pillar: Incorporates On-Balance Volume with three EMAs - short (3), medium (13), and long (21) periods. It assesses volume trends by comparing these EMAs.
Each pillar outputs a state ranging from -2 (strongly bearish) to 2 (strongly bullish), with 0 indicating a neutral state. This standardized output allows for easy comparison and aggregation of signals across all pillars.
Users can customize various parameters for each pillar, allowing them to fine-tune the indicator to their specific trading style and market conditions. The multi-timeframe comparison feature also allows users to compare pillar states between the current timeframe and a user-defined comparison timeframe, providing additional context for decision-making.
Design
From a design standpoint, I've put considerable effort into making the Six Pillars indicator visually appealing and user-friendly. The clean and minimalistic design is a key feature that sets this indicator apart.
I've implemented a sleek table layout that displays all the essential information in a compact and organized manner. The use of a dark background (#030712) for the table creates a sleek look that's easy on the eyes, especially during extended trading sessions.
The overall design philosophy focuses on presenting complex information in a simple, intuitive format, allowing traders to make informed decisions quickly and efficiently.
The color scheme is carefully chosen to provide clear visual cues:
White text for headers ensures readability
Green (#22C55E) for bullish signals
Blue (#3B82F6) for neutral states
Red (#EF4444) for bearish signals
This color coding extends to the candle coloring, making it easy to spot when all pillars agree on a bullish or bearish outlook.
I've also incorporated intuitive symbols (↑↑, ↑, →, ↓, ↓↓) to represent the different states of each pillar, allowing for quick interpretation at a glance.
The table layout is thoughtfully organized, with clear sections for the current and comparison timeframes. The Confluence Strength meter is prominently displayed, providing traders with an immediate sense of signal strength.
To enhance usability, I've added tooltips to various elements, offering additional information and explanations when users hover over different parts of the indicator.
How to Use This Indicator
The Six Pillars indicator is a versatile tool that can be used for various trading strategies. Here are some general usage guidelines and specific scenarios:
General Usage Guidelines:
Pay attention to the Confluence Strength meter. Higher values indicate stronger agreement among the pillars and potentially more reliable signals.
Use the multi-timeframe comparison to confirm signals across different time horizons.
Look for alignment between the current timeframe and comparison timeframe pillars for stronger signals.
One of the strengths of this indicator is it can let you know when markets are sideways – so in general you can know to avoid entering when the Confluence Strength is low, indicating disagreement among the pillars.
Customization Options
The Six Pillars indicator offers a wide range of customization options, allowing traders to tailor the tool to their specific needs and trading style. Here are the key customizable elements:
Comparison Timeframe:
Users can select any timeframe for comparison with the current timeframe, providing flexibility in multi-timeframe analysis.
Trend Pillar:
Fast EMA Period: Adjustable for quicker or slower trend identification
Slow EMA Period: Can be modified to capture longer-term trends
Momentum Pillar:
MACD Fast Length
MACD Slow Length
MACD Signal Length These can be adjusted to fine-tune momentum sensitivity
DM Pillar:
ADX Period: Customizable to change the lookback period for trend strength measurement
ADX Threshold: Adjustable to define what constitutes a strong trend
Stochastic Pillar:
Stochastic Period: Can be modified to change the sensitivity of overbought/oversold readings
Fractal Pillar:
Fractal Period: Adjustable to identify potential reversal points over different timeframes
OBV Pillar:
Short OBV EMA
Medium OBV EMA
Long OBV EMA These periods can be customized to analyze volume trends over different timeframes
These customization options allow traders to experiment with different settings to find the optimal configuration for their trading strategy and market conditions. The flexibility of the Six Pillars indicator makes it adaptable to various trading styles and market environments.

TechniTrend RSI (11TF)Multi-Timeframe RSI Indicator
Overview
The Multi-Timeframe RSI Indicator is a sophisticated tool designed to provide comprehensive insights into the Relative Strength Index (RSI) across 11 different timeframes simultaneously. This indicator is essential for traders who wish to monitor RSI trends and their moving averages (MA) to make informed trading decisions.
Features
Multiple Timeframes: Displays RSI and RSI MA values for 11 different timeframes, allowing traders to have a holistic view of the market conditions.
RSI vs. MA Comparison: Indicates whether the RSI value is above or below its moving average for each timeframe, helping traders to identify bullish or bearish momentum.
Overbought/Oversold Signals:
Marks "OS" (OverSell) when RSI falls below 25, indicating a potential oversold condition.
Marks "OB" (OverBuy) when RSI exceeds 75, signaling a potential overbought condition.
Real-Time Updates: Continuously updates in real-time to provide the most current market information.
Usage
This indicator is invaluable for traders who utilize RSI as part of their technical analysis strategy. By monitoring multiple timeframes, traders can:
Identify key overbought and oversold levels to make entry and exit decisions.
Observe the momentum shifts indicated by RSI crossing above or below its moving average.
Enhance their trading strategy by integrating multi-timeframe analysis for better accuracy and confirmation.
How to Interpret the Indicator
RSI Above MA: Indicates a potential bullish trend. Traders may consider looking for long positions.
RSI Below MA: Suggests a potential bearish trend. Traders may look for short positions.
OS (OverSell): When RSI < 25, the market may be oversold, presenting potential buying opportunities.
OB (OverBuy): When RSI > 75, the market may be overbought, indicating potential selling opportunities.

Power Hour Money StrategyDescription of the Pine Script Code: "Power Hour Money Strategy"
This Pine Script strategy, "Power Hour Money Strategy," is designed to trade based on the alignment of multiple time frames (month, week, day, and hour). The strategy aims to enter long or short positions depending on whether all selected time frames are in sync (all green for long positions, all red for short positions). Additionally, the script includes configurations for trading during specific sessions and automatically closing positions at the end of the trading day.
Core Features:
1. Time Frame Sync Check:
- The strategy evaluates whether the current price is higher than the opening price for the month, week, day, and hour to determine if each time frame is "green" (bullish) or "red" (bearish).
2. Session Control:
- The user can select between different trading sessions:
- "NY Session 9:30-11:30"
- "Extended NY Session 8-4"
- "All Sessions"
- Trades are only executed if the current time falls within the selected session.
3. Trailing Stop Mechanism:
- The strategy includes an optional trailing stop mechanism for both long and short positions.
- The trailing stop is configured with a percentage loss from the current price to protect gains.
4. End-of-Day Position Management:
- An option is provided to automatically close all positions at the end of the trading day (5:45 PM Eastern Time).
Detailed Code Breakdown:
1. Input Settings:
- **Session Selection**: Allows the user to choose the trading session.
- **End-of-Day Close**: Option to automatically close positions at the end of the day.
- **Trailing Stop Loss**: Enables or disables the trailing stop loss feature and sets the percentage for long and short positions.
2. Time Frame Calculations:
- The script uses `request.security` to get the opening prices for higher time frames (monthly, weekly, daily, and hourly).
- It compares the current close price to these opening prices to determine if each time frame is green or red.
3. Session Time Definitions:
- Defines the start and end times for the NY session (9:30-11:30 AM) and the extended session (8:00 AM - 4:00 PM).
4. Trade Execution:
- The strategy checks if all selected time frames are in sync and if the current time falls within the trading session.
- If all conditions are met, it enters a long or short position.
5. Trailing Stop Loss Implementation:
- Adjusts the stop price based on the trailing percentage and the current position's size.
- Automatically exits positions if the trailing stop condition is met.
6. End-of-Day Close Implementation:
- Uses a timestamp to check if the current time is 5:45 PM Eastern Time.
- Closes all positions if the end-of-day condition is met.
7. Plotting and Logging:
- Plots indicators to visualize the green/red status of each time frame.
- Logs information about the status of each time frame for debugging and analysis.
Example Usage:
Entering a Long Position: If the month, week, day, and hour are all green and the current time is within the selected session, a long position is entered.
Entering a Short Position: If the month, week, day, and hour are all red and the current time is within the selected session, a short position is entered.
Trailing Stop: Protects gains by exiting the position if the price moves against the set trailing stop percentage.
End-of-Day Close: Automatically closes all open positions at 5:45 PM Eastern Time if enabled.
This strategy is particularly useful for traders who want to ensure that multiple time frames are in alignment before entering a trade and who wish to manage positions effectively throughout the trading day with specific session controls and trailing stops.

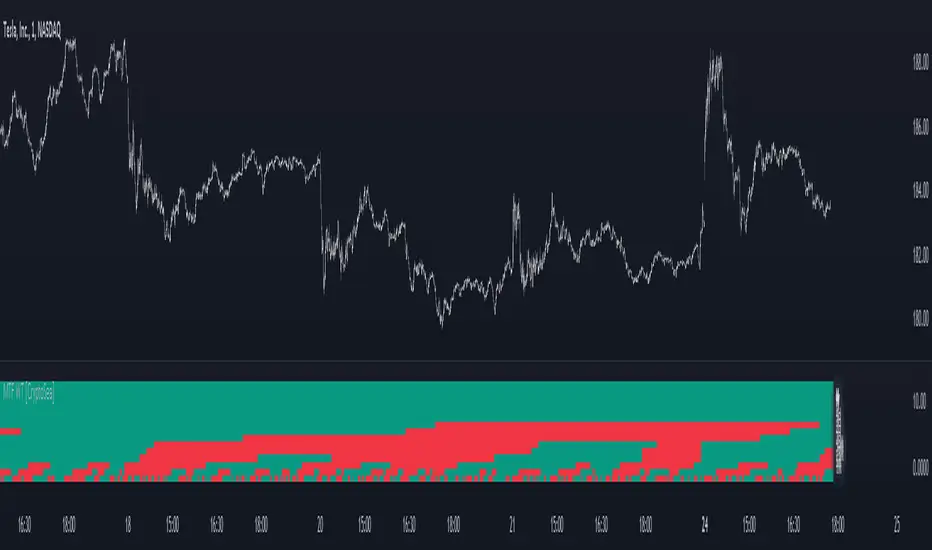
MTF WaveTrend [CryptoSea]The MTF WaveTrend Indicator is a sophisticated tool designed to enhance market analysis through multi-timeframe WaveTrend calculations. This tool is built for traders who seek to identify market momentum and potential reversals with higher accuracy.
In the example below, we can see all the choosen timeframes agree on bearish momentum.
Key Features
Multi-Timeframe WaveTrend Analysis: Tracks WaveTrend values across multiple timeframes to provide a comprehensive view of market momentum.
Customizable Colour Rules: Offers three different colour rules (Traditional, WT1 0 Rule, WT1 & WT2 0 Rule) to suit various trading strategies.
Timeframe Visibility Control: Allows users to enable or disable specific timeframes, providing flexibility in analysis.
Clear Visual Indicators: Uses color-coded squares and labels to clearly display WaveTrend status across different timeframes.
Candle Colouring Option: Includes a setting for neutral candle coloring to enhance chart readability.
This example shows what can happen when all timeframes start alligning with eachother.
How it Works
WaveTrend Calculation: Computes the WaveTrend oscillator by applying a series of exponential moving averages and scaling calculations.
Multi-Timeframe Data Aggregation: Utilizes the `request.security` function to gather and display WaveTrend values from various timeframes without repainting issues.
Conditional Plotting: Displays visual cues only when higher timeframes align with the selected timeframe, ensuring relevant and reliable signals.
Dynamic Colour Rules: Adjusts the indicator colors based on the chosen rule, whether it's a traditional crossover, WT1 crossing zero, or both WT1 & WT2 crossing zero.
Traditional: Colors are determined by the relationship between WT1 and WT2. If WT1 is greater than WT2, it is bullish (bullColour), otherwise bearish (bearColour).
WT1 0 Rule: Colors are based on whether WT1 is above or below zero. WT1 above zero is bullish (bullColour), below zero is bearish (bearColour).
WT1 & WT2 0 Rule: A more complex rule where both WT1 and WT2 need to be above zero for a bullish signal (bullColour) or both below zero for a bearish signal (bearColour). If WT1 and WT2 are not in agreement, a neutral color (neutralColour) is displayed.
This indicator will make sure that the lowest timeframe you can see data from will be the timeframe you are on. This is to avoid false signals as you cannot display 3 x 5 minute candles whilst looking at the 15 minute candle.
Application
Strategic Decision-Making: Assists traders in making informed decisions by providing detailed analysis of WaveTrend movements across different timeframes.
Trend Confirmation: Reinforces trading strategies by confirming potential reversals with multi-timeframe WaveTrend analysis.
Customized Analysis: Adapts to various trading styles with extensive input settings that control the display and sensitivity of WaveTrend data.
The MTF WaveTrend Indicator by is an invaluable addition to a trader's toolkit, offering depth and precision in market trend analysis to navigate complex market conditions effectively.
Lower Timeframe Volume BarsDescription:
The Lower Timeframe Volume Bars indicator enhances your TradingView experience by allowing you to visualize volume data from lower timeframes on your current chart. This powerful tool helps you gain deeper insights into volume trends and activity that are not immediately visible on higher timeframe charts. Specifically, it shows the volume data from the last bar of the selected lower timeframe.
Key Features:
Volume Bars from Lower Timeframes:
Display volume data from 1-minute or 1-second timeframes directly on higher timeframe charts, such as 15 minutes or 1 hour.
Each volume bar represents the aggregated volume from the lower timeframe within the selected higher timeframe period.
Enhanced Volume Analysis:
Gain a more detailed understanding of volume spikes and troughs that may be hidden in higher timeframe charts.
Identify potential market turning points and confirm trends with precise volume data.
Customizable Display:
Adjust the appearance of volume bars to fit your chart style and preferences.
Configure settings such as color, size, and positioning of volume bars for optimal visibility and clarity.
Seamless Integration:
Easily add the indicator to any chart in TradingView with a few clicks.
Works in conjunction with other technical indicators and tools to provide a comprehensive analysis environment.
How to Use:
Add the Lower Timeframe Volume Bars indicator to your chart.
Select the lower timeframe you wish to fetch volume data from (e.g., 1-minute or 1-second).
Customize the display settings to match your charting style.
Observe the volume bars overlaying your current chart to analyze volume activity across different timeframes, specifically showing the last bar's volume.
Use the detailed volume information to make informed trading decisions and enhance your market analysis.
Benefits:
Increased Clarity: See detailed volume activity that is often lost in higher timeframe aggregation.
Better Decision Making: Make more informed trading decisions with a clear view of volume trends and spikes.
Improved Trend Confirmation: Use lower timeframe volume data to confirm the strength and sustainability of market trends.
Enhance your trading strategy and gain a deeper understanding of market dynamics with the Lower Timeframe Volume Bars indicator. Visualize, analyze, and trade with confidence by leveraging detailed volume insights from lower timeframes.

TMB LevelsDescription:
Improved "Hourly Midline" indicator. It displays high, middle and low levels of every candle with specified timeframe (can be hourly, daily, or any other timeframe). You can change the source for the levels (either high and low of candle, or open and close of candle). Additionally, you can turn on the "Line chart", which essentially connects every midline, making a line chart of middle prices.
Parameters:
- Timeframe -> use data from this timeframe ("30" would mean 30 minutes, "60" would mean 1 hour, etc.)
- Source -> source for calculating the middle level
- Top -> parameters of the top level lines
- Middle -> parameters of the middle level lines
- Bottom -> parameters of the bottom level lines
- Line chart -> connect every midline, making a line chart

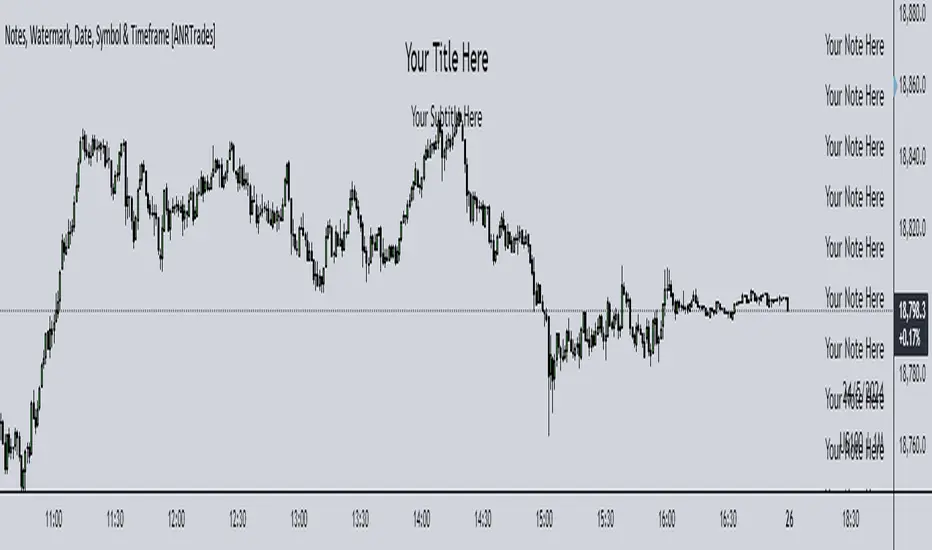
Watermark, Date, Symbol & Timeframe [ANR Trades]" Watermark, Date, Symbol & Timeframe " is a simple yet powerful TradingView indicator designed to provide essential information directly on your trading charts.
Key Features:
- Add a watermark with a title and subtitle to your charts. Customize the position, colour, and size to suit your preferences.
- View the current date, symbol, and timeframe directly on your chart.
This indicator is essential for traders who frequently save or share their chart images publicly who would want to watermark their chart as well as make it easier to know when it was, what symbol and what timeframe it was on.
Multi Timeframe RSI Buy Sell Strategy [TradeDots]The "Multi Timeframe RSI Buy/Sell Strategy" is a trading strategy that utilizes Relative Strength Index (RSI) indicators from multiple timeframes to provide buy and sell signals.
This strategy allows for extensive customization, supporting up to three distinct RSIs, each configurable with its own timeframe, length, and data source.
HOW DOES IT WORK
This strategy integrates up to three RSIs, each selectable from different timeframes and customizable in terms of length and source. Users have the flexibility to define the number of active RSIs. These selections visualize as plotted lines on the chart, enhancing interpretability.
Users can also manage the moving average of the selected RSI lines. When multiple RSIs are active, the moving average is calculated based on these active lines' average value.
The color intensity of the moving average line changes as it approaches predefined buying or selling thresholds, alerting users to potential signal generation.
A buy or sell signal is generated when all active RSI lines simultaneously cross their respective threshold lines. Concurrently, a label will appear on the chart to signify the order placement.
For those preferring not to display order information or activate the strategy, an "Enable backtest" option is provided in the settings for toggling activation.
APPLICATION
The strategy leverages multiple RSIs to detect extreme market conditions across various timeframes without the need for manual timeframe switching.
This feature is invaluable for identifying divergences across timeframes, such as detecting potential short-term reversals within broader trends, thereby aiding traders in making better trading decisions and potentially avoiding losses.
DEFAULT SETUP
Commission: 0.01%
Initial Capital: $10,000
Equity per Trade: 60%
RISK DISCLAIMER
Trading entails substantial risk, and most day traders incur losses. All content, tools, scripts, articles, and education provided by TradeDots serve purely informational and educational purposes. Past performances are not definitive predictors of future results.
TradeDots Stochastic Z-Score

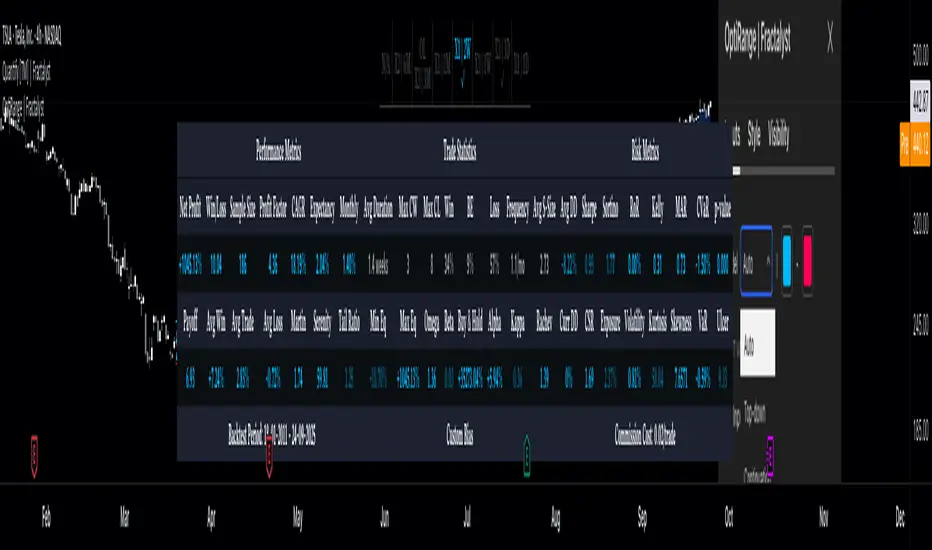
OptiRange | FractalystWhat’s the purpose of this indicator?
This indicator is designed to integrate probabilities with liquidity levels, while also providing a mechanical method for identifying market structure by using Fractals by Williams.
----
How does this indicator identify market structure?
This script identifies breaks of market structure by analyzing candle closures above or below swing levels.
As soon as a candle has closed above or below the initial swing on your charts, the script validates that there is at least one swing preceding the break before confirming it as a structural break.
Once a break is occured then it assigns a numeric ID to the break starting from 1 and draws two extremities: one as liquidity and the other as invalidation (LIQ/INV).
----
What do the extremities show us on the charts?
you'll see two clear extremities on your charts:
1. The first extremity represents the structural liquidity level. (LIQ)
2. The other extremity indicates the level that, if price breaks through it, results in a structural shift to the opposite side. (INV)
----
How does it calculate probabilities?
Each break of market structure, denoted as X, is assigned a unique ID, starting from X1 for the first break, X2 for the second, and so on.
The probabilities are calculated based on breaks holding, meaning price closing through the liquidity level, rather than invalidation. This probability is then divided by the total count of similar numeric breaks.
For example, if 75 out of 100 bullish X1s become X2, then the probability of X1 becoming X2 on your charts will be displayed as 80% in the following format: ⬆ 75%
----
What are the Fractal blocks?
Fractal blocks refer to the most extreme swing candle within the latest break. They can serve as significant levels for price rejection and may guide movements toward the next break, often in confluence with probability analysis for added confirmation.
If the price retraces back to a bullish fractal block, we aim to look for buy/long positions. Conversely, if the price retraces back to a bearish fractal block, we aim to look for sell/short positions.
----
What are mitigations?
Mitigations refer to specific price action occurrences identified by the script:
1- When the price reaches the most recent fractal block and confirms a swing candle, the script automatically draws a line from the swing to the fractal block bar and labels it with a checkmark.
1- If the price wicks through the invalidation level and then retraces back to the fractal block while forming a swing candle, the script labels this as a double mitigation on the chart.
This level will serve as the next potential invalidation level if a break occurs in the same direction.
----
What does the bottom table display?
The bottom table presents numeric breaks across multiple timeframes, with the text color indicating the trend direction. Enabling traders to assess the higher timeframes market trend without needing to switch between timeframes manually.
----
How to use the indicator?
1. Add "OptiRange | Fractalyst" to your TradingView chart.
2. Choose the pair you want to analyze or trade.
3. Start with the 12-month timeframe.
4. Use the table bias with the maximal settings to find the lowest timeframe that’s showing you the mitigation (✓)
5. Confirm that the probability of the current liquidity is higher than 50%.
6. Place your limit order at the Fibonacci level of 0.618 of the mitigation candle.
7. Set your stop-loss at the mitigation level.
8. Determine your take profit based on the liquidity of the current timeframe, or if possible, the liquidity of a higher timeframe in the same direction; otherwise, use the liquidity of the current timeframe.
9. Risk adjustment and Trade management based on your personal preferences.
Example:
----
User-input settings and customizations
----
What makes this indicator original?
- This script leverages Fractals, a fundamental concept in many trading methodologies.
- For a break to be considered valid, price must have at least two swings:
a swing high followed by a swing low for bullish breaks and a swing low follow by a swing high for bearish breaks.
- This means that each swing point is confirmed by the formation of two candles on its left and two candles on its right, totaling 5 candles for each swing high and swing low, thus requiring 10 candles overall. (This strict rule ensures a thorough assessment of market structure before confirming a break.)
- The script assigns a unique numerical ID to each break of structure, starting from 1.
This numbering system enables the script to calculate the probability of the most recent break becoming the next break, while also factoring in the trend direction.
- Additionally, this script provides insights into higher timeframes' break IDs in the bottom/top centre table, keeping traders informed about the overall higher timeframe picture.
- By integrating these methodologies, the script introduces a unique and systematic method for identifying market structure, thereby enhancing its originality in guiding trading decisions.
Terms and Conditions | Disclaimer
Our charting tools are provided for informational and educational purposes only and should not be construed as financial, investment, or trading advice. They are not intended to forecast market movements or offer specific recommendations. Users should understand that past performance does not guarantee future results and should not base financial decisions solely on historical data. By utilizing our charting tools, the buyer acknowledges that neither the seller nor the creator assumes responsibility for decisions made using the information provided. The buyer assumes full responsibility and liability for any actions taken and their consequences, including potential financial losses. Therefore, by purchasing these charting tools, the customer acknowledges that neither the seller nor the creator is liable for any unfavorable outcomes resulting from the development, sale, or use of the products.
The buyer is responsible for canceling their subscription if they no longer wish to continue at the full retail price. Our policy does not include reimbursement, refunds, or chargebacks once the Terms and Conditions are accepted before purchase.
By continuing to use our charting tools, the user acknowledges and accepts the Terms and Conditions outlined in this legal disclaimer.
Timeframe Marker - know when timeframes start/end
When you're on a lower timeframe, it's important to know which timeframes are starting/ending.
Timeframe Marker will display a bars that stack notifying you of your chosen timeframes.
For example, if you're on the one minute chart or another low timeframe, you'll be aware of the larger timeframes are about to begin or start.
It's always good to select the lowest timeframe first in ascending order so that the lowest bar is the lowest timeframe and bars that stack on top are larger timeframes.
The default timeframes are:
• 5 minutes (green)
• 15 minutes (yellow)
• 1 hour (orange)
• 4 hour (red)
• daily (blue)
• weekly (purple)
• monthly (gray)
If your chart's timeframe is higher than the timeframe marker you've selected, then it won't display a bar stack for that timeframe as it would normally display on every bar (this is to avoid clutter).
The future timeframe marks basically will offset to future timeframes. Set how many bars forward you'd like to see.

Fibonacci Timeframe Adaptive EMAThe "Fibonacci Timeframe Adaptive EMA" is a sophisticated trading indicator designed for the TradingView platform, leveraging the power of Exponential Moving Averages (EMAs) determined by Fibonacci sequence lengths to provide traders with dynamic market insights. This indicator overlays directly on the price chart, offering a unique blend of trend analysis, smoothing techniques, and timeframe adaptability, making it an invaluable tool for traders looking to enhance their technical analysis strategy.
Key Features
1. Fibonacci-Based EMA Lengths: Utilizes the Fibonacci sequence to select EMA lengths, incorporating natural mathematical ratios believed to be significant in financial markets. The available lengths range from 1 to 987, allowing for detailed trend analysis over various periods.
2. Multiple Smoothing Methods: Offers the choice between several smoothing techniques, including Simple Moving Average (SMA), Exponential Moving Average (EMA), Smoothed Moving Average (SMMA or RMA), Weighted Moving Average (WMA), and Volume Weighted Moving Average (VWMA). This versatility ensures that users can tailor the indicator to suit their analytical preferences.
3. Timeframe Adaptability: Features the ability to fetch and calculate EMAs from different timeframes, providing a multi-timeframe analysis within a single chart view. This adaptability gives traders a broader perspective on market trends, enabling more informed decision-making.
4. Dynamic Visualization Options: Traders can customize the display to suit their analysis needs, including toggling the visibility of Fibonacci EMA lines, EMA prices, and smoothed EMA lines. Additionally, forecast lines can be projected into the future, offering speculative insights based on current trends.
5. Ema Tail Visualization: An innovative feature allowing for the visualization of the 'tail' or the continuation of EMA lines, which can be particularly useful for identifying trend persistence or reversal points.
6. User-friendly Customization: Through a series of input options, traders can easily adjust the source data, Fibonacci lengths, smoothing method, and visual aspects such as line colors and transparency, ensuring a seamless integration into any trading strategy.
Application and Use Cases
The "Fibonacci Timeframe Adaptive EMA" indicator is designed for traders who appreciate the significance of Fibonacci numbers in market analysis and seek a flexible tool to analyze trends across different timeframes. Whether it's for scalping, day trading, or long-term investing, this indicator can provide valuable insights into price dynamics, trend strengths, and potential reversal points. Its adaptability makes it suitable for various asset classes, including stocks, forex, commodities, and cryptocurrencies.

EMA Cross Dashboard | Flux Charts💎 GENERAL OVERVIEW
Introducing our new Exponential Moving Average (EMA) Cross Dashboard! This dashboard let's you select a source for the calculation of the EMA of it, then let's you enter 2 lengths for up to 5 timeframes, plotting their crosses in the chart.
Features of the new EMA Cross Dashboard :
Shows EMA Crosses Across Up To 5 Different Timeframes.
Select Any Source, Including Other Indicators.
Customizable Dashboard.
📌 HOW DOES IT WORK ?
EMA is a widely used indicator within trading community, it is similar to a Simple Moving Average (SMA) but places more weight on recent prices, making it more reactive to current trends. Crosses of EMA lines can be helpful to determine strong bullish & bearish movements of an asset. This indicator shows finds crosses across 5 different timeframes in a dashboard and plots them in your chart for ease of use.
🚩UNIQUENESS
This dashboard cuts through the hassle of manual EMA cross calculations and plotting. It offers flexibility by allowing various data sources (even custom indicators) and customization through enabling / disabling individual timeframes. The clear visualization lets you see EMA crosses efficiently.
⚙️SETTINGS
1. Timeframes
You can set up to 5 timeframes & 2 lenghts to detect crosses for each timeframe here. You can also enable / disable them.
2. General Configuration
EMA Source -> You can select the source for the calculation of the EMA here. You can select sources from other indicators as well as more general sources like close, high and low price.

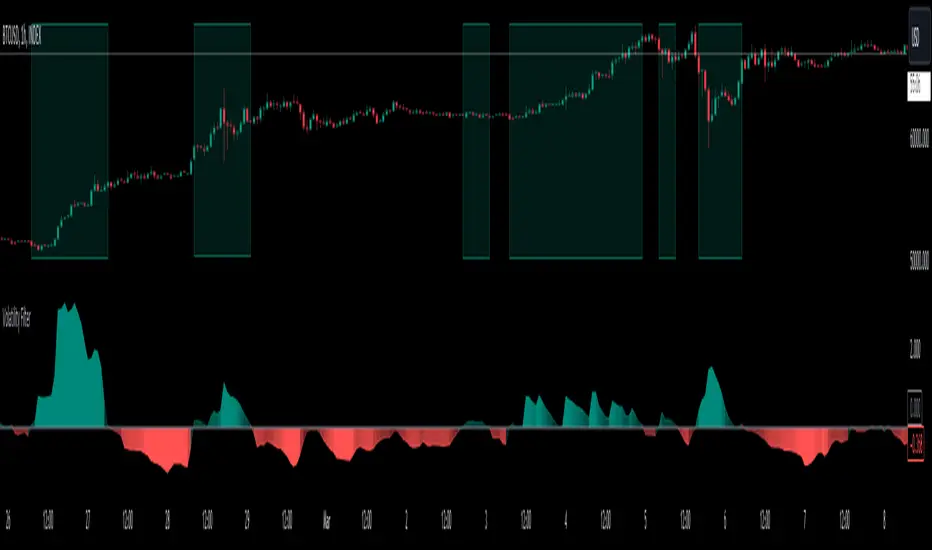
Volatility Filter v2VF v2 is a new iteration of my tool designed for traders who wish to gain a deeper understanding of market dynamics, specifically to distinguish periods of high volatility, which often correspond to strong market trends. By identifying these periods, traders can make more informed decisions, potentially leading to better trading outcomes.
Understanding Market Volatility:
At the heart of this script lies the concept of market volatility, a statistical measure reflecting the degree of variation in trading prices. Volatility is pivotal for traders; it provides insights into the market's emotional state, indicating periods of uncertainty or confidence. High volatility often correlates with strong trends, making it a critical indicator for trend-followers. By identifying when volatility crosses a certain threshold, traders can discern whether the market is likely to be in a trending phase or a more subdued, range-bound state.
How the Script Works:
The core functionality of the script revolves around a signal line that oscillates around a zero threshold. When the signal line is above zero, it indicates increased market volatility, suggesting the presence of a trend. The farther the oscillator deviates from zero, the stronger the implied trend. This mechanism enables traders to visually gauge market conditions and adjust their strategies accordingly.
Controlling the Indicator:
To cater to diverse trading styles and preferences, the script is equipped with several customizable settings:
Filter Threshold: This 'zero line' acts as the baseline for distinguishing between different volatility regimes. Crossing this threshold is a primary signal for changes in market volatility.
Moving Average Type: With over 30 types of moving averages to choose from, traders can select the one that best fits their analysis style. Each type offers a different perspective on price data, allowing for a tailored approach to trend identification.
Colorize Indicator: This feature enhances the visual representation of the indicator, making it easier to interpret. When enabled, the oscillator's color intensity varies with its proximity to the extremes, providing a quick visual cue about trend strength.
Advanced Settings – Length and Multiplier:
The script introduces an innovative approach to time frame analysis through its length and multiplier settings:
Length: This parameter sets the base period for all metrics within the script, similar to traditional indicators.
Multiplier: This unique feature differentiates the script by incorporating three distinct timeframes into the analysis: a lower timeframe, the main (current) timeframe, and a higher timeframe. The multiplier adjusts these timeframes relative to the main one. For instance, with a daily main timeframe and a multiplier of 2, the lower timeframe would be 12 hours, and the higher timeframe would be 2 days. This tri-timeframe approach aims to provide a more comprehensive volatility assessment.
Volatility Filter Indicators Section:
The script utilizes nine different, undisclosed metrics within its volatility filter. Traders have the flexibility to enable or disable these metrics based on their preferences, allowing for a customizable trading experience. Additionally, the script offers alert functionality for when the indicator crosses the threshold, either upwards or downwards, facilitating timely decision-making.
P.S
With better understanding of markets over time, I designed a new iteration of my volatility filter indicator. The second version provides faster, more precise way to analyze markets, but I also wanted to keep my first version untouched in case if some people find it better for their purposes. As I mentioned above, this version is calculated in a very different way from a previous one, so if you never tried it you can do it here
Multi Pivot (S/R) & Previous Period (OHLC)█ Multi Pivot (Support/Resistance) & Previous Period (Open/High/Low/Close)
The previous script was deleted because of a copyrighted word.
From JayRogers description.
█ Multi Pivot Selector
Allows you to set up to 3 distinct sets of pivots, each with their own resolution settings and the ability to select how many support|resistance levels are shown.
The maximum amount of S|R levels available varies with different pivot types, the options available are:
Traditional
Fibonacci
Woodie
Classic
Copyrighted word
Camarilla
Fibonacci Extended
█ Previous Period Levels
A simple but highly customisable display of previous higher time-frame OHLC values.
Customised resolution input which excludes time frames lower than 1 hour while extending the common higher reference inputs.
This script is based on JayRogers script, I only added some features so please check out his script.
I added the timeframe in the labels, in order to make it easier to differentiate when using multiple pivot set.
As well as making it possible to change the lines color of each pivot set separately.
Labels can now be displayed on each side (right, left and both) or just disabled.
The type of pivot can be shown on the right side.
Lines extension can be disabled and lines width value can be changed.
I also added another one of his script to display OHLC levels, I made similar changes.
Converted to Pine Script v5.
Previous Period Levels - X Alerts
Pivotal - Multi Pivot Selector (which was also deleted because of the copyrighted word)
