Gioteen-NormThe "Gioteen-Norm" indicator is a versatile and powerful technical analysis tool designed to help traders identify key market conditions such as divergences, overbought/oversold levels, and trend strength. By normalizing price data relative to a moving average and standard deviation, this indicator provides a unique perspective on price behavior, making it easier to spot potential reversals or continuations in the market.
The indicator calculates a normalized value based on the difference between the selected price and its moving average, scaled by the standard deviation over a user-defined period. Additionally, an optional moving average of this normalized value (Green line) can be plotted to smooth the output and enhance signal clarity. This dual-line approach makes it an excellent tool for both short-term and long-term traders.
***Key Features
Divergence Detection: The Gioteen-Norm excels at identifying divergences between price action and the normalized indicator value. For example, if the price makes a higher high while Red line forms a lower high, it may signal a bearish divergence, hinting at a potential reversal.
Overbought/Oversold Conditions: Extreme values of Red line (e.g., significantly above or below zero) can indicate overbought or oversold conditions, helping traders anticipate pullbacks or bounces.
Trend Strength Insight: The normalized output reflects how far the price deviates from its average, providing a measure of momentum and trend strength.
**Customizable Parameters
Traders can adjust the period, moving average type, applied price, and shift to suit their trading style and timeframe.
**How It Works
Label1 (Red Line): Represents the normalized price deviation from a user-selected moving average (SMA, EMA, SMMA, or LWMA) divided by the standard deviation over the specified period. This line highlights the relative position of the price compared to its historical range.
Label2 (Green Line, Optional): A moving average of Label1, which smooths the normalized data to reduce noise and provide clearer signals. This can be toggled on or off via the "Draw MA" option.
**Inputs
Period: Length of the lookback period for normalization (default: 100).
MA Method: Type of moving average for normalization (SMA, EMA, SMMA, LWMA; default: EMA).
Applied Price: Price type used for calculation (Close, Open, High, Low, HL2, HLC3, HLCC4; default: Close).
Shift: Shifts the indicator forward or backward (default: 0).
Draw MA: Toggle the display of the Label2 moving average (default: true).
MA Period: Length of the moving average for Label2 (default: 50).
MA Method (Label2): Type of moving average for Label2 (SMA, EMA, SMMA, LWMA; default: SMA).
**How to Use
Divergence Trading: Look for discrepancies between price action and Label1. A bullish divergence (higher low in Label1 vs. lower low in price) may suggest a buying opportunity, while a bearish divergence could indicate a selling opportunity.
Overbought/Oversold Levels: Monitor extreme Label1 values. For instance, values significantly above +2 or below -2 could indicate overextension, though traders should define thresholds based on the asset and timeframe.
Trend Confirmation: Use Label2 to confirm trend direction. A rising Label2 suggests increasing bullish momentum, while a declining Label2 may indicate bearish pressure.
Combine with Other Tools: Pair Gioteen-Norm with support/resistance levels, RSI, or volume indicators for a more robust trading strategy.
**Notes
The indicator is non-overlay, meaning it plots below the price chart in a separate panel.
Avoid using a Period value of 1, as it may lead to unstable results due to insufficient data for standard deviation calculation.
This tool is best used as part of a broader trading system rather than in isolation.
**Why Use Gioteen-Norm?
The Gioteen-Norm indicator offers a fresh take on price normalization, blending statistical analysis with moving average techniques. Its flexibility and clarity make it suitable for traders of all levels—whether you're scalping on short timeframes or analyzing long-term trends. By publishing this for free, I hope to contribute to the TradingView community and help traders uncover hidden opportunities in the markets.
**Disclaimer
This indicator is provided for educational and informational purposes only. It does not constitute financial advice. Always backtest and validate any strategy before trading with real capital, and use proper risk management.
기술적 분석

Swing Trade IndicatorThis is a Swing Trade Indicator that combines several technical indicators to analyze market conditions and generate trade signals. I've included two tables that provide real-time information to help you analyze the market and track trades: the Market Status Table and the Trade Tracking Table. These tables are overlaid on the TradingView chart and are customizable in terms of position and visibility.
Simple Moving Averages (SMAs):
Determines trend direction (e.g., bullish if fastMA > slowMA).
Calculates the average closing price over a set period:
fastMA: 21-period SMA (short-term trend).
slowMA: 50-period SMA (medium-term trend).
ultraSlowMA: 200-period SMA (long-term trend).
How:
ta.sma(close, fastLength) computes the SMA of the closing price over fastLength bars (similarly for slowLength and ultraSlowLength).
Volume Analysis:
Identifies potential liquidity spikes.
Measures trading volume to detect high activity.
Average volume over liquidityPeriod (20 bars).
Standard deviation of volume to set a dynamic threshold.
How:
avgVolume = ta.sma(volume, liquidityPeriod): Average volume.
volumeStdDev = ta.stdev(volume, liquidityPeriod): Volatility of volume.
highVolume = volume > avgVolume + volumeStdDev * volumeThresholdMultiplier: Flags high volume if it exceeds the average plus a multiplier (default 1.0) times the standard deviation.
Relative Strength Index (RSI):
Filters entries to avoid overextended markets.
Measures momentum and overbought/oversold conditions.
14-period RSI with thresholds at 60 (overbought) and 40 (oversold).
How:
rsiValue = ta.rsi(close, rsiLength) calculates RSI based on price changes over 14 bars.
Average Directional Index (ADX):
Gauges whether the trend is strong enough to trade.
Assesses trend strength.
14-period ADX.
How:
Calculates True Range (tr), Plus Directional Movement (plusDM), and Minus Directional Movement (minusDM).
Smooths these with ta.rma (Running Moving Average) over adxLength (14).
Computes plusDI and minusDI (directional indicators), then dx (difference), and finally adxValue = ta.rma(dx, adxLength) for trend strength.
Classifies as "Strong" (≥40), "Moderate" (≥20), or "Weak" (<20).
Moving Average Convergence Divergence (MACD) (Optional):
Optional filter for entry conditions if useMacdFilter is enabled.
Tracks momentum and trend changes.
Fast EMA (12), Slow EMA (26), Signal Line (9).
How:
= ta.macd(close, macdFastLength, macdSlowLength, macdSignalLength) computes the MACD components.
macdBullish = macdLine > signalLine: Bullish signal.
macdBearish = macdLine < signalLine: Bearish signal.
Liquidity Zones:
Confirms entries near key levels and suggests next trade setups.
Identifies support and resistance levels based on recent price extremes.
Dynamic levels over 20 bars (if useDynamicLevels is true).
How:
highLiquidityLevel1 = ta.highest(high, 20): Highest high in last 20 bars.
highLiquidityLevel2 = ta.highest(high , 20): Highest high from 20 to 40 bars ago.
highLiquidityLevel3 = ta.lowest(low, 20): Lowest low in last 20 bars.
highLiquidityLevel4 = ta.lowest(low , 20): Lowest low from 20 to 40 bars ago.
Upper and lower zones are derived (upperLevel, lowerLevel), with a midpoint between them.
How It Calculates Entries and Exits
Long Entry:
Basic Conditions (longEntry):
close > fastMA: Price is above the 21-period SMA.
fastMA > slowMA: Short-term trend is above medium-term trend (bullish).
rsiValue < rsiOverbought: RSI below 60 (not overbought).
(not useMacdFilter or macdBullish): If MACD filter is off, ignore it; if on, MACD must be bullish.
Confirmed Entry (confirmedLongEntry):
longEntry is true.
close >= highLiquidityLevel3 * 0.95 and close <= highLiquidityLevel3 * 1.05: Price is within 5% of the lower liquidity level (support).
Action: Sets currentPosition = 'long', records entry price and bar, plots a green triangle below the bar.
Short Entry:
Basic Conditions (shortEntry):
close < fastMA: Price is below the 21-period SMA.
fastMA < slowMA: Short-term trend is below medium-term trend (bearish).
rsiValue > rsiOversold: RSI above 40 (not oversold).
(not useMacdFilter or macdBearish): If MACD filter is off, ignore it; if on, MACD must be bearish.
Confirmed Entry (confirmedShortEntry):
shortEntry is true.
close <= highLiquidityLevel1 * 1.05 and close >= highLiquidityLevel1 * 0.95: Price is within 5% of the upper liquidity level (resistance).
Action: Sets currentPosition = 'short', records entry price and bar, plots a red triangle above the bar.
Exit Conditions
Note: The exit logic is defined but commented out in the script (//longExit and //shortExit), meaning it doesn’t automatically exit positions. It calculates stop-loss and take-profit levels for manual use:
Long Exit (if uncommented):
close < stopLossLevelLong: Price falls below stop-loss (entry price × (1 - 1.5%)).
close > takeProfitLevelLong: Price exceeds take-profit (entry price × (1 + 1.5% × 2.0)).
Short Exit (if uncommented):
close > stopLossLevelShort: Price rises above stop-loss (entry price × (1 + 1.5%)).
close < takeProfitLevelShort: Price falls below take-profit (entry price × (1 - 1.5% × 2.0)).
Suggested Levels: The script provides suggestedLongSL, suggestedLongTP, suggestedShortSL, and suggestedShortTP in the Market Status Table, based on liquidity levels rather than entry price, for manual exits.
Users Can Edit Settings:
Market Status Table Position: Dropdown (e.g., "top_right" to "bottom_left").
Trade Tracking Table Position: Dropdown (e.g., "bottom_right" to "middle_center").
Visibility Toggles (checkboxes):
Show Tables: Enable/disable tables (default: true).
Show Liquidity Zones: Not plotted but affects logic (default: true).
Show Entry Points: Show/hide entry triangles (default: true).
Use Dynamic Levels: Enable/disable liquidity zones (default: true).
Use MACD for Entry Filter: Add MACD to entry conditions (default: false).
Show MACD on Chart: Not implemented but reserved (default: false).
Indicator Periods:
Fast MA Length: Integer (default: 21, e.g., change to 10).
Slow MA Length: Integer (default: 50, e.g., change to 30).
Ultra Slow MA Length: Integer (default: 200, e.g., change to 100).
Liquidity Detection Period: Integer (default: 20, e.g., change to 10).
RSI Length: Integer (default: 14, e.g., change to 7).
ADX Length: Integer (default: 14, e.g., change to 20).
MACD Fast/Slow/Signal Length: Integers (default: 12/26/9, e.g., 9/21/5).
Thresholds:
Volume Threshold Multiplier: Float (default: 1.0, e.g., 1.5 for stricter high volume).
RSI Overbought: Integer (default: 60, e.g., 70).
RSI Oversold: Integer (default: 40, e.g., 30).
Stop Loss %: Float (default: 1.5, e.g., 2.0, range 0.1-10).
Take Profit Ratio: Float (default: 2.0, e.g., 3.0, range 1.0-5.0).
Liquidity Threshold (%): Float (default: 2.0, e.g., 1.5, range 0.5-5.0).

HEMA Trend Levels [AlgoAlpha]OVERVIEW
This script plots two Hull-EMA (HEMA) curves to define a color-coded dynamic trend zone and generate context-aware breakout levels, allowing traders to easily visualize prevailing momentum and identify high-probability breakout retests. The script blends smoothed price tracking with conditional box plotting, delivering both trend-following and mean-reversion signals within one system. It is designed to be simple to read visually while offering nuanced trend shifts and test confirmations.
█ CONCEPTS
The Hull-EMA (HEMA) is a hybrid moving average combining the responsiveness of short EMAs with the smoothness of longer ones. It applies layered smoothing: first by subtracting a full EMA from a half-length EMA (doubling the short EMA's weight), and then by smoothing the result again with the square root of the original length. This process reduces lag while maintaining clarity in direction changes. In this script, two HEMAs—fast and slow—are used to define the trend structure and trigger events when they cross. These crossovers generate "trend shift boxes"—temporary support or resistance zones drawn immediately after trend transitions—to detect price retests in the new direction. When price cleanly retests these levels, the script marks them as confirmations with triangle symbols, helping traders isolate better continuation setups. Color-coded bars further enhance visual interpretation: bullish bars when price is above both HEMAs, bearish when below, and neutral (gray) when indecisive.
█ FEATURES
Bullish and bearish bar coloring based on price and HEMA alignment.
Box plotting at each crossover (bullish or bearish) to create short-term decision zones.
Real-time test detection: price must cleanly test and bounce from box levels to be considered valid.
Multiple alert conditions: crossover alerts, test alerts, and trend continuation alerts.
█ USAGE
Use this indicator on any time frame and asset. Adjust HEMA lengths to match your trading style—shorter lengths for scalping or intraday, longer for swing trading. The shaded area between HEMAs helps visually define the current trend. Watch for crossovers: a bullish crossover plots a green support box just below price, and a bearish one plots a red resistance box just above. These zones act as short-term decision points. When price returns to test a box and confirms with strong rejection (e.g., closes above for bullish or below for bearish), a triangle symbol is plotted. These tests can signal strong trend continuation. For traders looking for clean entries, combining the crossover with a successful retest improves reliability. Alerts can be enabled for all key signals: trend shift, test confirmations, and continuation conditions, making it suitable for automated setups or discretionary traders tracking multiple charts.

Volume Profile & Smart Money Explorer🔍 Volume Profile & Smart Money Explorer: Decode Institutional Footprints
Master the art of institutional trading with this sophisticated volume analysis tool. Track smart money movements, identify peak liquidity windows, and align your trades with major market participants.
🌟 Key Features:
📊 Triple-Layer Volume Analysis
• Total Volume Patterns
• Directional Volume Split (Up/Down)
• Institutional Flow Detection
• Real-time Smart Money Tracking
• Historical Pattern Recognition
⚡ Smart Money Detection
• Institutional Trade Identification
• Large Block Order Tracking
• Smart Money Concentration Periods
• Whale Activity Alerts
• Volume Threshold Analysis
📈 Advanced Profiling
• Hourly Volume Distribution
• Directional Bias Analysis
• Liquidity Heat Maps
• Volume Pattern Recognition
• Custom Threshold Settings
🎯 Strategic Applications:
Institutional Trading:
• Track Big Player Movements
• Identify Accumulation/Distribution
• Follow Smart Money Flow
• Detect Institutional Trading Windows
• Monitor Block Orders
Risk Management:
• Identify High Liquidity Windows
• Avoid Thin Market Periods
• Optimize Position Sizing
• Track Market Participation
• Monitor Volume Quality
Market Analysis:
• Volume Pattern Recognition
• Smart Money Flow Analysis
• Liquidity Window Identification
• Institutional Activity Cycles
• Market Depth Analysis
💡 Perfect For:
• Professional Traders
• Volume Profile Traders
• Institutional Traders
• Risk Managers
• Algorithmic Traders
• Smart Money Followers
• Day Traders
• Swing Traders
📊 Key Metrics:
• Normalized Volume Profiles
• Institutional Thresholds
• Directional Volume Split
• Smart Money Concentration
• Historical Patterns
• Real-time Analysis
⚡ Trading Edge:
• Trade with Institution Flow
• Identify Optimal Entry Points
• Recognize Distribution Patterns
• Follow Smart Money Positioning
• Avoid Thin Markets
• Capitalize on Peak Liquidity
🎓 Educational Value:
• Understand Market Structure
• Learn Volume Analysis
• Master Institutional Patterns
• Develop Market Intuition
• Track Smart Money Flow
🛠️ Customization:
• Adjustable Time Windows
• Flexible Volume Thresholds
• Multiple Timeframe Analysis
• Custom Alert Settings
• Visual Preference Options
Whether you're tracking institutional flows in crypto markets or following smart money in traditional markets, the Volume Profile & Smart Money Explorer provides the deep insights needed to trade alongside the biggest players.
Transform your trading from retail guesswork to institutional precision. Know exactly when and where smart money moves, and position yourself ahead of major market shifts.
#VolumeProfile #SmartMoney #InstitutionalTrading #MarketAnalysis #TradingView #VolumeAnalysis #CryptoTrading #ForexTrading #TechnicalAnalysis #Trading #PriceAction #MarketStructure #OrderFlow #Liquidity #RiskManagement #TradingStrategy #DayTrading #SwingTrading #AlgoTrading #QuantitativeTrading

High and Low in a Given Date/Time RangeThis Pine Script v5 indicator plots horizontal lines at both the highest and lowest price levels reached within a user-defined date/time range.
Description:
Inputs:
The user specifies a start and an end date/time by providing the year, month, day, hour, and minute for each. These inputs are converted into timestamps based on the chart’s timezone.
How It Works:
Timestamp Conversion: The script converts the provided start and end dates/times into timestamps using the chart’s timezone.
Bar Check: It examines every bar and checks if the bar’s timestamp falls between the start and end timestamps.
Price Updates:
If a bar’s time is within the specified range, the indicator updates the highest price if the current bar's high exceeds the previously recorded high, and it updates the lowest price if the current bar's low is lower than the previously recorded low.
Drawing Lines:
A red horizontal line is drawn at the highest price, and a green horizontal line is drawn at the lowest price. Both lines start from the first bar in the range and extend dynamically to the current bar, updating as new high or low values are reached.
End of Range: Once a bar's time exceeds the end timestamp, the lines stop updating.
This tool offers a clear and straightforward way to monitor key price levels during a defined period without any extra fluff.

Diamond PatternDiamond Pattern Indicator
This indicator is designed to detect the Diamond Pattern, a technical formation that often signals potential trend reversals. The diamond pattern can lead to strong price movements, making it a valuable tool for traders.
Features:
✅ Automatic Detection – Identifies diamond patterns on the chart.
✅ Trend Reversal Signals – Highlights potential price direction changes.
✅ Multi-Timeframe Compatibility – Works across all timeframes.
✅ User-Friendly – Simple to use with no complex settings required.
How to Use:
1. Add the indicator to your chart.
2. Monitor for the formation of a Diamond Pattern.
3. Use the breakout direction to guide your trading decisions.

Range Breakout Signals [AlgoAlpha]OVERVIEW
This script detects range-bound market conditions and breakout signals using a combination of volatility compression and volume imbalance analysis. It identifies zones where price consolidates within a defined range and highlights potential breakout points with visual markers. Traders can use this to spot market transitions from ranging to trending phases, aiding in decision-making for breakout strategies.
CONCEPTS
The script measures volatility by comparing the ratio of the simple moving average (SMA) of price movements to their median value. When volatility drops below a threshold, the script assumes a range-bound market. It then tracks the cumulative volume of buying and selling pressure to assess breakout strength. The approach is based on the idea that market consolidation often precedes strong moves, and volume distribution can provide clues on the breakout direction.
FEATURES
Range Detection : Uses a volatility filter to identify low-volatility zones and marks them on the chart with shaded boxes.
Volume Imbalance Analysis : Evaluates cumulative up and down volume over a confirmation period to assess directional bias.
Breakout Signals : When price exits a detected range, the script plots breakout markers. A ▲ symbol indicates a bullish breakout, and a ▼ symbol indicates a bearish breakout. Additional "+" markers indicate strong volume imbalance favoring the breakout direction.
Adaptive Timeframe Volume Analysis : The script dynamically adjusts its volume calculation based on the chart’s timeframe, ensuring reliable signal generation across different trading conditions.
Alerts : Notifies traders when a new range is detected or when a breakout occurs, allowing for automated monitoring.
USAGE
Traders can use this script to identify potential trade setups by entering positions when price breaks out of a detected range. For breakout confirmation, traders can look at volume imbalance cues—bullish breakouts with strong buying volume may indicate sustained moves, while weak volume breakouts may lead to false signals. This script is particularly useful for breakout traders, range traders seeking to fade breakouts, and those looking to automate trade alerts in volatile markets.

Neural Pulse System [Alpha Extract]Neural Pulse System (NPS)
The Neural Pulse System (NPS) is a custom technical indicator that analyzes price action through a probabilistic lens, offering a dynamic view of bullish and bearish tendencies.
Unlike traditional binary classification models, NPS employs Ordinary Least Squares (OLS) regression with dynamically computed coefficients to produce a smooth probability output ranging from -1 to 1.
Paired with ATR-based bands, this indicator provides an intuitive and volatility-aware approach to trend analysis.
🔶 CALCULATION
The Neural Pulse System utilizes OLS regression to compute probabilities of bullish or bearish price action while incorporating ATR-based bands for volatility context:
Dynamic Coefficients: Coefficients are recalculated in real-time and scaled up to ensure the regression adapts to evolving market conditions.
Ordinary Least Squares (OLS): Uses OLS regression instead of gradient descent for more precise and efficient coefficient estimation.
ATR Bands: Smoothed Average True Range (ATR) bands serve as dynamic boundaries, framing the regression within market volatility.
Probability Output: Instead of a binary result, the output is a continuous probability curve (-1 to 1), helping traders gauge the strength of bullish or bearish momentum.
Formula:
OLS Regression = Line of best fit minimizing squared errors
Probability Signal = Transformed regression output scaled to -1 (bearish) to 1 (bullish)
ATR Bands = Smoothed Average True Range (ATR) to frame price movements within market volatility
🔶 DETAILS
📊 Visual Features:
Probability Curve: Smooth probability signal ranging from -1 (bearish) to 1 (bullish)
ATR Bands: Price action is constrained within volatility bands, preventing extreme deviations
Color-Coded Signals:
Blue to Green: Increasing probability of bullish momentum
Orange to Red: Increasing probability of bearish momentum
Interpretation:
Bullish Bias: Probability output consistently above 0 suggests a bullish trend.
Bearish Bias: Probability output consistently below 0 indicates bearish pressure.
Reversals: Extreme values near -1 or 1, followed by a move toward 0, may signal potential trend reversals.
🔶 EXAMPLES
📌 Trend Identification: Use the probability output to gauge trend direction.
📌Example: On a 1-hour chart, NPS moves from -0.5 to 0.8 as price breaks resistance, signaling a bullish trend.
Reversal Signals: Watch for probability extremes near -1 or 1 followed by a reversal toward 0.
Example: NPS hits 0.9, price touches the upper ATR band, then both retreat—indicating a potential pullback.
📌 Example snapshots:
Volatility Context: ATR bands help assess whether price action aligns with typical market conditions.
Example: During low volatility, the probability signal hovers near 0, and ATR bands tighten, suggesting a potential breakout.
🔶 SETTINGS
Customization Options:
ATR Period – Defines lookback length for ATR calculation (shorter = more responsive, longer = smoother).
ATR Multiplier – Adjusts band width for better volatility capture.
Regression Length – Controls how many bars feed into the coefficient calculation (longer = smoother, shorter = more reactive).
Scaling Factor – Adjusts the strength of regression coefficients.
Output Smoothing – Option to apply a moving average for a cleaner probability curve

Destroyer LifeDestroyer Life Strategy - High-Frequency Long & Short Trading
Overview:
The Destroyer Life strategy is an advanced cryptocurrency trading algorithm designed for high-frequency execution on the 15-second timeframe. It combines CRT (Candle Range Trend) and Turtle Soup trading logic with multi-timeframe analysis to optimize entries and exits for both long and short trades. This strategy is specifically optimized for high-volatility crypto pairs, such as SOL/USD on MEXC, ensuring precise execution with minimal drawdown.
Key Features:
15-Second Timeframe Execution: Optimized for ultra-short-term trading.
Long & Short Strategy: Simultaneously identifies profitable buy and sell opportunities.
CRT & Turtle Soup Logic: Leverages price action patterns for enhanced trade accuracy.
Higher Timeframe Analysis (HTF): Incorporates liquidity zones, fair value gaps (FVG), and breaker blocks for context-aware trading.
Dynamic Position Sizing: Uses an adjustable leverage multiplier for risk-controlled trade sizing.
Commission Optimization: Ensures profitability even with trading fees.
Strict Risk Management: Implements exit conditions based on liquidity structure and trend reversals.
Strategy Performance (Backtested on SOL/USD - MEXC):
Overall Profitability: ~80% win rate in backtesting.
Net Profit: $3,151.12 (6.30% ROI).
Gross Profit: $3,795.68 (7.59%).
Gross Loss: $644.56 (1.29%).
Long Trades Profit: $1,459.05 (2.92%).
Short Trades Profit: $1,692.07 (3.38%).
Commission Paid: $924.82.
Minimum Trade Holding Period: 1-minute cooldown between trades.
Trading Logic:
Entry Conditions:
Long Trades: Triggered when the price enters a liquidity void and aligns with higher timeframe bullish bias.
Short Trades: Triggered when price approaches a resistance level with bearish higher timeframe confluence.
CRT & Turtle Soup Patterns: Identifies reversals by analyzing breakout and fake-out structures.
Exit Conditions:
Long Positions Close: Upon price exceeding a 3.88% profit threshold or reversing below an HTF structure.
Short Positions Close: Upon reaching a similar 3.88% threshold or showing strong bullish signals.
Dynamic Position Sizing:
Uses a leverage-based calculation that adapts trade size based on volatility.
Liquidity Awareness:
Tracks Mitigation Blocks (MB), Fair Value Gaps (FVG), Buy/Sell-Side Liquidity (BSL/SSL) to determine optimal execution.
Best Use Cases:
Scalpers & High-Frequency Traders: Those looking for rapid trade execution with short holding periods.
Crypto Traders Focused on Low Timeframes: Optimized for 15-second price action.
Traders Utilizing Liquidity Concepts: Built to exploit liquidity traps and inefficiencies.
Risks & Considerations:
High-Frequency Execution Requires Low Latency: Ensure your broker or exchange supports fast order execution.
Backtested Results May Vary: Real-time performance depends on market conditions.
Commission & Fees Impact Profits: Consider exchanges with low fees to maximize strategy efficiency.
Final Thoughts:
The Destroyer Life Strategy is designed for serious traders looking to take advantage of high-volatility markets with a structured, liquidity-based approach. By combining price action, liquidity concepts, and adaptive risk management, it provides a solid framework for executing high-probability trades on crypto markets.
🚀 Ready to take your trading to the next level? Try Destroyer Life today and dominate the markets!

Breakout and Retest Signals [AlgoAlpha]OVERVIEW
This script detects breakout and retest signals by identifying key pivot points in price action and analyzing their relationship with historical swing highs and lows. It highlights breakout structures using ATR-based tolerance levels and volume analysis to confirm potential trend continuations or reversals. The script marks significant price levels with dynamic boxes and dashed lines to help traders visualize breakout and retest areas effectively.
CONCEPTS
The script relies on pivot point analysis, a technique used to identify significant price levels where the market has previously reversed. It dynamically tracks a set number of recent swing highs and lows, allowing traders to see if the price is revisiting a previously significant level. The concept of breakouts and retests is widely used in technical analysis to determine potential entry points. A breakout occurs when the price moves beyond a resistance or support level, and a retest happens when the price returns to test that level before continuing in the breakout direction. This script enhances that analysis by incorporating ATR-based tolerance levels, ensuring that price zones are not too large.
FEATURES
Breakout and Retest Markings : Highlights breakout and retest areas with shaded boxes, allowing traders to visualize where price action is confirming key levels.
Volume Delta and Ratio : Analyzes volume at breakout levels to gauge the strength of the move, displaying volume delta information for additional context. The script also displays the ratio of selling to buying at the retest along traders to make better judgement on their entries.
Multi-Timeframe Adaptability : Dynamically adjusts volume analysis to align with the appropriate lower timeframe, ensuring reliable volume comparisons.
Alerts for Breakout and Retest Events : Traders can receive real-time notifications when bullish or bearish breakout retests are detected.
USAGE
This script is best suited for traders looking to identify strong breakout and retest setups across different timeframes. Users can customize the pivot detection period and swing point memory to adjust sensitivity based on their trading style. The ATR length and multiplier allow further refinement of breakout tolerance, reducing noise in volatile markets. The breakout zones are displayed as shaded boxes, where traders can assess whether a price retest is occurring under favorable conditions. Alerts can be set to notify traders of potential trade opportunities.

Fibonacci Pivot Points & Previous D,W&M Highs/LowsIndicator Overview
This indicator combines Fibonacci Pivot Points with previous high and low levels for different timeframes (day, week, month). It plots these levels on the chart to provide traders with key support and resistance areas, making it easier to identify potential trading opportunities.
Features
Fibonacci Pivot Points:
The indicator calculates pivot points based on the high, low, and close prices.
Fibonacci levels are used to determine support (S1, S2, S3, S4, S5) and resistance (R1, R2, R3, R4, R5) levels.
Users can customize the Fibonacci levels for both support and resistance.
Previous Highs and Lows:
The indicator plots previous day, week, and month high and low levels.
Each of these lines can be customized in terms of visibility, color, and width.
This helps traders to see key historical levels that might act as support or resistance in the future.
Inputs and Customization:
Fibonacci Time Frame:
Users can select the timeframe for calculating the pivot points (Daily, Weekly, Monthly).
Fibonacci Levels:
Customizable input fields for each Fibonacci level (R1, R2, R3, R4, R5, S1, S2, S3, S4, S5).
Previous High/Low Lines:
Day Lines:
Options to show or hide previous day's high/low lines.
Customizable color and width for these lines.
Week Lines:
Options to show or hide previous week's high/low lines.
Customizable color and width for these lines.
Month Lines:
Options to show or hide previous month's high/low lines.
Customizable color and width for these lines.
Technical Calculations:
Fibonacci Pivot Points:
Calculated as:
pp = (High + Low + Close) / 3
S1 = pp - ((High - Low) * Fibonacci Level)
R1 = pp + ((High - Low) * Fibonacci Level)
Previous High/Low Levels:
Uses request.security to fetch previous high and low values for the selected timeframe.
Plotted using line.new to draw lines across the chart.
Plotting:
The indicator plots Fibonacci Pivot Points and previous high/low lines on the chart, using distinct colors for each level.
Customizable transparency and linewidths make it easier to visually interpret the levels.
This indicator is particularly useful for traders who rely on technical analysis to identify key support and resistance levels, offering a blend of historical data and Fibonacci-based predictions.
Feel free to ask if you have any specific questions or need further adjustments!

Heatmap Suite [PhenLabs]📊 Heatmap Suite
Version: PineScript™ v6
📌 Description
The Heatmap Suite is an advanced technical analysis tool that combines multiple density calculation methods with dynamic visualization to identify significant price levels and trading activity zones. It features a sophisticated analysis system that processes price and volume data through various kernel methods, providing traders with insights into market structure, support/resistance zones, and potential price reaction areas.
🚀 Points of Innovation:
Multi-method density calculation incorporating three distinct approaches
Adaptive visualization system with dynamic color gradients
Real-time dashboard with key market metrics
Significant level detection with automatic threshold adjustment
🚨 Important🚨
🔸Comprehensive tooltips included in the PhenLabs dashboard for in depth guidance
🔧 Core Components
Density Analysis: Multiple calculation methods for price distribution assessment
Heat Mapping: Dynamic visualization of price congestion zones
Level Detection: Automatic identification of significant price levels
Dashboard System: Real-time market metrics and analysis
🔥 Key Features
The indicator provides comprehensive analysis through:
Kernel Density: Traditional balanced view of price distribution
Exponential Kernel: Time-weighted analysis emphasizing recent price action
Volume-Weighted: Focus on high-volume price areas
Significant Levels: Automatic detection of important price zones
Heat Distribution: Color-coded visualization of price congestion
🎨 Visualization
Heat Zones: Shows intensity of price activity
Significant Lines: Key level indicators
Color Gradients: Indicates density strength
Dashboard Display: Real-time metrics
Dynamic Opacity: Reflects density intensity
📖 Usage Guidelines
The indicator offers several customization options:
Basic Settings:
Calculation Method: Choose between three density calculation approaches
Lookback Period: Analysis timeframe adjustment
Zone Count: Price range division granularity
Heat Sensitivity: Contrast adjustment for visualization
🎛️ Visual Settings:
Dashboard Size: Text size customization
Position: Dashboard placement options
Color Scheme: Heat map gradient visualization
Level Display: Significant price zone indicators
✅ Best Use Cases:
Identify strong support/resistance zones through high-density areas
Spot potential price reversal zones at significant levels
Analyze price congestion patterns
Monitor real-time changes in market structure
⚠️ Limitations
Requires sufficient historical data
Computational intensity increases with longer lookback periods
Heat sensitivity needs adjustment based on market conditions
Dashboard placement may need adjustment based on price action
💡 What Makes This Unique
Multi-method Analysis: Three distinct calculation approaches
Adaptive Visualization: Dynamic color gradient system
Real-time Metrics: Comprehensive dashboard display
Automatic Level Detection: Significant price zone identification
Memory-efficient Design: Optimized calculation methods
🔬 How It Works
The indicator processes market data through four main components:
1. Density Calculation:
Processes price and volume data
Applies selected kernel method
Generates density distribution
2. Heat Mapping:
Converts density values to color gradients
Updates visualization in real-time
Displays price congestion zones
3. Level Detection:
Identifies significant price levels
Applies threshold filtering
Marks important zones
4. Dashboard Updates:
Calculates real-time metrics
Updates display components
Provides market context
💡Note:
The indicator performs best with adequate historical data and proper sensitivity settings. Its sophisticated density analysis provides valuable insights into market structure beyond traditional support/resistance indicators.

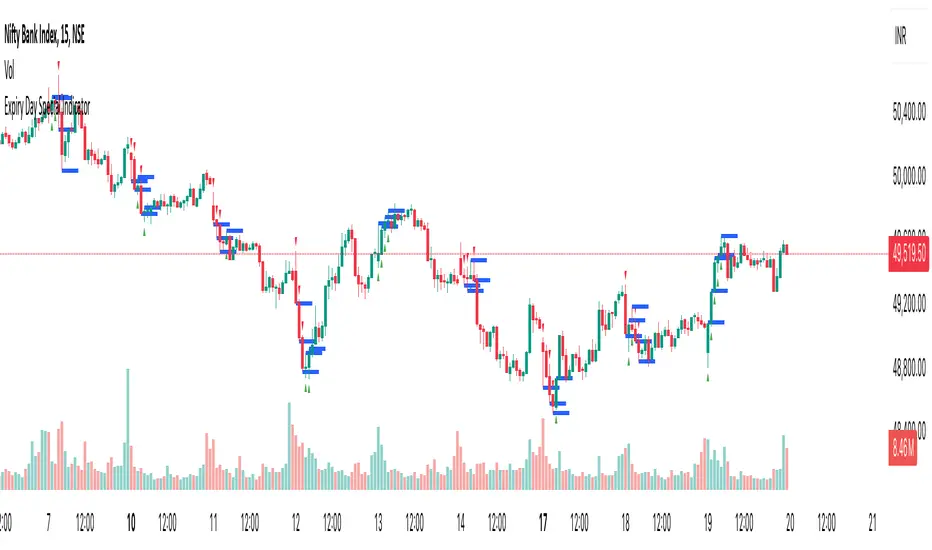
Expiry Day Special IndicatorExpiry Day Special Indicator
The Expiry Day Special Indicator is designed to detect catalytic price action patterns that commonly occur between 9:15 AM to 10:15 AM (IST) in the Nifty & Bank Nifty markets but not limited to these specific markets. While these patterns are particularly useful on expiry days, they are not limited to expiry trading alone. They can also be applied on other trading days when similar conditions arise, making them versatile for intraday traders.
How It Works
This indicator scans for bullish and bearish price action patterns within the first trading hour and plots potential buy and sell signals based on key market structures.
• Bearish Patterns: Identifies strong rejection zones and weakness in price action to signal potential short trades.
• Bullish Patterns: Recognizes reversal formations that indicate potential long trade opportunities.
• Time Filter: The setup is valid only between 9:15 AM - 10:15 AM (IST) to focus on high-impact market moves.
Why This Indicator?
1. Specialized for Nifty & Bank Nifty – Designed specifically for Indian markets.
2. Early Trend Identification – Helps traders capture moves early in the session.
3. Works Beyond Expiry Days – Although optimized for expiry trading, it can also detect similar patterns on regular days.
📌 Note: This indicator does not provide trading advice; always use proper risk management.
Liquidity Sweep Filter [AlgoAlpha]Unlock a deeper understanding of market liquidity with the Liquidity Sweep Filter by AlgoAlpha. This indicator identifies liquidity sweeps, highlighting key price levels where large liquidations have occurred. By visualizing major and minor liquidation events, traders can better anticipate potential reversals and market structure shifts, making this an essential tool for those trading in volatile conditions.
Key Features :
🔍 Liquidity Sweep Detection – Identifies and highlights areas where liquidity has been swept, distinguishing between major and minor liquidation events.
📊 Volume Profile Integration – Displays a volume profile overlay, helping traders spot high-activity price zones where the market is likely to react.
📈 Trend-Based Filtering – Utilizes an adaptive trend detection algorithm to refine liquidity sweeps based on market direction, reducing noise.
🎨 Customizable Visualization – Modify colors, thresholds, and display settings to tailor the indicator to your trading style.
🔔 Alerts for Liquidity Sweeps & Trend Changes – Stay ahead of the market by receiving alerts when significant liquidity events or trend shifts occur.
How to Use:
🛠 Add the Indicator : Add the Liquidity Sweep Filter to your chart and configure the settings based on your preferred sensitivity. Adjust the major sweep threshold to filter out smaller moves.
📊 Analyze Liquidity Zones and trend direction : Look for liquidation levels where large buy or sell stops have been triggered. Major sweeps indicate strong reactions, while minor sweeps show gradual liquidity absorption. You can also see which levels are high in liquidity by the transparency of the levels.
🔔 Set-Up Alerts : Use the in-built alerts so you don't miss a trading opportunity
How It Works :
The Liquidity Sweep Filter detects liquidity events by tracking swing highs and lows (defined as a pivot where neighboring candles are lower/higher than it) where traders are likely to have placed stop-loss orders. It evaluates volume and price action, marking areas where liquidity has been absorbed by the market. Additionally, the integrated trend filter ensures that only relevant liquidity sweeps are highlighted based on market direction, lows in an uptrend and highs in a downtrend. The trend filter works by calculating a basis, and defining trend shifts when the closing price crosses over the upper or lower bands.The included volume profile further enhances analysis by displaying key trading zones where price may react.

Advanced Support & Resistance [Alpha Extract]🔶 AE - Advanced Support & Resistance
A sophisticated yet user-friendly tool designed to enhance your trading analysis by accurately identifying and plotting key support and resistance levels. Built on a unique pivot-based detection algorithm, this indicator provides clear visual cues in real time, helping traders stay ahead of potential market reversals and breakouts.
🔶 Pivot-Based Detection
Leverages pivot highs and lows along with a configurable threshold to filter out overlapping levels. This method helps the script stand out from simpler support/resistance indicators by focusing on the most significant price zones.
🔶 Multi-Timeframe Analysis
Pulls higher-timeframe data to ensure that critical levels remain visible and properly scaled, regardless of your current chart view. This prevents distortion and offers a more comprehensive perspective of market structure.
🔶 Break Signal Alerts
Generates breakout or breakdown signals whenever the price crosses above or below a detected level—labeled as RB (Resistance Break) or SB (Support Break)—so traders can quickly spot shifts in momentum or trend.
🔶 Customizable Parameters
Fine-tune sensitivity and appearance—adjust pivot bar settings, lookback periods, thresholds, and the maximum number of plotted levels to match your trading style and preferences.
// === USER INPUTS ===
pivotLeft = input.int(15, "Left Pivot Bars", minval=1)
pivotRight = input.int(15, "Right Pivot Bars", minval=1)
lookback = input.int(200, "Lookback Period", minval=50)
threshold = input.float(0.2, "Price Threshold %", minval=0.1, step=0.1)
maxLevels = input.int(10, "Maximum Levels", minval=1)
📊How It Works
🔶 Identifying Pivots
The script scans for pivot highs and lows within a user-defined range of bars (Left Pivot Bars and Right Pivot Bars). Each pivot is evaluated against a proximity threshold, ensuring that similar nearby levels are combined into a single zone rather than cluttering the chart.
// === SUPPORT & RESISTANCE DETECTION ===
ph = ta.pivothigh(high, pivotLeft, pivotRight)
pl = ta.pivotlow(low, pivotLeft, pivotRight)
🔶Automatic Updates & Removal
Levels that remain untested or break too frequently are automatically removed based on the configured lookback period, keeping your chart focused on the most relevant support/resistance zones.
🔶Fixed Scaling
Through the use of higher-timeframe anchoring, the indicator maintains consistent plot lines that won’t distort when you zoom in or out. This approach ensures you always see crucial levels clearly.
🔶Entry and Exit Points
Pinpoint potential entry and exit opportunities based on how price interacts with these zones.
🔶Risk Management
Place stop-loss and take-profit orders around these levels to manage trade risk more effectively.
🔶Trend Confirmation
Observe how price respects or breaks levels to confirm ongoing trends or detect early signs of reversal.
🔶Sensitivity Adjustment
Control pivot bar width (pivotLeft and pivotRight) and the proximity threshold to focus on major or minor price zones.
🔶Visualization Options
Adjust line colors, styles, and thickness to align with your charting preferences.
🔶Maximum Levels
Limit the number of displayed levels to keep your chart clean and free of unnecessary clutter.

Range Filtered Trend Signals [AlgoAlpha]Introducing the Range Filtered Trend Signals , a cutting-edge trading indicator designed to detect market trends and ranging conditions with high accuracy. This indicator leverages a combination of Kalman filtering and Supertrend analysis to smooth out price fluctuations while maintaining responsiveness to trend shifts. By incorporating volatility-based range filtering, it ensures traders can differentiate between trending and ranging conditions effectively, reducing false signals and enhancing trade decision-making.
:key: Key Features
:white_check_mark: Kalman Filter Smoothing – Minimizes market noise while preserving trend clarity.
:bar_chart: Supertrend Integration – A dynamic trend-following mechanism for spotting reversals.
:fire: Volatility-Based Range Detection – Detects trending vs. ranging conditions with precision.
:art: Color-Coded Trend Signals – Instantly recognize bullish, bearish, and ranging market states.
:gear: Customizable Inputs – Fine-tune Kalman parameters, Supertrend settings, and color themes to match your strategy.
:bell: Alerts for Trend Shifts – Get real-time notifications when market conditions change!
:tools: How to Use
Add the Indicator – Click the star icon to add it to your TradingView favorites.
Analyze Market Conditions – Observe the color-coded signals and range boundaries to identify trend strength and direction.
Use Alerts for Trade Execution – Set alerts for trend shifts and market conditions to stay ahead without constantly monitoring charts.
:mag: How It Works
The Kalman filter smooths price fluctuations by dynamically adjusting its weighting based on market volatility. It helps remove noise while keeping the signal reactive to trend changes. The Supertrend calculation is then applied to the filtered price data, providing a robust trend-following mechanism. To enhance signal accuracy, a volatility-weighted range filter is incorporated, creating upper and lower boundaries that define trend conditions. When price breaks out of these boundaries, the indicator confirms trend continuation, while signals within the range indicate market consolidation. Traders can leverage this tool to enhance trade timing, filter false breakouts, and identify optimal entry/exit zones.

Iron Bot Statistical Trend Filter📌 Iron Bot Statistical Trend Filter
📌 Overview
Iron Bot Statistical Trend Filter is an advanced trend filtering strategy that combines statistical methods with technical analysis.
By leveraging Z-score and Fibonacci levels, this strategy quantitatively analyzes market trends to provide high-precision entry signals.
Additionally, it includes an optional EMA filter to enhance trend reliability.
Risk management is reinforced with Stop Loss (SL) and four Take Profit (TP) levels, ensuring a balanced approach to risk and reward.
📌 Key Features
🔹 1. Statistical Trend Filtering with Z-Score
This strategy calculates the Z-score to measure how much the price deviates from its historical mean.
Positive Z-score: Indicates a statistically high price, suggesting a strong uptrend.
Negative Z-score: Indicates a statistically low price, signaling a potential downtrend.
Z-score near zero: Suggests a ranging market with no strong trend.
By using the Z-score as a filter, market noise is reduced, leading to more reliable entry signals.
🔹 2. Fibonacci Levels for Trend Reversal Detection
The strategy integrates Fibonacci retracement levels to identify potential reversal points in the market.
High Trend Level (Fibo 23.6%): When the price surpasses this level, an uptrend is likely.
Low Trend Level (Fibo 78.6%): When the price falls below this level, a downtrend is expected.
Trend Line (Fibo 50%): Acts as a midpoint, helping to assess market balance.
This allows traders to visually confirm trend strength and turning points, improving entry accuracy.
🔹 3. EMA Filter for Trend Confirmation (Optional)
The strategy includes an optional 200 EMA (Exponential Moving Average) filter for trend validation.
Price above 200 EMA: Indicates a bullish trend (long entries preferred).
Price below 200 EMA: Indicates a bearish trend (short entries preferred).
Enabling this filter reduces false signals and improves trend-following accuracy.
🔹 4. Multi-Level Take Profit (TP) and Stop Loss (SL) Management
To ensure effective risk management, the strategy includes four Take Profit levels and a Stop Loss:
Stop Loss (SL): Automatically closes trades when the price moves against the position by a certain percentage.
TP1 (+0.75%): First profit-taking level.
TP2 (+1.1%): A higher probability profit target.
TP3 (+1.5%): Aiming for a stronger trend move.
TP4 (+2.0%): Maximum profit target.
This system secures profits at different stages and optimizes risk-reward balance.
🔹 5. Automated Long & Short Trading Logic
The strategy is built using Pine Script®’s strategy.entry() and strategy.exit(), allowing fully automated trading.
Long Entry:
Price is above the trend line & high trend level.
Z-score is positive (indicating an uptrend).
(Optional) Price is also above the EMA for stronger confirmation.
Short Entry:
Price is below the trend line & low trend level.
Z-score is negative (indicating a downtrend).
(Optional) Price is also below the EMA for stronger confirmation.
This logic helps filter out unnecessary trades and focus only on high-probability entries.
📌 Trading Parameters
This strategy is designed for flexible capital management and risk control.
💰 Account Size: $5000
📉 Commissions and Slippage: Assumes 94 pips commission per trade and 1 pip slippage.
⚖️ Risk per Trade: Adjustable, with a default setting of 1% of equity.
These parameters help preserve capital while optimizing the risk-reward balance.
📌 Visual Aids for Clarity
To enhance usability, the strategy includes clear visual elements for easy market analysis.
✅ Trend Line (Blue): Indicates market midpoint and helps with entry decisions.
✅ Fibonacci Levels (Yellow): Highlights high and low trend levels.
✅ EMA Line (Green, Optional): Confirms long-term trend direction.
✅ Entry Signals (Green for Long, Red for Short): Clearly marked buy and sell signals.
These features allow traders to quickly interpret market conditions, even without advanced technical analysis skills.
📌 Originality & Enhancements
This strategy is developed based on the IronXtreme and BigBeluga indicators,
combining a unique Z-score statistical method with Fibonacci trend analysis.
Compared to conventional trend-following strategies, it leverages statistical techniques
to provide higher-precision entry signals, reducing false trades and improving overall reliability.
📌 Summary
Iron Bot Statistical Trend Filter is a statistically-driven trend strategy that utilizes Z-score and Fibonacci levels.
High-precision trend analysis
Enhanced accuracy with an optional EMA filter
Optimized risk management with multiple TP & SL levels
Visually intuitive chart design
Fully customizable parameters & leverage support
This strategy reduces false signals and helps traders ride the trend with confidence.
Try it out and take your trading to the next level! 🚀

Fibonacci Volume Profiles [AlgoAlpha]Unlock a deeper understanding of price action with the Fibonacci Volume Profiles indicator by AlgoAlpha! This powerful tool blends Fibonacci retracement levels with customizable volume profiles, helping traders identify high-probability areas of support, resistance, and accumulation. Designed for both continuous dynamic levels and custom time periods, this indicator is a must-have for traders seeking confluence in market structure analysis.
🔑 Key Features
📈 Dual Mode Selection : Choose between Continuous Fibonacci levels, which adapt dynamically to pivots, or a Custom Period mode, where you set your own start and end points.
📊 Integrated Volume Profile : Visualize volume distributions at key Fibonacci retracement levels, revealing areas of strong buying/selling interest.
🎨 Customizable Colors & Transparency : Adjust Fibonacci level colors, fill zones, and profile transparency for a visually clear experience.
🔍 Profile Resolution & Scaling : Control the number of price levels and width of the volume profile for detailed market insights.
🛠 Extendable Levels : Optionally extend Fibonacci levels to the right of the chart for better visualization of future price interaction.
📌 How to Use
Add the Indicator: Click on the star icon to add it to your favorites and apply it to your TradingView chart.
Analyze The Market: Observe how price interacts with Fibonacci levels alongside the volume profile to confirm support/resistance zones. Switch between custom range or continuous mode to align the tool with your trading style.
⚙️ How It Works
The indicator calculates pivot highs/lows dynamically (or uses user-defined time periods) to plot Fibonacci retracement levels. It then builds a volume profile by analyzing historical volume data, grouping it into price bins to highlight volume-heavy zones. The Point of Control (PoC) is identified as the level with the highest traded volume, acting as a key price magnet. The color-coded Fibonacci levels help traders spot retracement zones, while the volume profile confirms strength or weakness in those areas.

Adaptive Resonance Oscillator [AlgoAlpha]Introducing the Adaptive Resonance Oscillator , an advanced momentum-based oscillator designed to dynamically adjust to changing market conditions. This innovative indicator detects market frequency through a Hilbert Transform approach, adapting in real-time to identify overbought and oversold conditions with improved accuracy. With built-in divergence detection, trend analysis, and customizable smoothing, this tool is perfect for traders looking to refine their entries and exits based on adaptive oscillation mechanics.
🚀 Key Features :
🔹 Adaptive Frequency Detection – Uses Hilbert Transform principles to dynamically determine market cycle length for precise oscillator calculation.
⚙️ Customizable Smoothing – Option to apply a Hull Moving Average (HMA) for enhanced signal clarity.
📈 Divergence Detection – Identifies bullish and bearish divergences with visual markers, helping traders spot early trend reversals.
🟢 Overbought & Oversold Signals – Highlights extreme momentum conditions with adjustable thresholds.
🔔 Real-Time Alerts – Get notified for crossovers, divergences, and strong trend shifts directly on your TradingView chart.
🎨 Fully Customizable Appearance – Modify colors, divergence sensitivity, and smoothing options to fit your trading style.
🛠 How to Use :
Add the Adaptive Resonance Oscillator to your TradingView chart by clicking the ★ to favorite it.
Monitor the Charts , switch between smoothed and I smoothed modes to identify trend and price swings, use divergences and reversal signals for potential entry/exits.
Set alerts for bullish/bearish crossovers and divergence signals to stay ahead of market moves.
⚙ How It Works :
The indicator begins by applying a Hilbert Transform frequency estimation to the price series, identifying the dominant market cycle length. This is used to calculate a period for the RSI that matches its resonant frequency with the dominant market frequency, dynamically adjusting the Oscillator. The oscillator then applies an optional Hull Moving Average (HMA) smoothing for signal refinement. Additionally, the indicator scans for bullish and bearish divergences by comparing oscillator movements against price action, plotting signals accordingly. When overbought/oversold conditions or divergence events occur, alerts are triggered to notify the trader in real time.

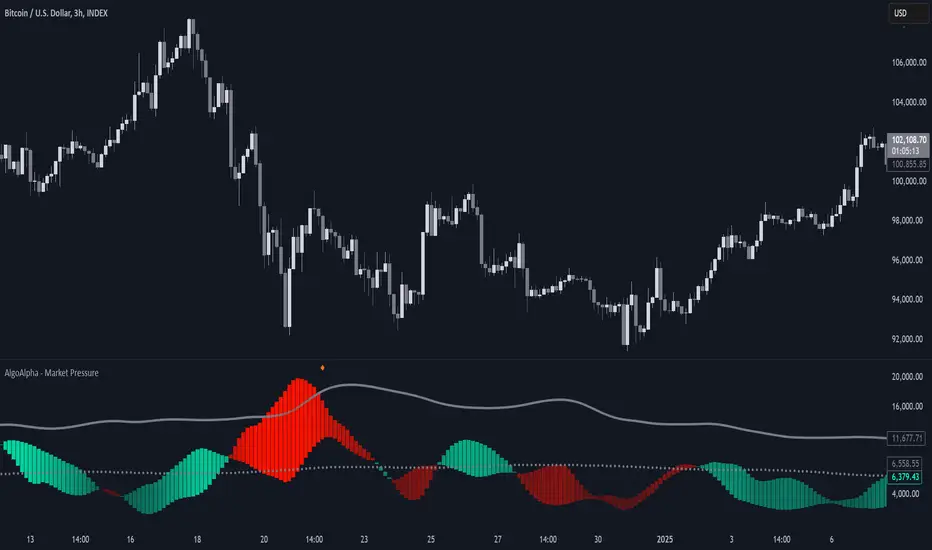
Market Pressure Index [AlgoAlpha]The Market Pressure Index is a cutting-edge trading tool designed to measure and visualize bullish and bearish momentum through a unique blend of volatility analysis and dynamic smoothing techniques. This indicator provides traders with an intuitive understanding of market pressure, making it easier to identify trend shifts, breakout opportunities, and key moments to take profit. Perfect for scalpers and swing traders looking for a strategic edge in volatile markets.
Key Features:
🔎 Bullish and Bearish Volatility Separation : Dynamically calculates and displays bullish and bearish momentum separately, helping traders assess market direction with precision.
🎨 Customizable Appearance: Set your preferred colors for bullish and bearish signals to match your chart's theme.
📊 Deviation-Based Upper Band : Tracks extreme volatility levels using a configurable deviation multiplier, highlighting potential breakout points.
📈 Real-Time Signal Alerts : Provides alerts for bullish and bearish crossovers, as well as take-profit signals, ensuring you never miss key market movements.
⚡ Gradient-Based Visualization : Uses color gradients to depict the intensity of market pressure, making it easy to spot changes in momentum at a glance.
How to Use:
Add the Indicator : Add the Market Pressure Index to your TradingView chart by clicking the star icon. Customize inputs like the pressure lookback period, deviation settings, and colors to fit your trading style.
Interpret the Signals : Monitor the bullish and bearish momentum columns to gauge market direction. Look for crossovers to signal potential trend changes.
Take Action : Use alerts for breakouts above the upper band or for take-profit levels to enhance your trade execution.
How It Works:
The Market Pressure Index separates bullish and bearish momentum by analyzing price movement (close vs. open) and volatility. These values are smoothed using Hull Moving Averages (HMA) to highlight trends while minimizing noise. A deviation-based upper band dynamically tracks market extremes, signaling breakout zones. Color gradients depict the intensity of momentum, offering a clear, visually intuitive representation of market pressure. Alerts are triggered when significant crossovers or take-profit conditions occur, giving traders actionable insights without constant chart monitoring.
RSI & DPO support/resistanceThis indicator combines the Relative Strength Index (RSI) to identify overbought and oversold conditions with the Detrended Price Oscillator (DPO) to highlight support and resistance levels.
Unlike traditional indicators that display these metrics in a separate window, this tool integrates them directly onto the main price chart.
This allows for a more cohesive analysis, enabling traders to easily visualize the relationship between price movements and momentum indicators in one unified view.
How to Use It:
Identify Overbought and Oversold Conditions:
Look for RSI values above 70 to identify overbought conditions, suggesting a potential price reversal or pullback. Conversely, RSI values below 30 indicate oversold conditions, which may signal a potential price bounce or upward movement.
Analyze Support and Resistance Levels:
Observe the DPO lines on the main chart to identify key support and resistance levels. When the price approaches these levels, it can provide insights into potential price reversals or breakouts.
Combine Signals for Trading Decisions:
Use the RSI and DPO signals together to make informed trading decisions. For example, if the RSI indicates an overbought condition while the price is near a resistance level identified by the DPO, it may be a good opportunity to consider selling or taking profits.
Monitor Divergences:
Watch for divergences between the RSI and price movements. If the price is making new highs while the RSI is not, it could indicate weakening momentum and a potential reversal.
Set Alerts:
Consider setting alerts for when the RSI crosses above or below the overbought or oversold thresholds, or when the price approaches significant support or resistance levels indicated by the DPO.
Practice Risk Management:
Always use proper risk management techniques, such as setting stop-loss orders and position sizing, to protect your capital while trading based on these indicators.
By following these steps, traders can effectively utilize this indicator to enhance their market analysis and improve their trading strategies.

Smart Money Breakout Signals [AlgoAlpha]Introducing the Smart Money Breakout Signals, a cutting-edge trading indicator designed to identify key structural shifts and breakout opportunities in the market. This tool leverages a blend of smart money concepts like Break of Structure (BOS) and Change of Character (CHoCH) to provide traders with actionable insights into market direction and potential entry or exit points.
Key Features :
✨ Market Structure Analysis : Automatically detects and labels BOS and CHoCH for trend confirmation and reversals.
🎨 Customizable Visualization : Tailor bullish and bearish colors for breakout lines and signals to suit your preferences.
📊 Dynamic Take-Profit Targets : Displays three tiered take-profit levels based on breakout volatility.
🔔 Real-Time Alerts : Stay ahead of the game with notifications for bullish and bearish breakouts.
📋 Performance Dashboard : Monitor signal statistics, including win rates and total signals, directly on your chart.
How to Use :
Add the Indicator : Add the script to your favourites ⭐ and customize settings like market structure horizon and confirmation type.
Monitor Breakouts : Observe BOS and CHoCH labels to identify potential trend shifts. Use the breakout lines and tiered take-profit levels to plan trades effectively.
Set Alerts : Enable alerts for bullish or bearish breakouts to act on opportunities without constant monitoring.
How It Works :
The indicator identifies market structure by analyzing pivot highs and lows over a user-defined time horizon. A breakout is confirmed based on either candle closes or wicks surpassing previous pivot points. Upon detection, the script generates signals with breakout lines and calculates take-profit targets based on the distance from the breakout level. A built-in dashboard tracks performance metrics like total signals and win rates, giving traders real-time feedback on strategy effectiveness.

MultiTime Stochastics ProMultiTime Stochastics Pro
This indicator is an enhanced version of the stochastic indicator, featuring two separate stochastics. This functionality allows you to adjust the settings and time frame for each stochastic individually, enabling a more precise analysis of market fluctuations.
The Double Stochastic indicator enables you to simultaneously analyze the market in different time frames with two separate stochastics. One of the standout features of this indicator is that when the chart's time frame changes, each stochastic is displayed according to the time set for it and does not change in other time frames. This feature provides greater flexibility and accuracy in market analysis.
How the Indicator Works
This indicator calculates two separate stochastics:
The first stochastic (K1 and D1) with its own specific time frame and settings.
The second stochastic (K2 and D2) with a different time frame and settings.
These two stochastics are displayed simultaneously on one chart, and overbought and oversold lines are also included.
How to Use
Parameter Adjustment : Adjust the parameters K1 Length, D1 Smoothing, and K1 Time Frame as desired. Do the same for the second stochastic.
Signal Analysis : Analyze buy and sell signals based on the stochastic values and the overbought and oversold lines.
Advantages
Greater Precision : With two separate stochastics, you can follow market fluctuations with greater accuracy.
Flexibility : The ability to individually set the time frame and parameters for each stochastic makes this indicator highly flexible.
Stronger Signals : The simultaneous display of two stochastics allows you to receive stronger buy and sell signals.
Multi-time frame Analysis : The ability to analyze the market in different time frames simultaneously.
This indicator is suitable for traders seeking more precise and flexible market analysis tools. I hope these explanations help you publish your indicator in the best possible way!
