Chartology Strategy+🔍 Chartology Strategy+
This tool provides a comprehensive way for users to analyze trend levels and access other Matrix features across selected tickers and timeframes. Results can be tailored by strategy, with the option to filter displayed tickers based on custom user‑defined rules.
Bullish & Bearish Entry Signal (Safe & Scalping).
Entry Level, SL, T-SL & Two TP Levels (Based on Possible Movement).
Dashboard Table for Easy Presentation of All Levels.
Timeframe Scanner for Current Signal (Trend) on Different Timeframes.
Gap Up & Gap Down for Untraded Price Marking.
Institutional Candles for High Volume and Big Price Movement.
Neutral Candle for Low Volume and Small Price Movement.
Supply Demand (Based on Swing High & Low).
Mega Trend Band (Based on HMA) for Overall Trend.
🟢 Bullish & Bearish Entry Signals
Shows the expected direction of the symbol. It shows Bullish and Bearish direction mark on Chart. Entry Level is Closing of the Candle.
Input Settings
Signal Type: Safe
Appears after a proper trend confirmation.
Low frequency, fewer signals, but more reliable.
Best for swing traders who want strong confirmation before entering.
Signal Type: Scalping
Appears frequently during small downward moves.
High frequency, quick signals for short-term trades.
Best for intraday
Traders who want multiple opportunities in small movements.
🎯 Entry Level, SL, T-SL & TP Levels
Generated based on price movement and trend range.
Levels on Chart
Entry Level: Closing price of the candle where the signal appears.
SL (Stop Loss): Maximum risk allowed for the trade.
TSL (Trailing SL): Dynamic SL to reduce risk and lock profits.
Level 01: First TP level with 1:1 risk-reward ratio. Used for partial booking.
Level 02: Final TP level for full exit.
Input Settings
Levels: You can Increase or Decrease Level Amount for the Level 2.
Risk: You can Increase or Decrease Stop Loss (SL).
📊 Dashboard Table for Easy Presentation of All Levels.
Displays all key levels and metrics in one place:
Metrics
Symbol Name Shows the name of the current chart (e.g., NIFTY, BANKNIFTY).
Bar Age Displays the How many candles (Bars) before Latest signal appears.
Entry Shows the entry level where the latest bullish or bearish signal was generated.
Level 1 (TP1) First target level, based on 1:1 risk-reward ratio. Used for partial booking to secure profits.
Level 2 (TP2) Final target level where you can exit the remaining position.
SL (Stop Loss) Shows the maximum risk limit for the trade. Helps you control losses.
MTM (Mark to Market) Shows the difference between CMP and Entry Level. Helps track how far price has moved since entry.
P&L (Profit & Loss) Shows the difference between Entry and Target Level achieved. Helps measure actual gain or loss.
Date & Time Displays when the latest bullish or bearish signal was generated. Helps check how old or fresh the signal is.
Timeframe Scanner or Current Signal (Trend) on Different Timeframes. Shows the current signal across multiple timeframes.
Row 1 Fixed signals for 1M and 3M.
Row 2 Any 2 Custom Timeframes chosen in input settings.
Traders use this to confirm signals across different timeframes before entering trades. Example If the Day trend is bullish but the 15M chart shows bearish, many traders avoid that trade.
🚦 Gap Up & Gap Down for Untraded Price Marking.
Marks untraded price zones where price may react.
Gap Up & Down Flag Mark
Gap Up: Bullish Bias, Marked Green flag, plotted when candle opens above previous high.
Gap Down: Bearish Bias, Marked as Red flag, plotted when candle opens below previous low.
Input Settings
Enable / Disable from Chart
Threshold: Minimum gap size Threshold to detect
🟡 Institutional Candles for High Volume and Big Price Movement
Indicate strong price movement with high volume.
Marking
Displayed as Yellow Body Candles
Helps identify zones where big players are active.
Input Settings
Enable / Disable from Chart
Body %: Compare of Open & Close with High & Low
Size %: Compare Total Candle Size from Past Range
Volume %: Compare Total Candle Volume from Past Range
⚪ Neutral Candle for Low Volume and Small Price Movement
Shows low volume and minimal price movement.
Marking
Displayed as Hollow Body Candles
Traders usually avoid trading during these candles.
Input Settings
Enable / Disable from Chart.
Candle %: Compare Size of candles.
Volume %: Compare Volume of Candles from Previous Range.
🟥🟩 Supply Demand Zones (Based on Swing High & Low).
Based on swing highs and lows to identify possible reversals.
Zones
🟥Supply Zone: Near swing high, marked with Light Red Zone.
🟩Demand Zone: Near swing low, marked with Light Green Zone.
Input Settings:
Bars Left: How many past Bars Swing will Calculate.
Bars Right: After How many Bars, Zone will plot.
Max Zones: Number of Supply or Demand Zone want to plot on Chart
Delete Breaked Zones: Want to see Disappeared Zone, Uncheck it.
Extend Right: Want to see till End of the Chart, Uncheck it.
📈 Mega Trend Band (Based on HMA) for Overall Trend
Based on HMA (Hull Moving Average) to show overall trend and Help in Filters out trades against the main trend.
Working
Price above band → Bullish trend
Price below band → Bearish trend
Input Setting
Enable / Disable from Chart
HMA Period Setting: 45
👓 How to Use All together for Better Confidence.
🔍Watch for the New Entry icon on the chart.
Find New Signals with help of Automated Alerts.
Check Entry Level, SL, Level 1 and Level 2 (TP2).
Verify Date & Time → how fresh the signal is. Signal not too old.
🧭 Signal is not Self Sufficient for Good Accuracy. So, we suggest a few rules.
Cross‑Check Current Signal with Timeframe Scanner. Trade only when smaller timeframe aligns with bigger trend. (e.g., If Day = Bullish ▲ but 15M = Bearish ▼, avoid entry. Trend may not be stronger.)
Validate with Market Context of Gap. (e.g., If new signal came on Gap Up / Gap Down, avoid entry. Price may reverse.)
Zone Awareness Use Supply Demand zones to refine entries/exits and avoid false signals. (e.g., Entry: If any zone is available between Entry and Level 01, Avoid trade until Zone breaked, Exit: If Zone create between the trade, modify SL according to T-SL and wait.
Trend Filter of overall direction. (e.g., If Mega Trend Band Bullish and Trend is Bearish, Avoid the Trade.)
🕵🏻 Quick Checklist Before Trade
Bullish or Bearish signal?
Dashboard Table shows fresh entry?
SL defined and acceptable risk?
Timeframe Scanner aligned?
No Neutral candle interference?
Institutional candle or Gap supports move?
Supply/Demand zone not against trade?
✅ All Okay - Go for the ENTRY
Set a Proper Entry Point
Always respect SL, Good Trader Never avoid it.
Book partial profits at Level 1, It secure your Trade.
Keep Modifying your SL, According to T-SL Level.
On Level 2, Exit remaining All position for full profit.
📊 Healthy Trading Tips
Risk Small: Never risk more than 1–2% per trade.
Size Smart: Adjust position size to volatility and account size.
Diversify: Don’t put all money in one asset/sector.
Plan Ahead: Set entry, exit, and stop‑loss before trading.
Trade Less: Focus on quality setups, avoid overtrading.
Use Both Analyses: Combine technical charts with fundamental news/events.
Control Emotions: Stick to strategy, avoid fear/greed.
Journal Trades: Record reasons, outcomes, and lessons.
Stay Informed: Track economic calendars and global events.
Take Breaks: Step away after wins/losses to reset.
🎯 Advanced Discipline
Partial Exit: Book profits in stages (e.g., 50% at 1:1, 50% at Final Level).
Check News: Avoid trading during major announcements.
No Tweaks: Don’t change plan mid‑trade; wait for SL/TP.
Fixed Rules: Trade with fixed risk, fixed gains.
No Averaging Losses: Close bad trades, don’t add more.
Keep Learning: Evolve strategy with market changes.
Believe: Trust your plan and process.
Backtest: Practice setups until they’re second nature.
Daily Routine: Pre‑market Preparation, post‑market review.
Optimize Setup: Clean workspace, fast platform, no distractions.
Track Metrics: Win rate, average reward, expectancy, time of day, setup performance.
Trader Identity: Follow rules; money is a byproduct.
Liquidity Check: Avoid low‑volume instruments.
Respect Trend: Trade with momentum, not against it.
Avoid Over‑Leverage: Keep leverage low, avoid margin unless planned.
Risk Disclaimer
This content, including any tools, software, datafeeds, indicators, or scanners, is provided strictly for charting, educational, informational, and paper‑trading purposes only. It does not constitute investment advice, buy/sell recommendations, or real‑money trading strategies.
Not Advisors: We are not registered as investment advisors or research analysts.
Charting Only: Use is limited to testing strategies and evaluation; any application to real trading is at the user’s sole risk.
No Liability: No liability is accepted for financial loss, trading loss, or damages arising from use of the tools or data.
Data Limitations: Market data may be delayed, inaccurate, or incomplete. Past or hypothetical performance is not indicative of future results.
Signals Disclaimer: Automated signals are for evaluation only and should not be treated as accurate or real trading instructions.
High Risk: Trading and investing involve substantial risk and can result in losses beyond the initial capital.
Independent Judgment: Users must exercise independent judgment and consult licensed professionals before making financial decisions
⚠️ Final Note: Trading is speculative and may not be suitable for all investors. Use only risk capital and never invest money you cannot afford to lose.
✅ Always remember🧠 my 3R Rule💡: If the money💰 is yours then, RISK⚖️, REWARD🏆 and REGRET😔 are solely yours. 🔥
Target

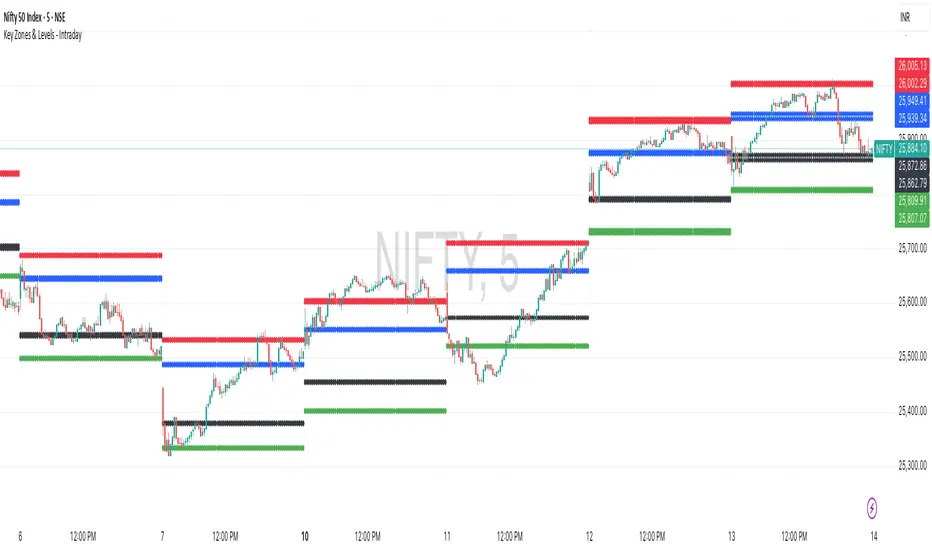
Key Zones & Levels - IntradayThis indicator provides key zones and levels for the day.
The levels are constant for the day and no re-painting.
The levels are plotted at 9:15pm IST for Indian stock market trading.
Use these levels with RSI for a perfect reversal setup with small stop loss.
Work perfectly for all types of market - Indices, stocks, commodity, futures.
Join my channel to support me - whatsapp.com
ATR SL/TP Precision Zones (Dots)ATR SL/TP Precision Zones (Dots) is a volatility-based tool designed to help traders set accurate Stop Loss and Take Profit levels based on real market volatility — not fixed pips or emotion.
This indicator uses ATR (Average True Range) multiplied by 1.2 to calculate dynamic distance bands.
Instead of drawing a ribbon or channel, it places simple dots above and below each candle:
Upper Dot (Green) → Suggested Take Profit / Price Stretch Zone
Lower Dot (Red) → Suggested Stop Loss Cushion / Support Expansion Zone
Because ATR measures market volatility, these dots expand during high volatility and tighten during slow markets, helping traders avoid stop-loss hunts and premature exits.
Why This Works
Most traders lose because:
They set SL too close → stopped out by noise
They set TP too far → price never reaches it
This tool calibrates those distances automatically based on real price movement behavior.
ATR = volatility
Volatility = market breathing room
This indicator ensures your trade has room to breathe, increasing win consistency.
Best Use Cases
Scalping
Swing trading
Trend continuation entries
Reversal confirmations with support/resistance
Works on Crypto / Forex / Stocks / Futures

Risk ModuleThis indicator provides a visual reference for position sizing and approximate stop and target placement. It supports trade planning by calculating equalized risk per trade and maintaining consistent exposure across different markets.
For more information about the concept, see the post Position Sizing and Risk Management .
Fixed Fractional Risk
The indicator calculates the number of shares that can be traded to maintain consistent monetary risk. The formula is based on the distance between the current price and stop reference, adjusting position size proportionally. A closer stop results in a larger position size, while a wider stop results in a smaller one.
Position Size = (Account Size × Risk %) ÷ (Entry Price – Stop Price)
Stop and Target
Stop placement is derived from volatility using the Average True Range (ATR). The target is plotted as a multiple of the stop distance, defining the risk-to-reward relationship in R units.
Stop = Price ± ATR × Multiplier
Target = Price ± (R × Risk Distance)
Chart Elements
The stop and target levels are plotted above and below the current price, with the stop marked by a red dot and the target by a green dot. The information table displayed on the chart shows the number of shares to trade, stop level, and target level.
Setup and Configuration
This configuration only needs to be set once, but can be adjusted later if preferred.
1. Start by setting the account size and risk percentage per trade to define the monetary amount risked on each trade. These values form the basis for position size calculation.
2. Set the ATR multiplier to determine stop distance, common values range between 1 and 3 ATR. Lower values place stops closer to price, increasing sensitivity but risking short-term noise. Higher values widen the stop, which reduces noise impact but extends time in risk.
3. Set the R-multiple to determine target distance relative to the stop. A value of 1 represents a 1:1 risk-to-reward relationship. Lower values reduce potential reward but tend to increase win rate, whereas higher values increase potential reward but tend to reduce win rate. The selection depends on system characteristics and trade expectancy.
When the parameters are defined, the indicator displays the stop, target, and calculated position size on the chart. All that remains is to enter the trade with the number of shares shown in the table and place bracket orders at the plotted stop and target levels.
Settings Overview
Account Size / Risk %: Defines account capital and per-trade exposure.
ATR Multiplier: Adjusts stop distance relative to volatility.
R Multiple: Sets target distance relative to stop (risk-reward ratio).
Position: Choose Long or Short direction.
Table Position: Controls information table placement and scale.

Stop Loss and TargetsEnter your purchase price, SL% and up to 3x TP%s. Automatically plots them on your chart to enable quicker set up of alerts.

Trend Break Target
The Trend Break Target indicator helps traders identify and trade potential breakout opportunities with precision. It offers the following key benefits:
Customizable Trend Anchors
Allows traders to set specific start and end dates for the trendline, ensuring analysis is aligned with chosen time windows.
Supports different price sources (High, Low, Close) to fit diverse trading styles.
Automatic Trendline Projection
Dynamically plots a trendline between selected anchor points and extends it forward, providing a clear visual guide for future price interactions.
Breakout Detection
Instantly detects when price breaks above or below the trendline.
Plots breakout markers (▲ / ▼) directly on the chart to highlight actionable trade signals.
Pivot-Based Target Calculation
Uses the nearest valid pivot high/low before the breakout (or a fallback lookback if unavailable).
Measures the distance between the pivot and the trendline, then projects a target price in the breakout direction.
Clear Visual Targets
Draws a dotted target line to show where price may reach after the breakout.
Adds a connector line from breakout to target and a measurement line from pivot to trendline, improving clarity of the setup.
Automatic Reset & Efficiency
Resets calculations when new anchors are applied, keeping charts clean and reducing noise.
Deletes old lines and labels automatically to optimize chart readability.
Strategic Trade Planning
Helps traders quickly identify risk-reward opportunities by visualizing breakout levels and price targets.
Useful for trend continuation as well as reversal trading strategies.
👉 In short, the FTBT indicator provides a structured way to analyse trendlines, confirm breakouts, and project realistic price targets—making it a powerful tool for both discretionary and systematic traders.

Bracket PreviewThe Bracket Preview indicator allows the user to set their intended bracket order distance (distance, in ticks, to take-profit and stop-loss) from the current live price so that a preview is generated and updated in real-time as price moves. This gives the trader a quick reference of where the bracket orders would be placed if a position were entered at that specific moment in time. This can be helpful by making it more obvious to the trader before a trade is placed exactly where these levels would be in relation to previous price action or if it would be better to wait for price to move to a more favorable level or accept a different Risk-Reward (RR) from this specific trade.
• “If I entered a long position now, would my target be in front of or beyond a recent consolidation area where it is likely to run into resistance and potentially reverse before hitting my take-profit?”
• “Would this bracket order place my stop-loss above or below a previous pivot or would I need to move it after entering the trade and potentially increase the risk on this trade to have it in a more logical level?”
• “If price is in a range and I enter now, would my stop be in the middle of the range while my target is outside the top of the range? Maybe I should wait for price to move to an area where my target would be inside but near the top of the range while my stop loss is below the range so that I’m not taking unnecessary risk or being forced to take an unfavorable RR.”

% / ATR Buy, Target, Stop + Overlay & P/L% / ATR Buy, Target, Stop + Overlay & P/L
This tool combines volatility‑based and fixed‑percentage trade planning into a single, on‑chart overlay—with built‑in profit‑and‑loss estimates. Toggle between ATR or percentage modes, plot your Buy, Target and Stop levels, and see the dollar gain or loss for a specified position size—all in one interactive table and chart display.
NOTE: To activate plotted lines, price labels, P/L rows and table values, enter a Buy Price greater than zero.
What It Does
Mode Toggle: Choose between “ATR” (volatility‑based) or “%” (fixed‑percentage) calculations.
Buy Price Input: Manually enter your entry price.
ATR Mode:
Target = Buy + (ATR × Target Multiplier)
Stop = Buy − (ATR × Stop Multiplier)
Percentage Mode:
Target = Buy × (1 + Target % / 100)
Stop = Buy × (1 – Stop % / 100)
P/L Estimates: Specify a dollar amount to “invest” at your Buy price, and the script calculates:
Gain ($): Profit if Target is hit
Loss ($): Cost if Stop is hit
Visual Overlay: Draws horizontal lines for Buy, Target and Stop, with optional price labels on the chart scale.
Interactive Table: Displays Buy, Target, Stop, ATR/timeframe info (in ATR mode), percentages (in % mode), and P/L rows.
Customization Options
Line Settings:
Choose color, style (solid/dashed/dotted), and width for Buy, Target, Stop lines.
Extend lines rightward only or in both directions.
Table Settings:
Position the table (top/bottom × left/right).
Toggle individual rows: Buy Price; Target (multiplier or %); Stop (multiplier or %); Target ATR %; Stop ATR %; ATR Time Frame; ATR Value; Gain ($); Loss ($).
Customize text colors for each row and background transparency.
General Inputs:
ATR length and optional ATR timeframe override (e.g. use daily ATR on an intraday chart).
Target/Stop multipliers or percentages.
Dollar Amount for P/L calculations.
How to Use It for Trading
Plan Your Entry: Enter your intended Buy Price and position size (dollar amount).
Select Mode: Toggle between ATR or % mode depending on whether you prefer volatility‑based or fixed offsets.
Assess R:R and P/L: Instantly see your Target, Stop levels, and potential profit or loss in dollars.
Visual Reference: Lines and price labels update in real time as you tweak inputs—ideal for live trading, backtesting or trade journaling.
Ideal For
Traders who want both volatility‑based and percentage‑based exit options in one tool
Those who need on‑chart P/L estimates based on position size
Swing and intraday traders focused on objective, rule‑based trade management
Anyone who uses ATR for adaptive stops/targets or fixed percentages for simpler exits
Engineer_Invest Target SellEngineer_Invest Target Sell is a Simple and Affordable Tool for Exiting a Deal
Engineer_Invest Target Sell is an indicator that helps you quickly determine the best levels for profit taking. It is designed in such a way that it is easy for even a beginner to understand when it is worth selling an asset.
The way it works:
1. Two levels for sale:
The indicator calculates two key points (or lines) on the chart where it is beneficial to lock in profits. This helps you see where you can reduce your risk and lock in revenue.
2. Three modes for different market moods:
Depending on the market volatility, the setup is divided into three modes:
Target Sell 3 (High Volatility): for fast market movements.
Target Sell 2 (Average Volatility): for balanced conditions.
Target Sell 1 (Low Volatility): for quiet trading sessions.
This separation allows the indicator to be adapted to any market conditions.
Simple settings:
You can choose the type of moving average (SMA or EMA) and adjust the transparency and color of the labels so that the information on the chart is as clear and easy to understand as possible.
Ease of use:
Visibility:
The indicator draws lines and marks directly on the chart, which allows you to immediately see the key levels for exiting a trade.
Adaptability:
Three modes allow you to adjust to the current market conditions — from rapid dynamics to a calm trend.
Easy to use:
Minimal settings and intuitive visualization allow you to quickly learn how to use the tool and make informed decisions.

ATR Stop-Loss & TargetsATR and Supertrend-based SL/TP & Trailing System
This indicator combines Average True Range (ATR) and Supertrend logic to help traders define precise stop-loss, first target, and trailing stop-loss (TSL) levels.
⚙️ Key Features:
📏 ATR-based Stop-Loss & Target Lines:
Uses ATR (default period: 5) based on the previous day's candle for more stable risk management.
Traders can choose the price source: Close, Open, or enter a manual price.
SL and first target are calculated using multipliers:
Multiplier 1 = Stop Loss
Multiplier 2 = First Target
📉 Supertrend for Trailing Stop:
Built-in Supertrend logic for trailing stop-loss management.
Uses ATR(10) with a multiplier of 2.1, based on HL2.
Supertrend can be toggled ON/OFF from the settings.

Trend Targets [AlgoAlpha]OVERVIEW
This script combines a smoothed trend-following model with dynamic price rejection logic and ATR-based target projection to give traders a complete visual framework for trading trend continuations. It overlays on price and automatically detects potential trend shifts, confirms rejections near dynamic support/resistance, and displays calculated stop-loss and take-profit levels to support structured risk-reward management. Unlike traditional indicators that only show trend direction or signal entries, this tool brings together a unique mix of signal validation, volatility-aware positioning, and layered profit-taking to guide decision-making with more context.
CONCEPTS
The core trend logic is built on a custom Supertrend that uses an ATR-based band structure with long smoothing chains—first through a WMA, then an EMA—allowing the trend line to respond to major shifts while ignoring noise. A key addition is the use of rejection logic: the script looks for consolidation candles that "hug" the smoothed trend line and counts how many consecutive bars reject from it. This behavior often precedes significant moves. A user-defined threshold filters out weak tests and highlights only meaningful rejections.
FEATURES
Trend Detection : Automatically identifies trend direction using a smoothed Supertrend (WMA + EMA), with shape markers on trend shifts and color-coded bars for clarity.
Rejection Signals : Detects price rejections at the trend line after a user-defined number of consolidation bars; plots ▲/▼ icons to highlight strong continuation setups.
Target Projection : On trend confirmation, plots entry, stop-loss (ATR-based), and three dynamic take-profit levels based on customizable multiples.
Dynamic Updates : All levels (entry, SL, TP1–TP3) auto-adjust based on volatility and are labeled in real time on the chart.
Customization : Users can tweak trend parameters, rejection confirmation count, SL/TP ratios, smoothing lengths, and appearance settings.
Alerts : Built-in alerts for trend changes, rejection events, and when TP1, TP2, or TP3 are reached.
Chart Overlay : Plots directly on price chart with minimal clutter and clearly labeled levels for easy trading.
USAGE
Start by tuning the Supertrend factor and ATR period to fit your asset and timeframe—higher values will catch bigger swings, lower values catch faster moves. The confirmation count should match how tightly you want to filter rejection behavior—higher values make signals rarer but stronger. When the trend shifts, the indicator colors the bars and line accordingly, and if enabled, plots the full entry-TP-SL structure. Rejection markers appear only after enough qualifying bars confirm price pressure at the trend line. This is especially useful for continuation plays where price retests the trend but fails to break it. All calculations are based on volatility (ATR), so targets naturally adjust with market conditions. Add alerts to get notified of important signals even when away from the chart.

Improved Target Oscillator | JeffreyTimmermansImproved Target Oscillator
The Improved Target Oscillator is a versatile technical indicator that identifies trends, reversals, and market momentum. Designed to work effectively across various markets, this oscillator excels at capturing longer-term market trends, making it ideal for traders focused on sustained price movements. By using advanced mathematical techniques and dynamic visualization, the oscillator provides actionable insights, helping traders navigate complex market environments with confidence.
Key features include:
A dynamic oscillator line to reflect market momentum and reversals.
Clear gradient-based coloring to distinguish between bullish and bearish conditions.
Signal highlights for potential entry and exit points based on trend shifts.
This tool is particularly useful for identifying extended trends and provides a clean, intuitive interface for assessing market dynamics.
Improvements in the Improved Target Oscillator
Smoothing Feature:
Added an optional smoothing toggle, allowing the use of SMA or EMA for reducing noise.
Provides flexibility through adjustable smoothing length, enhancing clarity in choppy markets.
Alerts for Trade Opportunities:
Built-in alert conditions for bullish and bearish signals.
Allows traders to receive notifications when critical trend changes occur, ensuring they never miss an opportunity.
Customizable to integrate seamlessly into trading workflows.
Enhanced Visualization:
Introduced dynamic gradients for bullish and bearish conditions with improved customization options.
Provides clearer differentiation of momentum changes, improving interpretability.
Signal Highlights:
Improved visual cues for bullish and bearish signals with precise dot indicators.
Offers better alignment with oscillator momentum shifts, ensuring actionable insights.
Adaptability:
Tuned for use in capturing longer-term market trends, emphasizing its effectiveness in identifying sustained movements.
Adjusted oscillator sensitivity with a levels multiplier for better scalability across various market conditions.
Level Markers:
Clearer delineation of key oscillator levels, including half and full normalized levels for improved context.
A neutral line explicitly plotted for easier trend and momentum identification.
Summary
The Improved Target Oscillator combines a sophisticated mathematical foundation with practical visualization enhancements to deliver a more intuitive and precise tool for market analysis. With added flexibility, improved signals, and tailored features for longer-term trends, this oscillator is an essential resource for traders looking to refine their strategies.
-Jeffrey

Wolfe Wave Detector [LuxAlgo]The Wolfe Wave Detector displays occurrences of Wolfe Waves, alongside a target line. A multiple swing detection approach is used to maximize the number of detected waves.
The indicator includes a dashboard with the number of detected waves, as well as the number of reached targets.
🔶 USAGE
The Wolfe Wave pattern is a chart pattern composed of five segments, with the initial segment extremities (points XABCD) forming a channel containing price variations.
After the price reaches point D , we can expect a reversal toward a target line (point E ). The target line is obtained by connecting and extending point X -> C .
The script draws the XABCD pattern and a projection of where E might potentially be located.
The projection is derived from the intersection between the target line and a line starting from D , parallel to B-C . From this line, margins are added, left and right, creating a wedge-shaped figure in most cases.
When the price passes the target line, this is highlighted by a dot. The dot and pattern are green by default when the target is above D and red when the target is below D . Colors can be edited in the settings. The dashed target line is colored in the opposite color.
As seen in the above example, the price trend can reverse after reaching the target line.
🔹 Symmetry
Ideally, the Wolfe Wave must have a degree of symmetry; every upward line should have a similar angle to the other upward lines, and the same should be true for the downward lines.
Also, the lines forming the channel should be as parallel as possible.
Users have the option to adjust the tolerance:
Margin controls the wave symmetry of the pattern
Angle controls the channel symmetry of the pattern
It's important to note that in both cases, a lower number will lead to more symmetrical patterns, but they may appear less frequently.
It is also important to note that increasing the Margin can delay validating the pattern. In the meantime, the price could surpass the channel in the opposite direction, invalidating and deleting the otherwise valid pattern.
🔹 Multiple Swings
Users can set a Minimum Swing length (for example 2) and a Maximum Swing length (for example 100) which defines the range of the swing point detection length, higher values for these settings will detect longer-term Wolfe patterns, while a larger range will allow for the detection of a larger number of patterns.
By using multiple swings, it is possible to find smaller next to larger patterns at the same time.
The dashboard shows the number of patterns found and targets reached. When, for example, bullish patterns are disabled in the settings, the dashboard only shows the results of bearish patterns.
🔹 Extend Target Line
The publication includes a setting that allows the Target Line to be extended up to 50 bars further. As seen in the above example, the Target Line can still be reached even after the pattern has been finalized. Once the Target Line is reached, it won't be updated further.
Here is another example of a Target Line being reached later on.
The Target Line acted as a support level, after which where the price changed direction.
🔹 Show Progression
An option is included to show the progression before the pattern is completed. Users can make use of the XABC pattern or visualize where point D should be positioned.
The focus lies on the bar range (between the left and right borders of the grey rectangle). The pattern is considered invalid and deleted when point D is beyond these limits. The height of the rectangle is optional. Ideally, the price should be located between the top and bottom of the rectangle, but it is not mandatory.
Show Progression has three options including:
Full: Show all lines of XABC plus line C-D and rectangle for the position of point D
Partial: Show line C-D and rectangle for the position of point D
None: Only show valid completed patterns
The 'Partial' option in the 'Show Progression' feature is designed to help users locate the desired position of point D without the visual clutter caused by the XABC lines. This can be useful for those who prefer a cleaner visual representation of the evolving pattern.
🔶 SETTINGS
🔹 Swing Length
Minimum: Minimum length used for the swing detection.
Maximum Swing Length: Maximum length used for the swing detection.
🔹 Tolerance
Margin: Influences the symmetry of the pattern; with a higher number allowing for less symmetry.
Angle: Influences the symmetry of the channel; with a higher number allowing for less symmetry.
🔹 Style
Toggle: Bullish/Bearish + colors
Extend Target Line: Extend a maximum of 50 bars or until Target Line is reached
Show Progression: Show pattern progression
Dot Size: The size of the dot when the Target Line is reached
🔹 Dashboard
Show Dashboard: Toggle dashboard which shows the number of found patterns and targets reached.
Location: Location of the dashboard on the chart.
Text Size: Text size.
🔹 Calculation
Calculated Bars: Allows the usage of fewer bars for performance/speed improvement

Prepare Targets, Stop Loss, Position Size and calculate PnL You are watching the price action of your favorite coin. Then the price changes quickly and you know you could start a good trade now.
But how much should you buy, where should you set your Target for Profit Taking and your Stop Loss? How much money do you want to risk, how much money would you win if the trade is succesfull?
This indicator helps you to set up your trade in a quick way, no need to do some calculations by hand.
How does it work?
Just enter the prices where you want to take Profit and where your Stopp Loss should be.
Enter the number of coins and wether you buy or sell/go long or short.
These targets are then shown in the chart, move them around to see if your stopp loss is positioned well. See directly what your profit or loss would be.
See some Screenshots with more explanations for what is possible and how to set up everything.
General Overview:
How to set up the Trade:
Formatting and Extras:
Let me know if you like it!

Volatility Adjusted Profit Target
In my 'Volatility Adjusted Profit Target' indicator, I've crafted a dynamic tool for calculating target profit percentages suitable for both long and short trading strategies. It evaluates the highest and lowest prices over the anticipated duration of your trade, establishing a profit target that shifts with market volatility. As volatility increases, the potential for profit follows, with the target percentage rising accordingly; conversely, it declines with decreasing volatility. As a trader, setting an optimal Take Profit level has always been a challenge. This indicator not only helps in determining that level but also dynamically adjusts it throughout the trade's duration, providing a strategic edge in volatile markets.

Blockunity Level Presets (BLP)A simple tool for setting performance targets.
Level Presets (BLP) is a simple tool for setting upside and downside levels relative to the current price of any asset. In this way, you can track which price the asset needs to move towards in order to achieve a defined performance.
How to Use
This indicator is very easy to use, you can set up to 5 upward and downward targets in the parameters.
Elements
The main elements of this tool are upward (default green) and downward (default red) levels.
Settings
Several parameters can be defined in the indicator configuration.
In addition to configuring which performance value to set the level at, you can choose not to display it if you don't need it. For example, here we display only two levels:
You can also choose not to display the labels:
Also concerning labels, you can choose not to display them in currency format, but in numerical format only (for example, if you're viewing a non-USD pair, such as ETHBTC):
Finally, you can modify design elements such as colors, level widths and text size:
How it Works
Here's how upside (_u) and downside (_d) levels are calculated:
source = close
level_1_u = source + (source * (level_1 / 100))
level_1_d = math.max(source - (source * (level_1 / 100)), 0)

Targets For Many Indicators [LuxAlgo]The Targets For Many Indicators is a useful utility tool able to display targets for many built-in indicators as well as external indicators. Targets can be set for specific user-set conditions between two series of values, with the script being able to display targets for two different user-set conditions.
Alerts are included for the occurrence of a new target as well as for reached targets.
🔶 USAGE
Targets can help users determine the price limit where the price might start deviating from an indication given by one or multiple indicators. In the context of trading, targets can help secure profits/reduce losses of a trade, as such this tool can be useful to evaluate/determine user take profits/stop losses.
Due to these essentially being horizontal levels, they can also serve as potential support/resistances, with breakouts potentially confirming new trends.
In the above example, we set targets 3 ATR's away from the closing price when the price crosses over the script built-in SuperTrend indicator using ATR period 10 and factor 3. Using "Long Position Target" allows setting a target above the price, disabling this setting will place targets below the price.
Users might be interested in obtaining new targets once one is reached, this can be done by enabling "New Target When Reached" in the target logic setting section, resulting in more frequent targets.
Lastly, users can restrict new target creation until current ones are reached. This can result in fewer and longer-term targets, with a higher reach rate.
🔹 Dashboard
A dashboard is displayed on the top right of the chart, displaying the amount, reach rate of targets 1/2, and total amount.
This dashboard can be useful to evaluate the selected target distances relative to the selected conditions, with a higher reach rate suggesting the distance of the targets from the price allows them to be reached.
🔶 DETAILS
🔹 Indicators
Besides 'External' sources, each source can be set at 1 of the following Build-In Indicators :
ACCDIST : Accumulation/distribution index
ATR : Average True Range
BB (Middle, Upper or Lower): Bollinger Bands
CCI : Commodity Channel Index
CMO : Chande Momentum Oscillator
COG : Center Of Gravity
DC (High, Mid or Low): Donchian Channels
DEMA : Double Exponential Moving Average
EMA : Exponentially weighted Moving Average
HMA : Hull Moving Average
III : Intraday Intensity Index
KC (Middle, Upper or Lower): Keltner Channels
LINREG : Linear regression curve
MACD (macd, signal or histogram): Moving Average Convergence/Divergence
MEDIAN : median of the series
MFI : Money Flow Index
MODE : the mode of the series
MOM : Momentum
NVI : Negative Volume Index
OBV : On Balance Volume
PVI : Positive Volume Index
PVT : Price-Volume Trend
RMA : Relative Moving Average
ROC : Rate Of Change
RSI : Relative Strength Index
SMA : Simple Moving Average
STOCH : Stochastic
Supertrend
TEMA : Triple EMA or Triple Exponential Moving Average
VWAP : Volume Weighted Average Price
VWMA : Volume-Weighted Moving Average
WAD : Williams Accumulation/Distribution
WMA : Weighted Moving Average
WVAD : Williams Variable Accumulation/Distribution
%R : Williams %R
Each indicator is provided with a link to the Reference Manual or to the Build-In Indicators page.
The latter contains more information about each indicator.
Note that when "Show Source Values" is enabled, only values that can be logically found around the price will be shown. For example, Supertrend , SMA , EMA , BB , ... will be made visible. Values like RSI , OBV , %R , ... will not be visible since they will deviate too much from the price.
🔹 Interaction with settings
This publication contains input fields, where you can enter the necessary inputs per indicator.
Some indicators need only 1 value, others 2 or 3.
When several input values are needed, you need to separate them with a comma.
You can use 0 to 4 spaces between without a problem. Even an extra comma doesn't give issues.
The red colored help text will guide you further along (Only when Target is enabled)
Some examples that work without issues:
Some examples that work with issues:
As mentioned, the errors won't be visible when the concerning target is disabled
🔶 SETTINGS
Show Target Labels: Display target labels on the chart.
Candle Coloring: Apply candle coloring based on the most recent active target.
Target 1 and Target 2 use the same settings below:
Enable Target: Display the targets on the chart.
Long Position Target: Display targets above the price a user selected condition is true. If disabled will display the targets below the price.
New Target Condition: Conditional operator used to compare "Source A" and "Source B", options include CrossOver, CrossUnder, Cross, and Equal.
🔹 Sources
Source A: Source A input series, can be an indicator or external source.
External: External source if 'External" is selected in "Source A".
Settings: Settings of the selected indicator in "Source A", entered settings of indicators requiring multiple ones must be comma separated, for example, "10, 3".
Source B: Source B input series, can be an indicator or external source.
External: External source if 'External" is selected in "Source B".
Settings: Settings of the selected indicator in "Source B", entered settings of indicators requiring multiple ones must be comma separated, for example, "10, 3".
Source B Value: User-defined numerical value if "value" is selected in "Source B".
Show Source Values: Display "Source A" and "Source B" on the chart.
🔹 Logic
Wait Until Reached: When enabled will not create a new target until an existing one is reached.
New Target When Reached: Will create a new target when an existing one is reached.
Evaluate Wicks: Will use high/low prices to determine if a target is reached. Unselecting this setting will use the closing price.
Target Distance From Price: Controls the distance of a target from the price. Can be determined in currencies/points, percentages, ATR multiples, ticks, or using multiple of external values.
External Distance Value: External distance value when "External Value" is selected in "Target Distance From Price".

Targets For Overlay Indicators [LuxAlgo]The Targets For Overlay Indicators is a useful utility tool able to display targets during crossings made between the price and external indicators on the user chart. Users can display a series of two targets, one for crossover events and another one for crossunder event.
Alerts are included for the occurrence of a new target as well as for reached targets.
🔶 USAGE
In order for targets to be displayed users need to select an appropriate input source from the "Source" drop-down input setting. In the example above we apply the indicator to a volatility stop.
This can also easily be done by adding the "Targets For Overlay Indicators" script on the VStop indicator directly.
Targets can help users determine the price limit where the price might start deviating from an indication given by one or multiple indicators. In the context of trading, targets can help secure profits/reduce losses of a trade, as such this tool can be useful to evaluate/determine user take profits/stop losses.
Due to these essentially being horizontal levels, they can also serve as potential support/resistances, with breakouts potentially confirming new trends.
Users might be interested in obtaining new targets once one is reached, this can be done by enabling "New Target When Reached" in the target logic setting section, resulting in more frequent targets.
Lastly, users can restrict new target creation until current ones are reached. This can result in fewer and longer-term targets, with a higher reach rate.
🔹 Examples
The indicator can be applied to many overlay indicators that naturally produce crosses with the price, such as moving average, trailing stops, bands...etc.
Users can use trailing stops such as the SuperTrend or VStop to more easily create clean targets. Do note that certain SuperTrend scripts separate the upper and lower extremities of the SuperTrend into two different plot, which cannot be used with this tool, you may use the provided SuperTrend script below to have a compatible version with our tool:
//@version=5
indicator("SuperTrend", overlay = true)
factor = input.float(3, 'Factor', minval = 0)
atrLen = input.int(10, 'ATR Length', minval = 1)
= ta.supertrend(factor, atrLen)
plot(spt, 'SuperTrend', dir != dir ? na : dir < 0 ? #089981 : #f23645, 2)
plot(spt, 'Circles', dir > dir ? #f23645 : dir < dir ? #089981 : na, 3, plot.style_circles)
Using moving averages can produce more targets than other overlay indicators.
Users can apply the tool twice when using bands or any overlay indicator returning two outputs, using crossover targets for obtaining targets using the upper band as source and crossunder targets for targets using the lower band. We can also use the Trendlines with breaks indicator as example:
🔹 Dashboard
A dashboard is displayed on the top right of the chart, displaying the amount, reach rate of targets 1/2, and total amount.
This dashboard can be useful to evaluate the selected target distances relative to the selected conditions, with a higher reach rate suggesting the distance of the targets from the price allows them to be reached.
🔶 SETTINGS
Source: Indicator source used to create targets. Targets are created when the closing price crosses the specified source.
Show Target Labels: Display target labels on the chart.
Candle Coloring: Apply candle coloring based on the most recent active target.
🔹 Target
Crossover and Crossunder targets use the same settings below:
Show Target: Determines if the target is displayed or not.
Above Price Target: If selected, will create targets above the closing price.
Wait Until Reached: When enabled will not create a new target until an existing one is reached.
New Target When Reached: Will create a new target when an existing one is reached.
Evaluate Wicks: Will use high/low prices to determine if a target is reached. Unselecting this setting will use the closing price.
Target Distance From Price: Controls the distance of a target from the price. Can be determined in currencies/points, percentages, ATR multiples, or ticks.

Risk Management GO8686: Stop Loss, Position Size & TargetFull Name: Risk Management GO8686: Stop Loss, Position Size & Target
What this indicator provides:
A dashboard to calculate Stop Loss, Position Size and Target, where users can customize Risk Management parameters in the setting.
Position Size: calculated from "initialCapital", "Leverage", "Max Loss", "feeMaker", "feeTaker".
Stop Loss Price: using pivots, default length is set to 3, with an extra ATR value controlled by "'Multiplier OF Extra ATR".
Target: calculated from entry price, risk reward, distance between entry and stop loss, fees
What the indicator does Not provides:
entries of positions: The Long/Short entries displayed are just MACD signal crossing zero, users can apply their own entry logic, by modifying ready2L / ready2S variables.
What the indicator does Not guarantee:
the integrity, timeliness, accuracy, and comprehensiveness of the data, calculation method, calculation results, etc.
Two types labels:
1. Automated labels: they are displayed when MACD signal crossing zero, use "Display History Labels" to toggle display or not.
2. Setup Manually label: located at the right side of the latest bar, to display results when users setup manually
The settings of the indicator:
"Toggle to Reload",
"InitialCapital", "Leverage", "Max Loss % per trade", "feeMaker", "feeTaker",
4 length inputs for Pivot, "Multiplier of Extra ATR for stop loss",
"Toggle To setup manually", "Toggle between Long / Short", "Entry Price, set manually", "Stop Loss Price, set manually", "Risk-Reward Ratio"
"Display History Labels"
---------- Disclaimer ----------
Before using or requesting access to the indicator, customers/users acknowledge that they have read and accepted that the indicator, any associated contents on all social medias and any communication with the indicator author, including but not limited to: product and service details, signals, alerts, data, calculation methods, calculation results, user manual, tutorials, ideas, videos, chats, messages, emails, blogs, tweets, etc. are provided solely for educational purpose and Not as financial advice. Customers/users understand and agree to use the aforementioned indicator and information at their own risk.
---------- Updates ----------
The latest updates override the previous content.
To activate a update, if it does not load as expected: close the indicator, save the chart, clear browser caches, restart the browser, reload the chart and apply the indicator to the chart.

Range BreakerStrategy Description: Range Breaker
The Range Breaker strategy is a breakout trading strategy that aims to capture profits when the price of a financial instrument moves out of a defined range. The strategy identifies swing highs and swing lows over a specified lookback period and enters long or short positions when the price breaks above the swing high or below the swing low, respectively. It also employs stop targets based on a percentage to manage risk and protect profits.
Beginner's Guide:
Understand the concepts:
a. Swing High: A swing high is a local peak in price where the price is higher than the surrounding prices.
b. Swing Low: A swing low is a local trough in price where the price is lower than the surrounding prices.
c. Lookback Period: The number of bars or periods the strategy analyzes to determine swing highs and swing lows.
d. Stop Target: A predetermined price level at which the strategy will exit the position to manage risk and protect profits.
Configure the strategy:
a. Set the initial capital, order size, commission, and pyramiding as needed for your specific trading account.
b. Choose the desired lookback period to identify the swing highs and lows.
c. Set the stop target multiplier and stop target percentage as desired to manage risk and protect profits.
Backtest the strategy:
a. Set the backtest start date to analyze the strategy's historical performance.
b. Observe the backtesting results to evaluate the strategy's effectiveness and adjust the parameters if necessary.
Implement the strategy:
a. Apply the strategy to your preferred financial instrument on the TradingView platform.
b. Monitor the strategy's performance and adjust the parameters as needed to optimize its effectiveness.
Risk management:
a. Always use a stop target to protect your trading capital and manage risk.
b. Don't risk more than a small percentage of your trading capital on a single trade.
c. Be prepared to adjust the strategy or stop trading it if the market conditions change significantly.
Adjusting the Lookback Period and Timeframes for Optimal Strategy Performance
The Range Breaker strategy uses a lookback period to identify swing highs and lows, which serve as the basis for determining entry and exit points for long and short positions. By adjusting the lookback period and analyzing different timeframes, you can potentially find the best strategy configuration for each specific asset.
Adjusting the lookback period:
The lookback period is a critical parameter that affects the sensitivity of the strategy to price movements. A shorter lookback period will make the strategy more sensitive to smaller price fluctuations, resulting in more frequent trading signals. On the other hand, a longer lookback period will make the strategy less sensitive, generating fewer signals but potentially capturing larger price movements.
To optimize the lookback period for a specific asset, you can test different lookback values and compare their performance in terms of risk-adjusted returns, win rate, and other relevant metrics. Keep in mind that using an overly short lookback period may lead to overtrading and increased transaction costs, while an overly long lookback period may cause the strategy to miss profitable trading opportunities.
Analyzing different timeframes:
Timeframes refer to the duration of each bar or candlestick on the chart. Shorter timeframes (e.g., 5-minute, 15-minute, or 30-minute) focus on intraday price movements, while longer timeframes (e.g., daily, weekly, or monthly) capture longer-term trends. The choice of timeframe affects the number of trading signals generated by the strategy and the length of time each position is held.
To find the best strategy for each asset, you can test the Range Breaker strategy on different timeframes and analyze its performance. Keep in mind that shorter timeframes may require more active monitoring and management due to the increased frequency of trading signals. Longer timeframes, on the other hand, may require more patience as positions are held for extended periods.
Finding the best strategy for each asset:
Every asset has unique price characteristics that may affect the performance of a trading strategy. To find the best strategy for each asset, you should:
a. Test various lookback periods and timeframes, observing the strategy's performance in terms of profitability, risk-adjusted returns, and win rate.
b. Consider the asset's historical price behavior, such as its volatility, liquidity, and trend-following or mean-reverting tendencies.
c. Evaluate the strategy's performance during different market conditions, such as bullish, bearish, or sideways markets, to ensure its robustness.
d. Keep in mind that each asset may require a unique set of strategy parameters for optimal performance, and there may be no one-size-fits-all solution.
By experimenting with different lookback periods and timeframes, you can fine-tune the Range Breaker strategy for each specific asset, potentially improving its overall performance and adaptability to changing market conditions. Always practice proper risk management and be prepared to make adjustments as needed.
Remember that trading strategies carry inherent risk, and past performance is not indicative of future results. Always practice proper risk management and consider your own risk tolerance before trading with real money.

Trend Critical Price for MACDIt is known that direction of trend detected with the MACD indicator is estimated according to the ascending or descending direction of the histogram.
The histogram in turn depends on the value of the difference between the MACD line and the signal line.
So, to consider that the histogram maintains a trend, it is necessary that the current value of the histogram have a value at least equal to its immediately previous value. In other words, for example if the previous value of the histogram was 100, for the trend to continue it is expected that the new value of the histogram should be 100 again.
Knowing this, it is possible to obtain the closing value of the current price candle in such a maner that the current value of Histogram is equal to the previous value. This is achieved by applying an algebraic operation resulting in the Critical Trend Price (TCP) for MACD.
Knowing this critical trend price can be useful for estimating the development of the trend according to real-time price action, visualizing for a target to hit, or estimating stop-loss.
Set this indicator just like the MACD and this calculates and returns the critical price that must be reached to maintain the current trend.
This plot a critical price line.
Also allows to show-hide a price band (High-Low)
Every time the asset price closes below the critical price, the trend is turning down. On the other hand, every time the price closes above the critical price, the trend is turning bullish. In both cases the price band shows a light tone.
An uptrend is considered confirmed when the low price at the end of the period is above the critical trend price. The price band will look green.
A downtrend is considered confirmed when the maximum price at the end of the period is below the critical trend price. The price band will look purple.
How is the Trend Critical Price (TCP) calculated?
By default it works with the closing price of each observed candle. If you need to see a MACD you will have to mount it separately. The configuration parameters of TCP must match the MACD.

Scaled Order Sizing and Take Profit Target ArraysWOAH Order Scaling!
This Provides a user with methods to create a list of profit targets and order sizes which grow or shrink. For size, the will add up to specific sum. for Targets they will include the first and last, and can lean towards either, to scale the order grid.
And thanks to @Hoanghetti for the markdown, i've included a basic usage example within the hover , o you don't need to search for the usage example, simply import, and when writing, the code hint contains a full example.
scaled_sizes(total_size, count, weight, min_size, as_percent)
create an array of sizes which grow or shrink from first to last
which add up to 1.0 if set the as_percent flag , or a total value / sum.
Parameters:
total_size : (float) total size to divide ito split
count : (int ) desired number of splits to create
weight : (float) a weight to apply to grow or shrink the split either towards the last being most, or the first being most, or 1.0 being each is equally sized as 1/n count
min_size : (float) a minimum size for the smallest value (in value of ttotal_size units)
as_percent : (float) a minimum size for the smallest value (in value of total_size units)
Returns: Array of Sizes for each split
scaled_targets(count, weight, minimum, maximum)
create a list of take profitt targets from the smallest to larget distance
Parameters:
count : (int ) number of targets
weight : (float) weight to apply to growing or shrinking
minimum : (float) first value of the output
maximum : (float) last value of the output
Returns: Array of percentage targets

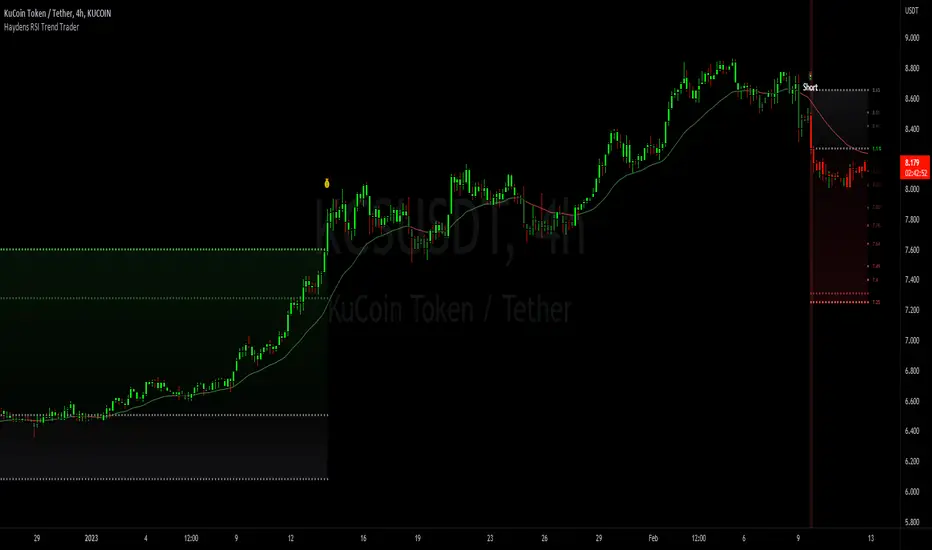
Haydens RSI Trend TraderThis is a simple trend trading companion indicator for Hayden's Advanced RSI, which can be found here:
For best results, please be sure your oscillator and chart companion settings match. Detailed trade information & statistics can be found when hovering over any of the indicator labels. The backtesting results are not calculated the same as TradingView, and the original code can be found here
Shoutout to the following authors for the code snippets that were used in making this indicator: @lazybear @kiosefftrading @Koalafied_3 @mabonyi @Capissimo