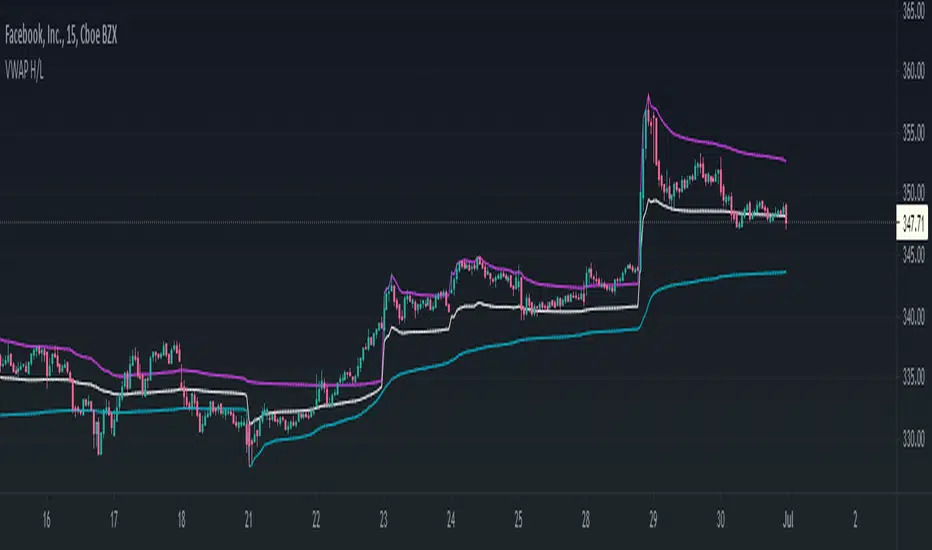
VWAP High/Low ChannelIn short, the VWAP High/Low Channel is based on VWAP "newsession" on swing high/low, with a basis of the two.
The VWAP High/Low channel seems to act like Bollinger bands or Donchain Channels when squeezing for a breakout, while also acting as a pivot after a breakout.
Swingtrading
One For All - Overextended Price ChannelIntroduction :
Channels are very useful tools to assess overextended price, volatility and upcoming retracement or impulsive moves (such as Bollinger Band squeezes). It is an indispensable addition to any trader using Mean Reversion theory for a scalp-trade or swing-trade.
This script contains :
- 2 channels Keltner-style, usingthe True Range for volatility
- a fully customizable volatility (channel width) and smoothing period (up to the ALMA parameters)
- both channel separately configurable , i.e. having a different volatility setting or smoothing method for each
- a useful selection of smoothing methods) to be used instead of the standard SMA or EMA, such as ALMA or Hull
- an embedded readjustment of the lower bands to avoid the drop on a logarithmic scale (see explanation below)
- a double layered channels with a gradient color to help dollar cost averaging in and out of positions
Why another channel indicator ?
I have found most conventional channels to be either not based on "proper" volatility (e.g. standard deviation of price action for Bollinger Band), or the bottom channel to be ill adapted to the logarithmic scale and plunges to 0 on some high volatility periods, messing with readability on logarithmic auto-scaled chart.
Also, I find the channels to be most useful when superimposed with another one of longer length; especially a pair of channels with a 50 and 200 period moving average respectively. Mean Reversion traders that mostly trade the 50 and 200 SMA/EMA know what I am talking about as having a channel helps to have a better visual for a proper of entry and exit point.
Lastly, wondering why traders mostly use the SMA/EMA for the channel center, historic reason, personal preference, stubborn beliefs...? Well you will find that using other smoothing method such as the ALMA or Hull shows very interesting restults that seem -I dare say- more accurate, this option is provided in this script (some screen shot below speak for themselves).
Disclaimer :
This indicator was originally intended to be used along with the Trend Insight System to improve performance, and the default configuration mostly backtested on BTCUSD.
Please use with caution, proper risk management and along with your favorite oscillator, candlestick reading and signals system.
Some explanation :
Based on Mean Reversion paradigm, everything has a tendency to revert back to the mean :
- when the price enters the upper channel, it is supposed to be (or start getting) overbought as the market is getting overheated, thus prone to correction,
- on the other hand, when the price enters the lower channel, it is supposed to be (or getting) oversold and the market looks favorable for a buy-in.
Depending on the trading style used, a trader will usually either wait until the price leaves the channel towards the mean before taking action (conservative style) or you will set limit orders inside the channel as you expect a reversion to the mean (more agressive/risky style).
With two channels, more complex (and maybe precise) rules can be built to optimize one's trading strategy, especially adjusting the volatility multiplier inputs for each channel. Using different smoothing method for each is interesting to play with (especially Hull for the 50 and maybe VWMA for the 200) but not keenly advised unless you know what you are doing.
An example using the conventional Volume Weighted Keltner-like channel :
A more interesting channel using the most recent ALMA smoothing method :
Another variant using the Hull smoothing method to better see squeezes and overextensions :
This last screenshot shows the reason why it was originally intended to be used along with the Verbatim of the Trend Insigth System :
Important notes :
While this version is fun to use thanks to a very customizable side, you might get into the neverending maze of trying tofind an optimal setting for volatility and smoothing length to adapt to each and every market you are trading. Hence, be wary of overoptimization which is risky at best and counter productive at worst (according to legendary traders such as Mark Douglas).
In the end, sticking with 50/200 length and a single setting on volatility might be wiser. Even if, needless to say, the volatility needs to be adjusted between a nascent and volatile market (such as crypto) compared to standard call markets that are much less volatile.
End notes :
It will always be considered a work in progress to help bring out the best of trading with channels, any comment and suggestion are welcomed.

Dual Mean Reversion Channel (adjusted lower band)This is a public and open-source lighter version compared to the "Overextended Price Channel" which is provided complimentaty to the Trend Insight System.
Introduction :
Channels are very useful tools to assess overextended price, volatility and upcoming retracement or impulsive moves (such as Bollinger Band squeezes). It is an indispensable addition to any trader using Mean Reversion theory for a scalp-trade or swing-trade.
This script contains :
- 2 channels Keltner-style, using the True Range for volatility
- customizable volatility (channel width) and smoothing period
- a standard selection of moving average ; SMA, EMA, VWMA
- an embedded readjustment of the lower bands to avoid the drop on a logarithmic scale (see explanation below)
Why another channel indicator ?
I have found most conventional channels to be either not based on "proper" volatility (e.g. standard deviation of price action for Bollinger Band), or the bottom channel to be ill adapted to the logarithmic scale and plunges to 0 on some high volatility periods, messing with readability on logarithmic auto-scaled chart.
Also, I find the channels to be most useful when superimposed with another one of longer length; especially a pair of channels with a 50 and 200 period moving average respectively. Mean Reversion traders that mostly trade the 50 and 200 SMA/EMA know what I am talking about as having a channel helps to have a better visual for a proper of entry and exit point.
Disclaimer :
This indicator was originally intended to be used along with the Trend Insight System to improve performance, and the default configuration mostly backtested on BTCUSD.
Please use with caution, proper risk management and along with your favorite oscillator, candlestick reading and signals system.
Some explanation :
Based on Mean Reversion paradigm, everything has a tendency to revert back to the mean :
- when the price enters the upper channel, it is supposed to be (or start getting) overbought as the market is getting overheated, thus prone to correction,
- on the other hand, when the price enters the lower channel, it is supposed to be (or getting) oversold and the market looks favorable for a buy-in.
Depending on the trading style used, a trader will usually either wait until the price leaves the channel towards the mean before taking action (conservative style) or you will set limit orders inside the channel as you expect a reversion to the mean (more agressive/risky style).
With two channels, more complex (and maybe precise) rules can be built to optimize one's trading strategy.
Important notes :
In the end, sticking with 50/200 length and a single setting on volatility might be wiser, be wary of overoptimization which is risky at best and counter productive at worst (according to legendary traders such as Mark Douglas). Even if, needless to say, the volatility needs to be adjusted between a nascent and volatile market (such as crypto) compared to standard call markets that are much less volatile.
End notes :
It will always be considered a work in progress to help bring out the best of trading with channels, any comment and suggestion are welcomed.

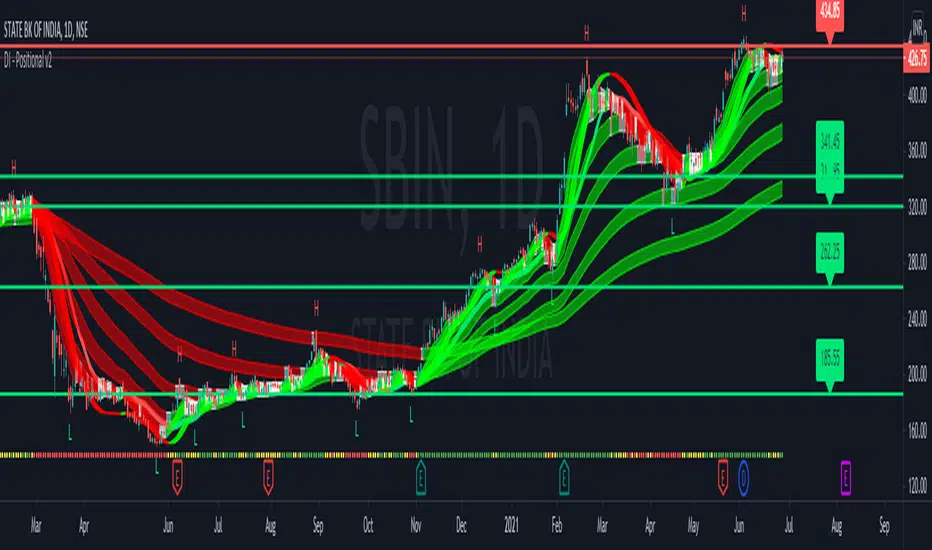
D Indicators - Positional tool*Presenting a perfect setup for Positional and Swing traders.
1) Slow and Fast Bands
# 3 fast and 3 slow, in total of 6 EMA bands are added to the indicator in order
to make accurate decisions and helping find out in which trend the price is.
Enter when price gives a breakout above or below all of the 6 bands.
2) Trend Indicators
# Total of 3 trend indicators are also included:
Trend Indicator 1 ---> It is a SMA(20) and its color changes based upon
Trend Indicator 2 ---> will be plotted at the bottom of the screen. Based upon RSI
Trend Indicator 3 ----> EHMA
Their color will be yellow whenever the market is sideways which will act
as a cautionary sign that in about next phase the price will be rangebound.
Use them as a helping hand, and check whether they show the same trend or not while you enter.
3) Support/Resistance lines
# On charts, this indicator is used to locate levels of support and resistance.
As a function, Targets and SL can be planned.
When a candle closes above the support/resistance line, the lines change
color automatically. It'll turn green.
If the price is below the sup, it will also change color to red.
4) High/Low
# Will mark the high/low of a particular swing so that, one can place the SL over there and enter.
Thank you and regards,
D Indicators
CRYPTOPRODear traders,
Welcome to CRYPTOPRO indicator. Only for crypto markets! This is an invite only script, please PM me to request permission for testing and access.
This indicator is developed as a scalping, intraday or swingtrade strategy.
Been working on indicators for years now, now back to trading again and made the best possible indicator for different timeframes.
The indicator uses market data, multiple timeframe ma/rsi charts and price action for determining a long or short strategy.
The indicator does not repaint!
I have made the indicator as easy as possible to use with added background colors.
How to use:
- Long strategy: when background turns to green after bar closing.
- Short strategy: when background turns to red after bar closing.
Alerts:
- Alerts are included in the indicator and are very simple to use.
- Alert "buy" for long strategy (green background)
- Alert "sell" for short strategy (red background)
- The alerts can also be used for automated trading/bot trading.
Time Frames :
- Can be used for all different timeframes.
Chart candles:
- Indicator is to be used with standard prince candles.
Note:
- Trading and financial markets are always risky and unpredictable.
- All trades made based on this indicator and his results are always your own responsibility.
- As an author i will not be held responsible for any of your trading profit or loss. Always be cautious when trading.
Charts can be applied to all TV supported crypto charts.
If you find the indicator usefull share your support and feedback in the comments.
Any questions PM me for more info.Thank you!
DISCLAIMER:
No sharing, copying, reselling, or any other forms of use are authorized for our scripts / strategy, and the information published with them.
This script / strategy is strictly for individual use.
This is not financial or investment advice. Investments are always made at your own risk and are based on your personal judgement.
NYTRADE is not responsible for any losses you may incur. Please trade wisely.

[USDCHF-USDCAD] H1 Predict signal DinhChienFX's [2 orders]Identify trend:
4 EMAS 50-100-150-200:
- Uptrend: ema: 50 > 100 > 150 > 200
- Downtrend: ema: 50 < 100 < 150 < 200
Pivot:
- Left: 15 candles
- Right: 15 candles.
- Uptrend: Higher low - Higher High
- Downtrend: Lower Low - Lower High.
Keltner Channel:
- Uptrend: Candle crosses Upper 2.
- Downtrend: Candlestick crosses the Lower 2 line.
Strong trend according to ADX indicator:
- DI: 9
- Smooth: 9
- ADX: 38
Order entry point:
- Buy: Upper Keltner
- Sell Lower Keltner
Take Profit/Stop Loss: atr (20) x2 = Height of Keltner channel from Lower to Upper line.

BAM's Weighted ROCTraders,
BAM's Weighted ROC is a Momentum indicator. ROC stands for 'Rate of Change' therefor this indicator plots the reading of a weighted average Rate of Change. In its current form it uses 4 periods en 4 weightings. The periods are set to 21/63/126/252 which corresponds to the number of trading days in each 1/3/6/12 months. The weightings are set to emphasize the more recent periods where the 1-month period counts for 40% of the signal, the 3-monthh period for 30%, the 6-month for 20% and the 12-month for 10%. These settings, both periods and weightings, are customizable. The current settings are meant to serve the widely used 1-day time interval chart setting. Feel free to alter the time frame and adjust the parameters accordingly; eg I like trading the weekly chart on a 10/20/30/40 period settings.
BAM's Weighted ROC can be used as a trendfilter for Trend Following trading systems or as an entry signal for Swing trading systems, or both. In the current setting the indicator is set to trend-following; it turns green when positive (above 0), indicating positive momentum. And red when negative (below 0), indicating negative momentum. In the most basic form one can trade a well diversified portfolio of assets using the indicator as guidance for entry and exit signals as it flows back and forth between positive and negative. Another use for the indicator lies in Swing Trading systems. In this approach the transfer from declining momentum into ascending momentum can be interpreted as a shift in momentum from negative to positive, and therefor constitute an entry opportunity. A combination of the 2 signals is of perfectly viable too, wait for positive momentum (reading above 0) in combination with a upward shift from one bar to the other. Use the reverse logic as an exit signal. In these examples the indicator is used in a stand-alone fashion. But off course it can also be used in conjunction with other indicators.
I personally use the two functions, trend-following en swingtrading, in tandem (combined)
for further reading into the rational behind Trend Following trading systems I recommend the following sources:
- Free Read: Google for 'Meb Faber, Global Asset Allocation' he gives out free copies on his website. Meb is a well known character in the Momentum-factor arena.
- Easy read: 'Following the trend' By Andreas Clenow. I don't think there is any Trend Following trader that doesn't know this chaps work.
- sophisticated Read: Trend Following with Managed Futures by A. Greyserman and K. Kaminski. This one is for those who seriously mean business!
Good luck out there, pls consider that the momentum factor holds an edge, at least based on historical performance, but this out-performance (most often) lies in the low single digits.
Pls be aware that use of this indicator is at your own risk. All info provided is solely presented for educational purposes.
Kind regards,
Bam

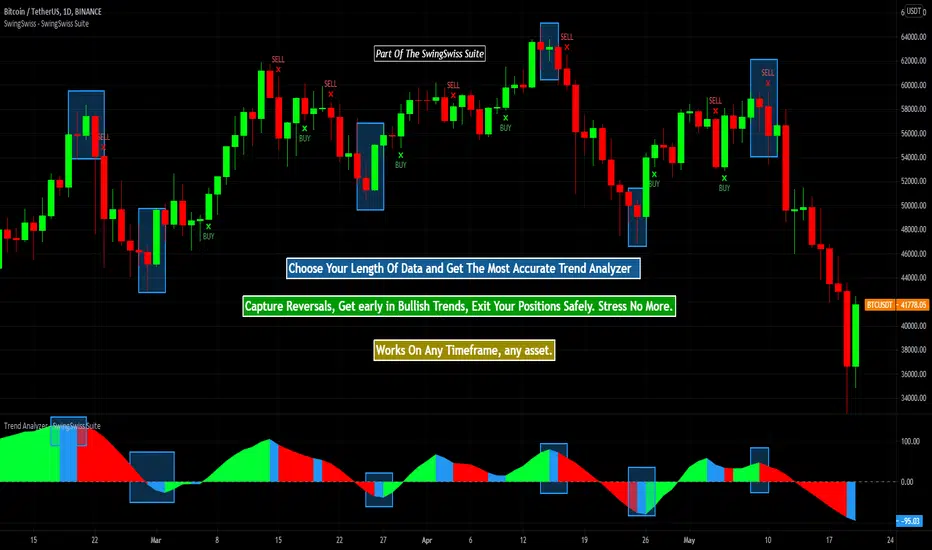
Trend Analyzer - SwingSwiss SuiteTrend Analyzer aims to define and analyze the trend of a particular asset at a given time using MACD, mathematical functions, and moving average.
It comes in very handy when determining an overall strategy or when you need to decide on whether a trade makes sense or not.
Finally, you can build a complete strategy around the indicator.
QUICK OVERVIEW
When the histogram is green, it means that the asset is currently bullish. Blue shows a possible reversal while red is synonymous with a bearish trend.
In the configuration panel, you can change the length of the data analysis.
The lower the number, the more recent the data captured is. Therefore, it's more predictive.
USE CASES
- You want to make a long trade on a 30mn chart but the indicator is red on the 30mn chart but also in the lower charts showing that the trend is not likely to reverse... You should think twice about that trade.
- You want to short the market on a 2h chart but on the lower charts, the green indicator is showing... Wait for a little bit, you might short at a higher price.
POSSIBLE STRATEGY
Let's take the BTCUSDT Future on the 2h chart :
You can display the indicator twice.
The first one with a length of 5, the second one with a length of 4.
To enter a long trade, wait for the green on length 5 and exit it at blue or red on length 4! It works like magic ;)
Disclaimer:
Trading and investing in the financial markets involves substantial risk of loss and is not suitable for every investor.
All trading strategies are used at your own risk.
Trend Analyzer is part of the SwingSwiss Suite, contact me for more info
EMA+RSI Pump & Drop Swing Sniper (With Alerts)This is using an EMA and RSI with slightly modified settings to give good entry and exit points while looking at Bitcoin. I use this on a 4-hour chart and with other indicators to find good positions to enter a trade or exit if things are turning red.
If you click on the EMA line it will color the bars of the chart based on if they are above or below the EMA - This is just visually helpful for me to see the active trend.
Make sure you hover over or click on the EMA line to see the colors of the candles change - it's not visible by default or without doing this.

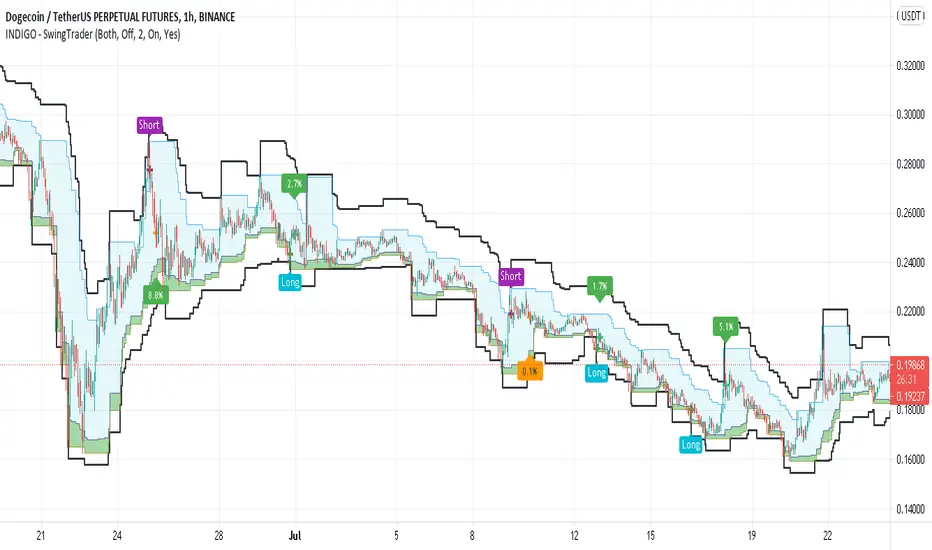
INDIGO - SwingTraderThis is a script that uses a couple of other indicators to find good swing trade entry's and exit's. You can choose which signals the script uses to calculate the position of the signals.
It uses the following:
- Stoch RSI
- MACD
- POC
- INDIGO Cloud
Also added are volume candles, acceleration of momentum indicators (triangle) and MACD candles. This way you can see more info to decide if the entry is valid.
I have used a couple of public scripts and tried to give credit to the original creators. If there is any script that hasn't been credited, please contact me.
Feedback is very much appreciated, positive and negative. Also If you have any question, feel free to ask me. I'll try to answer asap.
Enjoy the script :)
Donchian Channel StrategyRide the trend with full potential. Filter out false signals using long period ema. Lower bands take care of the stop loss.
Use this strategy for banknifty futures for consistent quarterly returns.

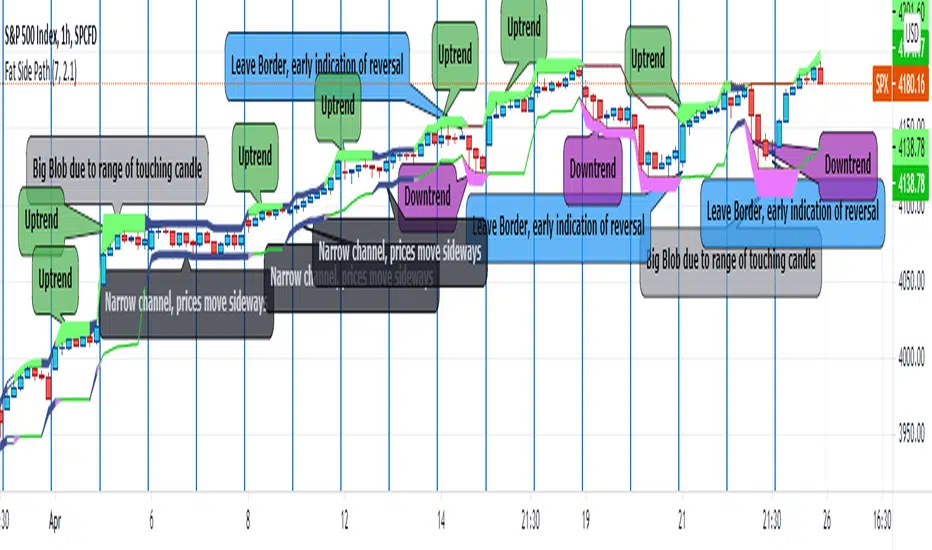
Fat Side PathI got the idea for a narrow Donchian Channel with a short lookback period which closely follows the price fluctuation in which the sides of the channel have a thickness according to the range of the last touching candle.
Any channel, be it Donchian, Keltner, Bollinger Bands or Parallel, has an upside and a downside, touching the upside is a buy signal as this may initiate an uptrend, the downside a sell signal because a down trend may come.
This gave me the idea to make only the last touched side fat, thus creating visible switching between uptrend and downtrend. However this is ‘too digital’, as in practice also periods of no trend occur in which signaling a trend would give a false signal. In a Donchian channel (and also Bollinger Bands) such periods are marked by narrowing the channel. So I gave a no trend signal to the sides when the channel is narrower than a minimum width to call a trend. I gave the thing nice colours and proper default settings.
Use of the channel in trading.
I think this thing can be useful for swing trading. In channels two typical things may happen that should be noted by the trader, these are LB, Leaving the Border, which signals a trend reversal and FTT, Failure To Traverse, i.e. the price doesn’t manage to cross the channel to the other side. This affirms the trend. FTT’s are not expected in short lookback channels like this path (Sidenote: Fibonacci levels can be regarded as predictions where FTT’s may occur). The fat side indicates direction. Because somehow trends seem to end with a notable range extension, this channel sometimes produces a “Big Blob” where the trend reverses.
I intend to use this thing together with my Keltner Fibzones channel, where the zones serve as a ‘landscape’ in which the Fat Side Path meanders providing ‘comments’ on the short term price movements.
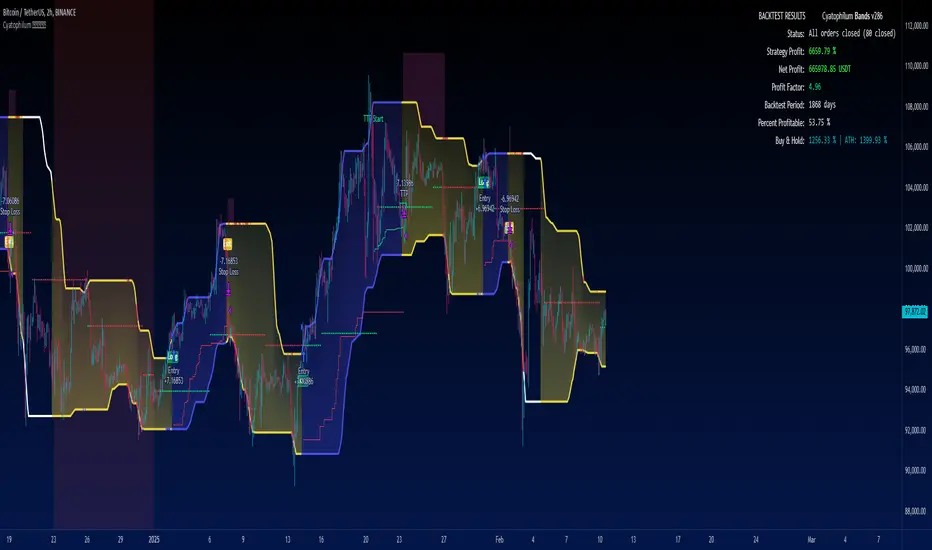
Cyatophilum Bands Definitive Edition█ OVERVIEW
A Swing Trade indicator providing backtest and alerts which can be used as a long, short or reversal strategy.
Its main goal is to catch breakouts and huge moves, and to try and beat the Buy & Hold Return.
█ CONCEPTS
The strategy consists of a unique custom indicator that works like this:
A Smoothed Donchian Channel combined with a consolidation check will trigger an entry.
The entry is then guided by a faster channel used as a trailing stop.
█ HOW TO USE
The most effective way to use this indicator is on high timeframes, from 2H to 1D.
The recommended pairs are trending pairs with consolidation areas. Yes, I'm especially looking at crypto.
The first appproach would be to catch long and short breakouts, and ride the trend using the trailing stop.
Adjust the Bands wisely to trigger entries at the right time.
The second approach is to go longs only, and try to beat the Buy & Hold return.
For this, click "Go long" and use an order size of 100% equity. Then adjust the Bands, trailing stop and chart timeframe.
The Buy & Hold comparator will come handy when backtesting.
█ INDICATOR SETTINGS
Strategy Direction
Choose wether to go long only, short only or both directions.
Bands Configuration
The bands lookback, smoothing and consolidation % are used to change the behavior of the bands. More info in the settings tooltips.
Trailing Stop
The "speed" of the trailing stop can be configured, allowing more or less room for the price to move before exiting.
Volume Condition
In addition to the consolidation condition, you can add a volume check to your entry. Is the volume rising or not? Useful in most scenarios.
Exit Alert Type
If you want to receive alerts during bars or prefer to ignore wicks.
Backtest Settings
This is where you choose the backtest period which is also used to calculate the B&H return.
Graphics
The configuration panel with all the indicator settings backtest info.
The buy & Hold Comparator is an additional panel that turns green when the strategy's return is greater than the Buy & Hold return.
Note: The Strategy Return is the strategy netprofit + the strategy openprofit.
█ ALERTS
Configure your alert messages for all events in the indicator settings.
Then click "Add Alert". In the popup window, select the option "alert() function calls only", give the alert a name and you are good to go!
█ BACKTEST RESULTS
The backtest settings used in this snapshot are the following:
Initial Capital: 10 000$
Order size: 100% equity (It indeed compounds and this is intended since the main goal of the strategy is to compare to Buy & Hold return)
Commission: 0.1%
Slippage : 10 ticks
The Indicator settings used for this are shown in the main chart above.
Follow the Trend with Fib support LevelsThis is trend following strategy. Which takes entries on the pullbacks when long term trend is up.
It allows you to enter / add on pullback of Fib 0.618 of prebious N number of candles. I have defaulted this to 9.
BUY
====
1. Long term trend is UP i.e ema 50 is above ema 200
2. wait for Fib0.618 pulls back to trend zone (orange line )
3. when the close cross above Fib0.618 line , Enter BUY or ADD to existing position
Exit
====
1. Wait for Fib0.618 come out of Trend zone
2. close partial , when price cross down below Fib0.236
Stop Loss
========
1. Stop Loss set as Trailing Stop Loss , defaulted to 5%
you can also use ATR as trailing stop loss.
I have tested with SPY , QQQ and AAPL on hourly chart
Warning
========
for the use of educational purpose only. If you want to trade the startegy signals, please do yor own research.

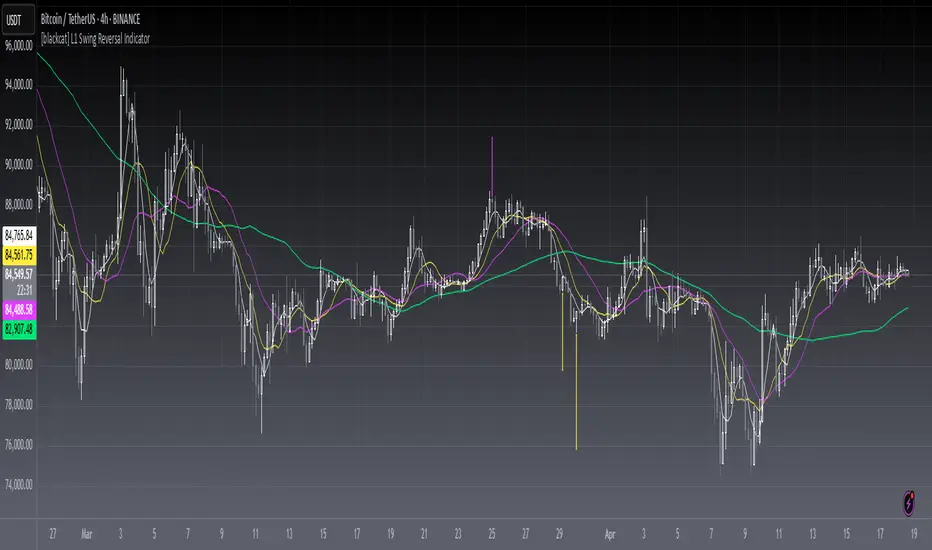
[blackcat] L1 Swing Reversal IndicatorLevel: 1
Background
Many asked me about swing reversal indicators. There are many but less of them can guarantee high win rate. Because market is complex, the reversals can be nested together, which means sub level reversals will be contained in higher level waves. This can be well explained by Elloit wave theory.
Function
Here it is a simple moving average based swing reversal indicator as an example for many others to improve it. Although it simple, it could be very powerful to dedicated trading pairs in specific time frame. One can adjust N1~N4 as SMA peiords from short to long to customized this indicator or even by trying different moving average types to enhance its accuracy.
Key Signal
N1~N4 --> SMA look back periods
OB --> Overbought Threshold
OS --> Oversold Threshold
Pros and Cons
Simpe but powerful. More feedbacks are appreciated.
Remarks
Easy to be customized or integrated to your trading system.
Readme
In real life, I am a prolific inventor. I have successfully applied for more than 60 international and regional patents in the past 12 years. But in the past two years or so, I have tried to transfer my creativity to the development of trading strategies. Tradingview is the ideal platform for me. I am selecting and contributing some of the hundreds of scripts to publish in Tradingview community. Welcome everyone to interact with me to discuss these interesting pine scripts.
The scripts posted are categorized into 5 levels according to my efforts or manhours put into these works.
Level 1 : interesting script snippets or distinctive improvement from classic indicators or strategy. Level 1 scripts can usually appear in more complex indicators as a function module or element.
Level 2 : composite indicator/strategy. By selecting or combining several independent or dependent functions or sub indicators in proper way, the composite script exhibits a resonance phenomenon which can filter out noise or fake trading signal to enhance trading confidence level.
Level 3 : comprehensive indicator/strategy. They are simple trading systems based on my strategies. They are commonly containing several or all of entry signal, close signal, stop loss, take profit, re-entry, risk management, and position sizing techniques. Even some interesting fundamental and mass psychological aspects are incorporated.
Level 4 : script snippets or functions that do not disclose source code. Interesting element that can reveal market laws and work as raw material for indicators and strategies. If you find Level 1~2 scripts are helpful, Level 4 is a private version that took me far more efforts to develop.
Level 5 : indicator/strategy that do not disclose source code. private version of Level 3 script with my accumulated script processing skills or a large number of custom functions. I had a private function library built in past two years. Level 5 scripts use many of them to achieve private trading strategy.
[KL] BOLL + MACD Strategy v2 (published)This strategy will look for opportunities when price touches the lower Bollinger band, then enters Long when it anticipates a MACD crossover signal.
Setup: on 1-day chart interval
Exits when either (a) hitting trailing stop loss, or (b) meeting risk-to-reward, if defined by user.

Genesis Matrix Momentum IndicatorThe Genesis Matrix (GMMI = Genesis Matrix Momentum Indicator) is primarily a momentum indicator that can be very well combined with other indicators to easily detect possible trend changes.
This is a translation/interpretation for TradingView from the original Metatrader 4 code which is Open-Source and was developed by "realjumper". More information here: www.forexfactory.com
The 5-15 Genesis Strategy and Genesis Summary PDF: www.forexfactory.com
EMA is configured as follows:
Length: 5
Source: hlc3
Offset: 2
Create a buy alert:
- Condition: GMMI and "All blue"
- Options: Once Per Bar
Create a sell alert:
- Condition: GMMI and "All red"
- Options: Once Per Bar
Version 3 changes:
- Bug fixes
- Fixed T3 signal (trend reversal instead of closing above/under trend)
- Input variables added (You could play around with periods of CCI and T3 by setting it to 12 for example.)
- Converted to PineScript v4
- Added alarm conditions
Happy Trading 📈😎
Important : We have neither invented this indicator nor added anything in the logic to it. This is just a script translation.
Note1 : TVI (first line) only works on a ticker with provided volume!
Note2 : The original system uses Heikin Ashi candles, but please be aware that this may alter the alertcondition and probably falsify the actual outcome.
Note3 : We do not recommend using a single indicator as a basis for your trading decisions.
To find out more about how to gain access to this indicator, please use the provided information below or just message me.

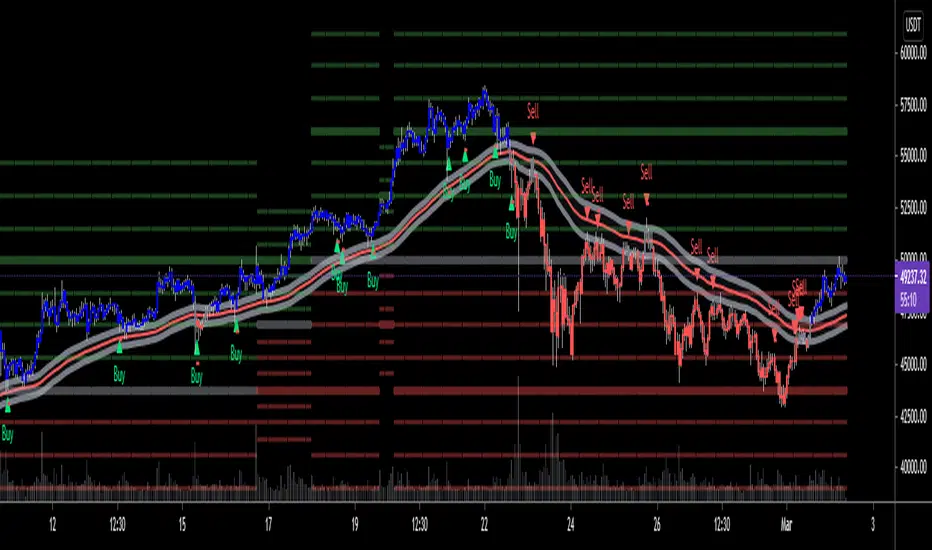
AltTrader Scalp & SwingPLEASE READ THIS DESCRIPTION TO SAVE TIME AND UNDERSTAND WHAT THIS INDICATOR DOES
Hello Tradingview World!
It is us, AltSignals, and we're back after many months of working on a new indicator script for anyone to try! Just message us and we will add you to test it out, all feedback is highly appreciated as we're always trying to improve the script.
This script was designed for Cryptocurrency pairs as we know how much you guys love crypto! However it will work on other markets. The AltTrader script uses various indicators in conjunction with each other but the most prominent one is ATR! ATR is truly a secret indicator that many people do not incorporate into their trading strategy, but I have found it to be a great tool for finding trends and predicting tops!
I have made sure to include Take profit 1, Take profit 2 and Stop loss options for AltTrader, this means you can adjust the settings based on percent, make sure to use the measure tool in TradingView if you need to find out the percentage gap of a move. Generally with Crypto pairs the percent moves will be more so 1-5% and with forex much smaller 0.1-0.5% for example.
I have also added in a Power setting which allows you to increase or decrease the number of alerts, the default is set at 100, but you can do it as low as 1 and as high as 500 or more. But remember too many alerts is a curse and over trading may be detrimental to a users performance!
This indicator was designed to work in both small and high timeframe scenarios allowing you to catch small scalp moves and large trend moves, my personal favourite timeframes 15m and 1hr for lower timeframes and 4hr to 1D for higher timeframes. I know it can be tempting to use a low timeframe like 1 minute but there will be a lot of choppy indirection. You don't want to be sitting there all day trading, jumping in and out of every move there is.
I hope this has cleared up some questions for the indicator and I will be happy to answer more over Tradingview Private Messenger if needed. Please message me if you would like a trial as I am looking for feedback as well.
Thank you
AltS Team

MAC Trader V2.0 [VK]This script is based on a very simple and affective strategy. Usable for scalp, Trend, Swing, positional Trading. Works on all types of markets(Crypto, Stocks, Commodity, Forex, etc) and symbols.
About The Indicator :
The three lines(Grey upper, Red Mid, Grey Lower) moving with the price direction is Moving average channel (MAC) Which is used to determine the Market Direction. Buy/Sell signals are plotted on RSI Oversold/overbought Which is used For Entries. Small Red Line plotted below the Buy/Sell Signals is Stop loss and The Dotted lines in Green, Grey and Red are the take profit lines.
How to use :
Buy When Buy Signal, Sell When Sell Signal (Entry only After Candle Close). Use The red line below/above signals for Stop Loss. Green Red dotted lines to take profit targets, move your stops above/below as targets hits.
Functions :
Moving Average Channel (MAC) For Direction
RSI for entries
ATR for stops
Support/Resistance Lines to Take Profits
Color candles When Price Above/Below MAC
Additional Feature :
Chop Signals for Scalping/continuation/Mid Entries - This feature can be turned on in the indicator settings Which will plot B/S signals for entries.
TIP : Use MAC input 34,48 for low volatile markets (Indices, Gold , etc)
Customizable Percentage Price Oscillator (PPO)The PPO is basically the MACD but in percentage terms. This is better for comparing momentum across different securities.
This script is a standard PPO but with many options for customization. You can set the moving average type of the signal and the oscillator lines separately. You can also weight any moving average of the PPO by volume.
Supported Types of MA:
SMA
EMA
ALMA
HMA
WMA
Personally, I believe weighting by volume is helpful across markets but especially helpful for equities. I like to use 3,10,16 settings similar to Linda Raschke but with EMA instead of SMA. This indicator is especially useful for signaling trend continuation and generating exit signals. For entries, I believe this indicator should not be blindly followed and works better when combined with a trend or price action signal.
If there are requests for more types of moving average to be used with the PPO, I would be down to implement them, but I believe most moving averages are pretty similar.

RSI Classic Strategy (by Coinrule)One of the questions hobbyist traders more often ask is: what is the perfect trading indicator?
Every indicator is just a tool, so its efficiency is proportional to your ability to read its signals and translate them into an actionable trading strategy. The RSI is likely the most flexible and easy to use among the technical indicators.
This trading strategy tries to catch short-term swings on the coins of your choice with a simple yet profitable setup.
Buy when the RSI is lower than 30 (you can adjust it to 35 in times of steep uptrend).
Sell when the RSI is greater than 65 (the target may range between 60 and 75 depending on the volatility of the coin).
Note that the buy signal comes when the indicator crosses below 30 and not when it crosses above 30 as it happens on the built-in RSI strategy on Tradingview.
The present script overperforms the built-in strategy, even adding trading fees and using a lower amount of capital for each trade (30%). That means that the system can deliver higher net-profits with lower risk levels.
A typical example of market conditions where this strategy works perfectly is as follows.
The first initial breakout indicates that a new leg up in the trend may start. Bitcoin starts to trade within a range which you can identify when it reaches the point 3. That is the perfect time to start the rule because
- trading within a channel anticipates possible swings up and down
- the trend is on the upside, providing low downside risk in buying the dips.
This strategy works well with selected coins of your choice, and it's a great fit on leverage exchanges like Binance Futures.
If you prefer to run it across all available coins on the market, instead, you may choose an optimized version.

Ichimoku Strategy [CDI]Strategy used in the CDI community that consists of having as a signal to enter long when it crosses the entire Ichimoku cloud .
It is recommended to use the strategy in one hour candles and the profit / loss ratio is 2 to 1 for swing trading, however it can be used at any time frame.
The purpose is to perform a bakctesting quickly by setting the limit and stop in the study settings (Proffit and Loss). It is also possible to deactivate the trades on chart changing the configuration in the settings pannel to visualize more clearly the yellow candles that are marked on the chart to identify the signal of the strategy.
Strategy settings:
- Profit %: approximate profit on each entry
- Loss %: approximate loss limit in each entry
- Crossing Candles: number of candles that establishes the crossing of the Ichimoku clouds
Alerts can be configured.
For more information about the strategy, you can search on YouTube for Hyenuk Chu's video "Cómo construir una buena tasa Riesgo Beneficio"
WARNING:
- For purpose educate only
- The entries are used under your responsibility
