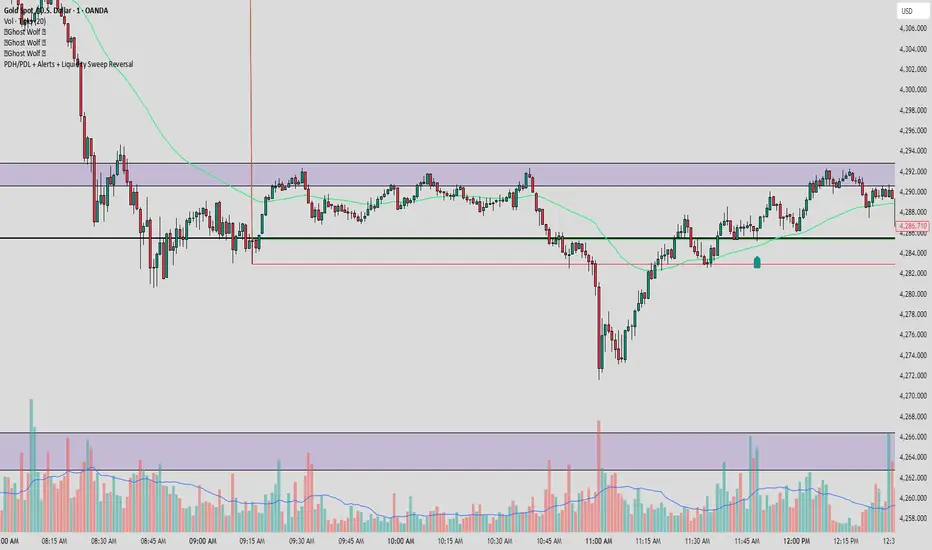
PDH/PDL + Alerts + Liquidity Sweep ReversalThis indicator is designed for traders who utilize Price Action to identify high-probability reversal zones at daily liquidity levels. It automatically plots the Previous Day High (PDH) and Previous Day Low (PDL) and monitors them for institutional "fake-outs" or liquidity sweeps.
Core Functionality
Daily Liquidity Levels: Automatically fetches and plots the PDH and PDL with custom labels and line styles.
Strict Reversal Logic: Unlike standard breakout indicators, this script looks for specific "trap" behavior where price pierces a level and is immediately rejected.
Institutional Precision Tooltips: Includes built-in precision guides for Wick Percentages and Lookback counts based on professional trading standards.
The "Strict Reversal" Setup
The indicator only triggers a Buy/Sell label when three specific criteria are met:
The Lookback: The level must have been respected as a boundary for a user-defined number of candles (Default: 7), confirming its strength.
The Sequence: The candle must open on the "safe" side of the level, pierce through it to grab liquidity, and then close back on the original side.
The Rejection (Wick %): The candle must leave a significant wick (Default: 72%). This 72% threshold aligns with the 2.5x Wick-to-Body ratio, signaling a violent institutional rejection.
Alert Options
The script features four consolidated alert conditions for seamless automation:
Sell Signal (Rejection): Triggers on strict bearish wick sweeps at key levels.
Buy Signal (Rejection): Triggers on strict bullish wick sweeps at key levels.
Price Cross Up: Alerts when price breaks above either PDH or PDL.
Price Cross Down: Alerts when price breaks below either PDH or PDL.
How to Use
Scalping: Use a 3–5 candle lookback on the 1m or 5m timeframe.
Intraday Reversals: Use the 7–10 candle lookback on the 5m or 15m timeframe for standard SMC setups.
Swing Trading: Use the 15+ candle lookback on the 1h or 4h timeframe to target major daily liquidity pools.
Sweep
Liquidity Buy SignalLiquidity Buy Signal is an indicator designed to detect BUY entries based on liquidity (swing lows) combined with a bullish reversal candle pattern. It automatically marks recent swing-low zones/levels, tracks the transition from solid → dashed when a level gets broken, and then confirms a signal when price sweeps/cuts the correct level and a bullish candle pattern appears.
OANDA:EURUSD
BUY signal (green triangle) triggers when:
A bullish reversal candle pattern (based on a set of rules) is detected, and
The Liquidity chain conditions are satisfied using the most recent swing lows:
Price crosses the level with the lower wick, or
The level is within the lower 30% range of the previous candle (n-1), and
The level does not pass through the bodies of older candles (filtered by lookback).
Key settings:
Pivot Lookback: controls swing-low detection sensitivity.
Swing Area: Wick Extremity / Full Range for zone definition.
Filter lookback older bodies: filters out levels that intersect older candle bodies (skips n-2).
Style: toggle Swing Low display + zone/line colors.
Alerts:
Includes a built-in alertcondition for BUY signals (useful for notifications/webhooks).
This indicator is especially well-suited for identifying potential bottoms in a downtrend.
Note: This tool provides trading signals and should be combined with context (trend/HTF/volume/risk management) before entering trades. Not financial advice.

Aurora Reversal Suite: Liquidity & Inversion ModelConcept & Methodology The Aurora Reversal Suite is not a general-purpose indicator; it is a hard-coded algorithmic implementation of a specific institutional reversal model often referred to as the "2022 Mentorship Model" or "Sweep-to-Inversion" setup.
While many scripts display Liquidity Sweeps or Fair Value Gaps individually, this script solves the problem of "confluence fatigue" by algorithmically enforcing a strict order of operations. It does not alert on every sweep; it alerts only when a specific sequence of price action events occurs in a verified order.
The Algorithmic Logic (How it Works) The core value of this script lies in its conditional filtering logic, which automates the following manual verification process:
Event A: Liquidity Sweep
The script first monitors key institutional levels: Previous Day High/Low, Session High/Low (Asia/London/NY), and dynamic Swing Points.
It detects a "Sweep" event when price breaches a level but fails to close beyond it (or closes back inside within a defined lookback period).
Event B: Displacement & Inversion
Unlike standard FVG indicators, this script searches specifically for Inversion FVGs (iFVG) that form immediately following the sweep event.
The script logic requires that the iFVG be created by the displacement leg that reverses the sweep. This binds the "Entry Signal" directly to the "Liquidity Event."
Event C: Algorithmic Filtering (The "Strict" Mode)
To filter out false positives common in choppy markets, the script applies a multi-layer filter before printing a signal:
Volume Qualification: The signal bar's volume must exceed a user-defined multiple of the N-period average volume (default 1.5x) to confirm institutional participation.
SMT Divergence Filter: The script cross-references a correlated asset (e.g., NQ vs. ES or EU vs. DXY). If enabled, a signal is only valid if the correlated asset failed to make a matching high/low at the moment of the sweep (SMT Divergence).
Bias Alignment: The script calculates directional bias using a waterfall logic (Daily > 4H > 1H). Signals counter to this calculated bias are suppressed in "Strict" mode.
Included Features & Components
Automated Market Structure: Real-time labeling of BOS (Break of Structure) and MSS (Market Structure Shift) based on swing point logic.
Session Killzones: Visual boxes for Asia, London, and NY sessions with auto-extending high/low lines to track session liquidity.
Multi-Timeframe Dashboard: A calculated table displaying the trend state of the Daily, 4H, and 1H timeframes to assist with top-down analysis.
Power of 3 (PO3) Overlay: Visualization of higher-timeframe candle geometry on lower-timeframe charts to identify accumulation/distribution phases.
Why This Mashup is Necessary Attempting to trade this specific reversal model using separate indicators results in chart clutter and conflicting signals. By combining the Sweep detection, iFVG creation, and SMT filtering into a single codebase, we can programmatically eliminate "naked" sweeps that have no displacement, providing a cleaner and more objective view of the market structure.
Settings & Customization
Signal Mode: Choose between "Simple" (Price Action only) or "Strict" (Trend + Volume filtered).
SMT Input: Manually define the correlated asset ticker for divergence checks.
Visuals: Fully customizable colors for Bullish/Bearish scenarios to fit light or dark themes.
Disclaimer This script is a tool for market analysis and does not guarantee future results. It is intended to assist traders in identifying high-probability setups based on historical price action concepts.

Quarterly Theory (Lé Modél) 🧪 [Ultimate +] | cephxsQUARTERLY THEORY (LÉ MODÉL) 🧪
SSMT + Timed Structural Swing Points + Alerts
This is mostly types using voice typing so the punctuation might be off.
This indicator uses public domain information based on a trading system called "Quarterly Theory" by TraderDaye & ICT. All concepts are freely available educational material that's been around for years. I just built a tool to visualize it properly.
WHAT IS THIS?
Alright so basically this is my attempt (pretty good attempt I'd say) at building the ultimate quarterly theory tool. It tracks multiple timeframe cycles (monthly, weekly, daily, 90m, and micro) and detects when correlated assets are diverging from each other at key swing points. That's the SSMT (sequential smt) part otherwise called an Offset Divergence either in an Accumulation/distribution phase of price.
On top of that, it finds timed structural swing points with their exact formation times, detects liquidity purges, and confirms change in state of delivery (CISD) through orderblock reclaims. Everything is wrapped in a pretty comprehensive alert system so you can actually trade off this stuff without staring at charts 24/7.
CORE FEATURES
Multi-Cycle SSMT Detection: tracks divergences across 5 nested cycles - monthly, weekly, daily, 90m, and micro. each cycle has its own visibility gates so you're only seeing what's relevant to your chart timeframe. They are also customizable so you are not restricted to what I think is best; nevertheless, hard gates are put in place to prevent unnecessary data calls too far back into history to allow users of all plans to use without errors (Bar data limits)
Timed Swing Points: every pivot high/low gets timestamped. you'll see exactly when the swing formed - super useful for macro window analysis (those :00-:10 and :50-:00 minute windows).
Liquidity Purges: automatically detects when price sweeps a previous swing high/low and reverses. shows both the sweep level and confirmation.
CISD (Change In State of Delivery): finds the stretch candle at pivots and waits for price to reclaim it. that's your delivery change confirmation.
Auto Asset Detection: just throw it on any chart and it figures out the correlated assets for you. works with indices ( CME_MINI:NQ1! , CME_MINI:ES1! , CBOT_MINI:YM1! ), forex majors ( FOREXCOM:EURUSD , FOREXCOM:GBPUSD ), metals ( FOREXCOM:XAUUSD , FOREXCOM:XAGUSD ), crypto, and more.
Normal + Hidden Divergences: normal divergence is when extremes diverge between assets. hidden divergence uses body closes instead of wicks - sometimes catches moves that normal misses.
Comprehensive Alert System: atomic alerts for individual events, preset combos for multi-confluence setups, and a custom "alert kitchen" to build your own conditions.
Each of these features can be visually disabled individually while the logic is still computed and alerts still function without bother.
THE CYCLES EXPLAINED
quarterly theory breaks time down into nested fractal cycles. each cycle divides into 4 quarters (Q1, Q2, Q3, Q4) where Q2 is typically expansion/displacement:
Monthly Cycle: tracks the 4 weeks of the month. best viewed on 4H charts and above
Weekly Cycle: Mon-Tue-Wed-Thu-Fri as the 5 "quarters". best on 1H charts.
Daily Cycle: the trading day split into 4 sessions (asia, london, ny am, ny pm). best on 15m.
90m Cycle: 6 x 90-minute windows throughout the day. best on 3-5m charts.
Micro Cycle: 22.5-minute quarters within each 90m block. 1m charts only.
Tried to implement a new Quarterly Cycle, will defer that to a later update.
VISIBILITY GATES
the indicator automatically shows/hides cycles based on your chart timeframe. here's how it works:
Auto Mode (recommended):
Micro: 1m only
90m: 3m-5m
Daily: 15m only
Weekly: 1H only
Monthly: 4H only
Extended Mode (more flexibility):
Micro: 1m-3m
90m: 1m-30m
Daily: 5m-1H
Weekly: 15m-4H
Monthly: 4H-1D
you can also set custom ranges or just show everything with "All" mode.
INPUTS BREAKDOWN
Visual Preset
All Features: shows everything - SSMT, time labels, CISD, purges
SSMT + TIME + CISD: hides purge lines for cleaner charts
SSMT + CISD: hides time labels too
SSMT Only: just the divergence lines, nothing else
SSMT Plots (Section 2)
Extreme Detection Mode: "Normal" uses wick extremes, "Hidden" uses body closes, "All" shows both
Per-Cycle Toggles: enable/disable each cycle independently with custom colors
Label Styling: choose between "Cycle + Asset", "Cycle" only, or "Asset" only labels
Pivot Detection (Section 3)
Sensitivity: controls how many bars on each side to confirm a swing (default: 2)
Maximum Points: limits how many pivots are displayed
Pivot Labels (Section 4)
Show Time Labels: displays the exact timestamp of each swing
Key Times Only: only shows labels for swings in macro windows (:00-:10, :24-:36, :50-:59)
Macro Colors: special highlighting for pivots during macro windows
Purge Detection (Section 5-6)
Pending Timeout: how many bars a purge can wait for confirmation before being discarded
Strict Key Time: requires both the sweep AND confirmation to be in key time windows
Dotted Line Offset: how far the confirmation line extends past the reversal candle
CISD Detection (Section 7-8)
Size Filter: filters out tiny orderblocks using ATR-based sizing. options from "Really Small" (shows most) to "Juicy" (only big ones)
Pending Timeout: bars before an unconfirmed CISD expires
Exhaustive Mode: shows all valid CISDs instead of limiting to max count
ALERT SYSTEM
this is where it gets powerful. three tiers of alerts:
Atomic Alerts (individual events):
Swing High/Low formed
Bearish/Bullish Purge confirmed
CISD Confirmed/Pending
Purge + CISD Combo
Preset Combos (multi-confluence):
M/W/D/90/Micro SSMT + CISD: fires when SSMT divergence is active AND CISD confirms in matching direction
Require Matching Purge: adds purge to the combo requirement
Stacked Alerts: triggers when 2+ cycles align simultaneously
Alert Kitchen (custom builder):
build your own combo by selecting:
Which SSMT cycle (with direction: bullish/bearish/any)
Whether CISD is required
Whether matching purge is required
Purge tolerance (how close the purge pivot needs to be)
Session Filter:
all alerts can be filtered to only fire during specific sessions:
Asia: 18:00-00:00 ET
London: 02:00-05:00 ET
NY AM: 08:30-12:00 ET
NY PM: 13:30-16:00 ET
Custom time ranges
AUTO ASSET DETECTION
the indicator uses the AssetCorrelation library to automatically figure out which assets to compare. here's what it supports:
US Indices: CME_MINI:NQ1! , CME_MINI:ES1! , CBOT_MINI:YM1! (or micros MNQ/MES/MYM)
Forex Majors: FOREXCOM:EURUSD , FOREXCOM:GBPUSD vs TVC:DXY
Metals: FOREXCOM:XAUUSD , FOREXCOM:XAGUSD , Copper
Energy: CL (crude), RB (gasoline), HO (heating oil)
Crypto: BTC, ETH, TOTAL3 as triad
EU Indices: GER40, EU50, UK100, ESP35
you can also disable auto mode and manually configure your own asset triads/dyads.
STATUS BAR
optional horizontal bar showing which SSMT cycles are currently active. displays M | W | D | 90m | Micro with color coding:
Blue = bullish divergence active
Red = bearish divergence active
Gray = neutral (no divergence)
Purple = both directions active simultaneously (sandwich)
RECOMMENDED USAGE
start with "Auto" timeframe gating - it shows the right cycles for your chart
focus on cycles that align with your trading style (scalpers: 90m/micro, swing: daily/weekly)
use CISD confirmation before entries - divergence alone isn't enough (at least for me)
Pair with True Opens to align properly (This is a trading model in itself)
set up preset alerts for your main setup (e.g., "D SSMT + CISD" on 15m chart)
filter alerts to your active trading session to reduce noise
TIMEFRAME CHEAT SHEET
1m: Micro cycle + 90m context
3-5m: 90m cycle + Daily context
15m: Daily cycle + Weekly context
1H: Weekly cycle + Monthly context
4H: Monthly cycle only
FAQ
why don't i see any SSMT lines?
check your timeframe gating mode. if you're on a 15m chart with "Auto" mode, you'll only see Daily cycle. switch to "Extended" or "All" to see more cycles.
what's the difference between normal and hidden divergence?
normal uses wick highs/lows, hidden uses body closes. hidden can catch divergences that wicks miss, but it's also noisier.
Why do some CISDs not confirm?
the stretch candle needs to be reclaimed by price within the timeout window. if price never comes back to that level, the CISD expires.
can i use this on stocks?
technically yes, but you'll need to manually configure your asset pairs since auto-detection focuses on futures/forex/crypto.
DISCLAIMER
this is an educational tool, not financial advice. quarterly theory, SSMT, and all related concepts are based on publicly available information from TraderDaye and ICT methodology on X with a touch of my own discoveries too.
past performance doesn't guarantee future results. always use proper risk management and never trade more than you can afford to lose. the indicator is provided as-is with no guarantees.
do your own backtesting before using this in live markets.
CREDITS
Quarterly Theory concepts: TraderDaye & ICT
AssetCorrelation library: fstarcapital
Development: cephxs & fstarcapital community
CHANGELOG
Ultimate +: added Alert Kitchen, stacked cycle alerts, session filtering, status bar, size-filtered CISD
Pro +: added hidden divergences, added sweep detection/plots, auto asset detection, preset combos
Base: initial release with core SSMT and pivot time labels
No form of this Library is to be sold in any capacity as part of any service / indicator on the TradingView Platform or elsewhere by anyone else but me.
Otherwise it is completely free to use in private and public open/closed source indicators.
Sidenote: 3rd upload because I'm trying to get the thumbnail right :(
Made with ❤️ from cephxs

ZynIQ Liquidity Master Pro v2 - (Pro Pack)Overview
ZynIQ Liquidity Master v2 (Pro) identifies key liquidity pools and sweep zones using automated swing logic, equal-high/low detection and multi-level liquidity mapping. It provides a clear view of where liquidity may be resting above or below price, helping traders understand potential sweep or mitigation behaviour.
Key Features
• Automatic detection of EQH/EQL (equal highs/lows)
• Mapping of major swing liquidity zones
• Optional PDH/PDL (previous day high/low) and weekly levels
• Detection of potential liquidity sweep areas
• Clean labels for swing points and liquidity clusters
• Configurable sensitivity for different markets or timeframes
• Lightweight visuals with minimal clutter
Use Cases
• Identifying major liquidity pools above or below price
• Spotting potential sweep conditions before reversals
• Anchoring market structure or FVG tools with liquidity context
• Understanding where price may target during expansion moves
Notes
This tool identifies areas of resting liquidity based on swing and equal-high/low logic. It is not a standalone trading system. Use with your preferred confirmation and risk management.

Titan EMA Liquidity [Stansbooth]
🔥 Precision EMA + FVG Liquidity Sweep System
Advanced Buy/Sell Signal Engine for High-Probability Trade Entries
Unlock a new level of precision with this all-in-one market structure indicator built for traders who demand accuracy, clarity, and confidence.
This tool combines EMA trend filtration , Fair Value Gap (FVG) detection , and liquidity sweep analysis to deliver powerful buy and sell signals that align with institutional price behavior.
✅ Key Features
Dynamic EMA Trend Filter:
Identifies true trend direction and filters out low-quality trades. Signals only trigger when momentum aligns with higher-timeframe directional bias.
Smart FVG Detection:
Automatically highlights bullish and bearish Fair Value Gaps, helping you spot premium/discount zones where institutional traders seek entries.
Liquidity Sweep Identification:
Detects equal highs/lows, stop hunts, and engineered liquidity grabs—then confirms reversals when price sweeps liquidity and returns inside structure.
High-Accuracy Signal Engine:
Buy/Sell alerts trigger only when three layers agree:
1. EMA trend alignment
2. FVG confirmation
3. Liquidity sweep completion
This results in cleaner signals , fewer false entries, and strong trend continuation setups.
Optimized for All Market Conditions:
Works for scalping, day trading, and swing trading across Forex, Crypto, Indices, and Stocks.
What This Indicator Helps You Achieve
Capture smart-money style entries with reduced drawdown
Enter after liquidity grabs instead of before them
Avoid chop with EMA-filtered market direction
Spot precision premium/discount zones using automatic FVG mapping
Obtain high-confidence Buy/Sell signals based on institutional concept
Why Traders Love It
This system isn’t just another signal generator—it’s a market-structure aware model that reads the chart the same way professional traders do.
Every signal is based on probability stacking , giving you the clarity and confidence to take the best setups while ignoring noise.

amir Liquidity Sweeps [amir]this indicator is from luxalgon i think this is the code that made this incdicator never get destroyed by aanyone

Liquidity Hunt Detector PDH/PDL [SmartFoxy]Liquidity Hunt Detector PDH/PDL
The Liquidity Hunt Detector (LHD) is designed to identify and anticipate liquidity grabs around the:
• Previous Day High (PDH);
• Previous Day Low (PDL).
It builds dynamic trigger levels that highlight where price may deliver its first impulse before reaching PDH/PDL.
The Liquidity Hunt Detector (LHD) identifies high-probability reversals and continuations around the Previous Day High (PDH) and Previous Day Low (PDL).
It dynamically tracks the market’s move from the session open, builds trigger levels toward PDH/PDL, and highlights where liquidity is most likely to be taken.
When price taps a Trigger Up/Down level, the indicator generates Long/Short signals with optional confirmation from the integrated MA Ribbon , ensuring only high-quality, trend-aligned setups are shown.
When price interacts with these trigger levels, the indicator generates signals that help traders evaluate the market structure and prepare for potential entries.
Designed for Forex, Crypto, Indices, Stocks , the LHD provides a clean and intuitive structure for navigating intraday liquidity grabs, session impulses, and directional bias shifts.
The indicator is built from three fully independent modules, each of which can be used separately:
Liquidity Hunt Detector (LHD)
Moving Average Ribbon (MA Ribbon)
Previous Day High/Low (PDH/PDL) levels
Liquidity Hunt Detector (LHD) Logic
1.1 Display LHD – Enables or disables the entire Liquidity Hunt Detector module.
1.2 Max Days – Number of previous days used to generate PDH/PDL levels.
1.3 GMT – Corrects all time-based calculations based on your broker/session timezone.
1.4 Calculation Method (Point A Logic)
1) Static Method
Point A = the session’s opening price.
Trigger lines are calculated strictly as a percentage of the move A → PDH or A → PDL.
Intraday fluctuations do not affect the calculation.
2) Dynamic Method
Point A updates using the current intraday high/low:
• If price forms a new low, Point A updates for the PDH-side calculations;
• If price forms a new high, Point A updates for the PDL-side calculations.
This produces trigger lines that reflect the true live market structure rather than a fixed opening reference.
1.5 Main OTT Time (Operational Trading Time)
This is the core time window during which the indicator:
• updates Point A;
• calculates trigger levels;
• validates PDH/PDL;
• draws AB / AC movement structure;
• generates entry signals.
Outside this window, no new signals or recalculations occur.
⚠ If your broker’s first candle opens at a non-standard time (e.g., 00:08), adjust the OTT start time to avoid visual artifacts.
1.6 Show Line A – Displays the opening price level (Point A) until the end of the OTT window.
Style, width, and color are customizable.
1.7 Show Line AB — Price Movement Toward PDH.
Static Method – Single line: A → PDH
Dynamic Method – Two segments:
• A → Daily Low;
• Daily Low → PDH.
If PDH is swept, the “B” label switches to Sweep PDH.
1.8 Show Line AC – Price Movement Toward PDL.
Static Method – Single line: A → PDL
Dynamic Method – Two segments:
• A → Daily High;
• Daily High → PDL.
If PDL is swept, the “C” label switches to Sweep PDL.
1.9 Show Trigger Up Line (LONG Trigger) – Defines the level where the Long signal can activate.
By default, at 50% of the A → PDH movement.
When price touches this line, the script may:
• show a LONG label;
• trigger an alert.
All visual parameters are customizable.
1.10 Show Trigger Up Line (LONG Trigger)
Same logic as Trigger Up, but based on A → PDL.
1.11 Show Main Zone (OTT Zone) – Visual background highlighting of the active OTT window.
Helps instantly see:
• whether signals are allowed;
• how much time remains in the trading window?
Color and opacity are adjustable.
1.12 Upper Zone (toward PDH) – Tracks the protected area towards PDH.
Updates dynamically with new highs.
1.13 Lower Zone (toward PDL) – Tracks the zone toward PDL.
Updates dynamically with new lows.
1.14 Show Labels – Displays reference labels (A, B, C, Trigger Up, Trigger Down).
Label size is customizable.
1.15 Add Price – Adds the exact price value to each label.
1.16 Change Color after Sweep PDH or PDL – After PDH or PDL is broken, the indicator automatically recolors lines and labels to visually confirm the sweep.
1.17 Show SHORT Label – Displays the SHORT entry label when all conditions for a bearish signal are met.
Style parameters are set in the previous blocks.
1.18 Alert on Bearish Trigger Down – Triggers an alert when the price activates the bearish trigger.
1.19 Show LONG Label – Displays the LONG entry label when bullish conditions are met.
Style parameters are set in the previous blocks.
1.20 Alert on Bullish Trigger Up – Triggers an alert when the price activates the bullish trigger.
1.21 Alerts Active Time – Defines a custom time interval during which trigger signals are allowed.
Even if price touches a trigger level,
❗ signals will NOT be generated outside this allowed time.
Useful for:
• avoiding Asian session signals;
• reducing noise in low-liquidity periods.
1.22 Labels and Alerts Display Mode
Two settings modes:
• On Trigger (Instant Mode) – Signals appear immediately when price touches the trigger.
• On Candle Close (Conservative Mode) – Signals form only after the candle closes beyond the trigger level.
A more conservative option.
1.23 Delay LHD Signal Until MA Ribbon Confirms Direction – If enabled, LHD signals will NOT fire until the MA Ribbon produces a matching directional signal.
Logic:
• Price hits the trigger → LHD conditions become “armed”;
• The indicator waits;
• When MA Ribbon confirms trend direction (Long/Short);
• The final LHD label + alert is generated.
This ensures LHD trades are filtered and aligned with MA-based trend confirmation.
⚠ Works only when the MA Ribbon module is active.

Quantura - Liquidity Sweep & Run LevelsIntroduction
“Quantura – Liquidity Sweep & Run Levels” is a structural price-action indicator designed to automatically detect swing-based liquidity zones and visualize potential sweep and run events. It helps traders identify areas where liquidity has likely been taken (sweep) or released (run), improving precision in market structure analysis and timing of entries or exits.
Originality & Value
This tool translates institutional liquidity concepts into an automated visual framework. Instead of simply marking highs and lows, it dynamically monitors swing points, tracks their breaches, and identifies subsequent reactions. The indicator is built to highlight the liquidity dynamics that often precede reversals or continuations.
Its originality lies in:
Automatic identification and tracking of swing highs and lows.
Real-time detection of broken levels and liquidity sweeps.
Distinction between “Run” and “Sweep” modes for different market behaviors.
Persistent historical visualization of liquidity levels using clean line structures.
Configurable signal markers for bullish and bearish sweep confirmations.
Functionality & Core Logic
Detects swing highs and lows using a user-defined Swing Length parameter.
Stores and updates all swing levels dynamically with arrays for efficient memory handling.
Draws horizontal lines from each detected swing point to visualize potential liquidity zones.
Monitors when price breaks a swing level and marks that event as “broken.”
Generates signals when the market either sweeps above/below or runs away from those levels, depending on the chosen mode.
Provides optional visual signal markers (“▲” for bullish sweeps, “▼” for bearish sweeps).
Parameters & Customization
Mode: Choose between “Sweep” (detects liquidity grabs) or “Run” (detects breakout continuations).
Swing Length: Sets the sensitivity for detecting swing highs/lows. A higher value focuses on larger structures, while smaller values detect micro liquidity points.
Bullish Color / Bearish Color: Customize color themes for sweep/run lines and signal markers.
Signals: Enables or disables visual up/down markers for confirmed events.
Visualization & Display
Horizontal lines represent potential liquidity levels (unbroken swing highs/lows).
Once broken, lines automatically stop extending, marking the moment liquidity is taken.
Depending on the selected mode:
“Sweep” mode identifies false breaks or stop-hunt behavior.
“Run” mode highlights breakouts that continue the trend.
Colored arrows indicate the direction and type of liquidity reaction.
Clean, non-intrusive visualization suitable for overlaying on price charts.
Use Cases
Detect liquidity sweeps before major reversals.
Identify breakout continuations after liquidity runs.
Combine with Supply/Demand or FVG indicators for multi-layered confirmation.
Validate liquidity bias in algorithmic or discretionary strategies.
Analyze market manipulation patterns and institutional stop-hunting behavior.
Limitations & Recommendations
This indicator identifies structural behavior but does not guarantee trade direction or profitability.
Works best on liquid markets with clear swing structures (e.g., crypto, forex, indices).
Signal interpretation should be combined with confluence tools such as volume, order flow, or structure-based filters.
Excessively small swing settings may cause over-signaling in volatile markets.
Markets & Timeframes
Optimized for all major asset classes — including crypto, Forex, indices, and equities — and for intraday to higher-timeframe structural analysis (5-minute up to daily charts).
Author & Access
Developed 100% by Quantura. Published as a Open-source script indicator. Access is free.
Compliance Note
This description fully complies with TradingView’s Script Publishing Rules and House Rules . It avoids performance claims, provides transparency on methodology, and clearly describes indicator behavior and limitations.

Stealth Liquidation Heatmap V6.4Stealth Liquidation Heatmap v6.4
Overview
A chart-native liquidity map that infers potential liquidity zones directly from price action on a selected higher timeframe (HTF). No external liquidation feeds are used. Boxes are time-anchored to HTF candles, extend to the right on lower timeframes, and turn gray once swept.
How it works (high level)
The core engine is multi-oscillator: an EMA-differential (MACD-style) momentum line with its smoothing line, assisted by auxiliary volatility/momentum filters. Triggers are evaluated on confirmed HTF closes to avoid intra-bar noise.
When aligned momentum conditions occur on the Signal TF:
• a bullish zone anchors slightly below the HTF candle’s low,
• a bearish zone anchors slightly above the HTF candle’s high.
Boxes use xloc=bar_time (anchored to the HTF candle’s timestamp) so levels line up cleanly on lower-timeframe charts. Box height is user-selectable (High–Low, Body |C–O|, or custom % of price). Right-extension length is measured in bars of the current chart timeframe.
Sweep logic & visuals
A zone is marked “swept” (turns gray) when a selected mode is met:
• Any touch inside the box, or
• Wick touching the outer edge (default), or
• Close beyond the edge.
Options include arm delay, freeze after sweep, show/hide swept zones, and age-based fading for clarity.
Presets
• Aggressive — momentum-only with higher sensitivity (more zones).
• Normal — momentum-only with balanced sensitivity (additional smoothing/thresholding to reduce noise).
• Conservative — momentum-only with stricter filtering (fewer zones).
How to use
Best viewed on 5–15m charts with a 4h or 1D Signal TF. Treat zones as areas where liquidity may cluster or be swept; combine with your own TA and risk management. Height/sweep/extension/fade controls help tailor visuals to instrument volatility.
Screenshot example:
Notes & limitations
This tool does not access real liquidation/OI feeds; it infers liquidity behavior algorithmically from price-based momentum structure. Because evaluations are anchored to HTF closes, new triggers finalize after the source HTF bar closes. Right-extension is measured in bars of the current chart timeframe. Visual/educational use only; not financial advice.

FVG - Sweep [TradeWithRon]FVG – Sweep - A multi-layer liquidity and imbalance detection system designed to help traders identify high-probability zones where price is likely to react.
🔍 Overview
This indicator combines Sweep Detection , Fair Value Gap (FVG) logic, and Change in State of Delivery (CISD) confirmation into a single streamlined tool. It helps traders visually connect liquidity grabs, displacement imbalances, and continuation or reversal opportunities — all in one chart.
⚙️ How It Works
1. Sweep Detection (Liquidity Grabs)
Detects when price takes liquidity above a previous high or below a previous low, then rejects it.
Alerts trigger when a bullish or bearish sweep is confirmed.
2. CISD Confirmation (Change in State of Delivery)
Identifies structural shifts using candle body direction and previous swing breaks.
Confirms when price transitions from expansion to contraction or vice versa.
CISD alerts notify when new shifts occur on any selected timeframe.
3. Fair Value Gap (FVG) Detection
Automatically highlights the first valid FVG following a confirmed sweep optional or CISD.
Optional alert for IFVG confirmation.
🧩 Why It’s Powerful
Multiple conditions across separate tools — sweeps, imbalances, and structure shifts.
This indicator integrates all three into one system that can:
Detect liquidity grabs,
Confirm displacement through FVGs,
Validate momentum or reversals with CISD logic.
🧩 Ideal Use Case
Combine this tool with your existing strategy to:
Build liquidity + imbalance confluence zones
Spot reversal setups after sweeps
Track continuations after structural shifts
Automate alerts for precision entries
Project Pegasus RevenantDescription
Project Pegasus Revenant is a reversal and liquidity-trap detection system combining a configurable fractal reversal engine with the SweepTrigger liquidity finder. It highlights potential structural turning points and stop-hunt scenarios directly on the chart.
What’s unique
Fractal Reversal Engine: Adjustable strictness (1 = loose, 5 = strict) to fit different market conditions.
Signal Filtering: Minimum bar spacing to avoid clustering of false or repeated signals.
SweepTrigger Add-on: Detects liquidity sweeps with wick-based rejection logic, auto-doji detection, and range-strength confirmation.
Dual Signal Output: Circle markers for pure fractal reversals, triangles for sweep-based liquidity traps.
Adaptive Filters: Customizable thresholds for body size, candle range, and sweep strength.
How it works (technical)
Fractals: A reversal fractal is confirmed when the high/low at position n is surrounded by lower/higher highs/lows across a configurable frontier.
Signal confirmation: Once price trades back through the fractal level within a limited number of bars, a potential reversal is triggered.
Bar filter: Signals require a minimum distance in bars to prevent noise.
SweepTrigger logic:
Wick comparison (upper vs lower) determines rejection direction.
Doji and low-body candles are auto-filtered.
Range check ensures the current candle exceeds a configurable multiple of the average range.
Visuals:
Green/Red circles = fractal reversals.
Cyan/Purple triangles = liquidity sweep triggers.
How to use
Watch fractal signals to anticipate structural reversal points.
Combine SweepTrigger signals with liquidity highs/lows for identifying stop hunts and fakeouts.
Use as standalone reversal tool or as confirmation within a broader system (e.g., order blocks, volume profile, or market structure).
Key settings
Reversal Mode: 1–5 (controls strictness of fractals).
SweepTrigger: On/off toggle, lookback window, body-size filter, range strength multiplier.
Visuals: Shapes, sizes, and color-coded signals for clear separation between fractal and sweep triggers.
Notes & limitations
Works on all timeframes.
Signals are reactive (based on confirmed bars), not predictive — no lookahead logic.
Too strict settings may reduce signal frequency; too loose may increase noise.
Disclaimer
For educational and informational purposes only. Not financial advice.

$ - HTF Sweeps & PO3HTF Sweeps & PO3 Indicator
The HTF Sweeps & PO3 indicator is a powerful tool designed for traders to visualise higher timeframe (HTF) candles, identify liquidity sweeps, and track key price levels on a lower timeframe (LTF) chart. Built for TradingView using Pine Script v6, it overlays HTF candle data and highlights significant price movements, such as sweeps of previous highs or lows, to help traders identify potential liquidity sweep and reversal points. The indicator is highly customisable, offering a range of visual and alert options to suit various trading strategies.
Features
Higher Timeframe (HTF) Candle Visualisation:
- Displays up to three user-defined HTF candles (e.g., 15m, 1H, 4H) overlaid on the LTF chart.
- Customisable candle appearance with adjustable size (Tiny to Huge), offset, spacing, and colours for bullish/bearish candles and wicks.
- Option to show timeframe labels above or below HTF candles with configurable size and position.
Liquidity Sweep Detection:
- Identifies bullish and bearish sweeps when price moves beyond the high or low of a previous HTF candle and meets specific conditions.
- Displays sweeps on both LTF and HTF with customisable line styles (Solid, Dashed, Dotted), widths, and colours.
- Option to show only the most recent sweep per candle to reduce chart clutter.
Invalidated Sweep Tracking:
- Detects and visualises invalidated sweeps (when price moves past a sweep level in the opposite direction).
- Configurable display for invalidated sweeps on LTF and HTF with distinct line styles and colours.
Previous High/Low Lines:
- Plots horizontal lines at the high and low of the previous HTF candle, extending on both LTF and HTF.
- Customisable line style, width, and color for easy identification of key levels.
- Real-Time Sweep Detection:
-Optional real-time sweep visualisation for active candles, enabling traders to monitor developing price action.
Alert System:
- Triggers alerts for sweep formation (when a new sweep is detected).
- Triggers alerts for sweep invalidation (when a sweep is no longer valid).
- Alerts include details such as timeframe, ticker, and price level for precise notifications.
Performance Optimisation:
- Efficiently manages resources with configurable limits for lines, labels, boxes, and bars (up to 500 each).
- Cleans up outdated visual elements to maintain chart clarity.
Flexible Configuration:
- Supports multiple timeframes for HTF candles with user-defined settings for visibility and number of candles displayed (1–60).
- Toggle visibility for HTF candles, sweeps, invalidated sweeps, and high/low lines independently for LTF and HTF.
This indicator is ideal for traders focusing on liquidity hunting, order block analysis, or price action strategies, providing clear visual cues and alerts to enhance decision-making.

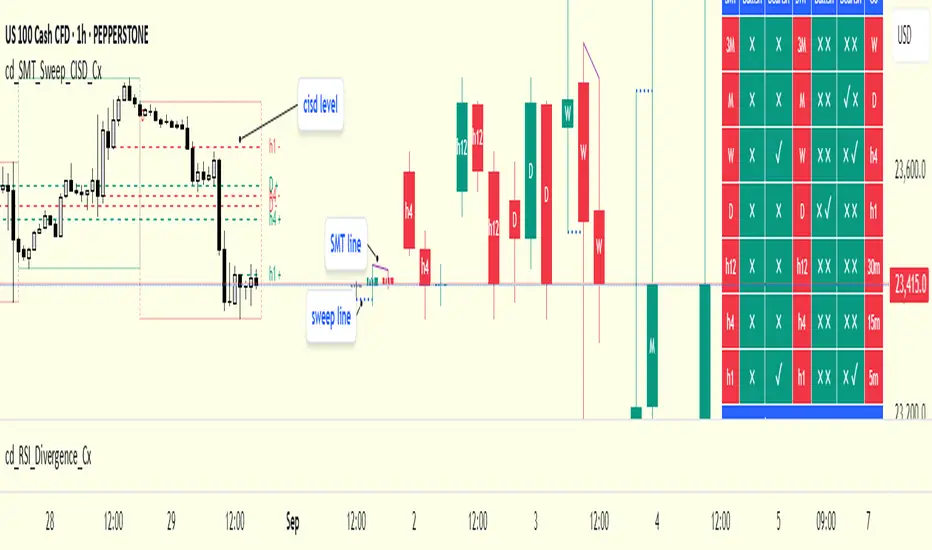
cd_indiCATor_CxGeneral:
This indicator is the redesigned, simplified, and feature-enhanced version of the previously shared indicators:
cd_cisd_market_Cx, cd_HTF_Bias_Cx, cd_sweep&cisd_Cx, cd_SMT_Sweep_CISD_Cx, and cd_RSI_divergence_Cx.
Within the holistic setup, the indicator tracks:
• HTF bias
• Market structure (trend) in the current timeframe
• Divergence between selected pairs (SMT)
• Divergence between price and RSI values
• Whether the price is in an important area (FVG, iFVG, and Volume Imbalance)
• Whether the price is at a key level
• Whether the price is within a user-defined special timeframe
The main condition and trigger of the setup is an HTF sweep with CISD confirmation on the aligned timeframe.
When the main condition occurs, the indicator provides the user with a real-time market status summary, enriched with other data.
________________________________________
What’s new?
-In the SMT module:
• Triad SMT analysis (e.g.: NQ1!, ES1!, and YM1!)
• Dyad SMT analysis (e.g.: EURUSD, GBPUSD)
• Alternative pair definition and divergence analysis for non-correlated assets
o For crypto assets (xxxUSDT <--> xxxUSDT.P) (e.g.: SOLUSDT.P, SOLUSDT)
o For stocks, divergence analysis by comparing the asset with its value in another currency
(BIST:xxx <--> BIST:xxx / EURTRY), (BAT:xxx <--> BAT:xxx / EURUSD)
-Special timeframe definition
-Configurable multi-option alarm center
-Alternative summary presentation (check list / status table / stickers)
________________________________________
Details and usage:
The user needs to configure four main sections:
• Pair and correlated pairs
• Timeframes (Auto / Manual)
• Alarm center
• Visual arrangement and selections
Pair Selections:
The user should adjust trading pairs according to their trade preferences.
Examples:
• Triad: NQ1!-ES1!-YM1!, BTC-ETH-Total3
• Dyad: NAS100-US500, XAUUSD-XAGUSD, XRPUSDT-XLMUSDT
Single pairs:
-Crypto Assets:
If crypto assets are not in the triad or dyad list, they are automatically matched as:
Perpetual <--> Spot (e.g.: DOGEUSDT.P <--> DOGEUSDT)
If the asset is already defined in a dyad list (e.g., DOGE – SHIB), the dyad definition takes priority.
________________________________________
-Stocks:
If stocks are defined in the dyad list (e.g.: BIST:THYAO <--> BIST:PGSUS), the dyad definition takes priority.
If not defined, the stock is compared with its value in the selected currency.
For example, in the Turkish Stock Exchange:
BIST:FENER stock, if EUR is chosen from the menu, is compared as BIST:FENER / OANDA:EURTRY.
Here, “OANDA” and the stock market currency (TRY) are automatically applied for the exchange rate.
For NYSE:XOM, its pair will be NYSE:XOM / EURUSD.
________________________________________
Timeframes:
By default, the menu is set to “Auto.” In this mode, aligned timeframes are automatically selected.
Aligned timeframes (LTF-HTF):
1m-15m, 3m-30m, 5m-1h, 15m-4h, 1h-D, 4h-W, D-M
Example: if monitoring the chart on 5m:
• 1h sweep + 5m CISD confirmation
• D sweep + 1h CISD confirmation (bias)
• 5m market structure
• 1h SMT and 1h RSI divergence analysis
For manual selections, the user must define the timeframes for Sweep and HTF bias.
FVG, iFVG, and Volume Imbalance timeframes must be manually set in both modes.
________________________________________
Alarm Center:
The user can choose according to preferred criteria.
Each row has options.
“Yes” → included in alarm condition.
“No” → not included in alarm condition.
If special timeframe criteria are added to the alarm, the hour range must also be entered in the same row, and the “Special Zone” tab (default: -4) should be checked.
Key level timeframes and plot options must be set manually.
Example alarm setup:
Alongside the main Sweep + CISD condition, if we also want HTF bias + Trend alignment + key level (W, D) and special timeframe (09:00–11:00), we should set up the menu as follows:
________________________________________
Visual Arrangement and Selections:
Users can control visibility with checkboxes according to their preferences.
In the Table & Sticker tab, table options and labels can be controlled.
• Summary Table has two options: Check list and Status Table
• From the HTF bias section, real-time bias and HTF sweep zone (optional) are displayed
• The RSI divergence section only shows divergence analysis results
• The SMT 2 sub-section only functions when triad is selected
Labels are shown on the bar where the sweep + CISD condition occurs, displaying the current situation.
With the Check box option, all criteria’s real-time status is shown (True/False).
Status Table provides a real-time summary table.
Although the menu may look crowded, most settings only need to be adjusted once during initial use.
________________________________________
What’s next?
• Suggestions from users
• Standard deviation projection
• Mitigation/order blocks (cd special mtg)
• PSP /TPD
________________________________________
Final note:
Every additional criterion in the alarm settings will affect alarm frequency.
Multiple conditions occurring at the same time is not, by itself, sufficient to enter a trade—you should always apply your own judgment.
Looking forward to your feedback and suggestions.
Happy trading! 🎉

Blitz Model
The Blitz indicator is a comprehensive market structure analysis tool designed specifically for the 4-hour timeframe. It identifies and visualizes key market movements including sweeps, fair value gaps (FVGs), and session-based liquidity levels.
1) Key Features :
A) Market Structure Analysis :
i) Sweep Detection: Identifies bullish and bearish sweeps of previous highs/lows.
ii) Double Purge Recognition: Detects when both bullish and bearish sweeps occur on the same candle.
iii) Fair Value Gap (FVG) Visualization: Displays imbalance zones with customizable box colors.
iV) Session-Based Analysis: Tracks Asian and London session highs/lows.
B) Multi-Timeframe Confirmations :
i) Layer 2 Validation System: Incorporates H1 and M15 timeframe confirmations.
ii) H1 Sweep Confirmations: Validates 4H signals with hourly sweep patterns.
iii) M15 Analysis: Includes both sweep and FVG confirmations from 15-minute timeframe.
C) Key Level Integration :
i) Daily 0.5 Level: Plots the midpoint of previous day's range with customizable styling.
ii) Session Liquidity: Identifies sweeps of Asian and London session extremes.
ii) FVG Interaction: Detects when sweeps occur near fair value gaps.
D) Customization Options :
i) Label Styling: Full control over label size, style, and colors for all signal types.
ii) Double Purge Customization: Separate styling options for double purge signals.
iii) Line Customization: Adjustable daily 0.5 line appearance (style, color, width).
iv) Display Controls: Toggle visibility for FVGs, labels, and confirmation history.
2) Technical Specifications
A) Timeframe Requirements :
i) Primary Timeframe: 4H only (indicator will show error on other timeframes).
ii) Multi-Timeframe Data: Analyzes H1 and M15 for confirmations.
iii) Session Times: Configurable start/end times.
B) Signal Validation Criteria :
Sweeps are validated when they occur at one or more of the following conditions:
i) FVG Zones: Price interaction with identified fair value gaps.
ii) Daily Midpoint: Proximity to the 50% level of previous day's range.
iii) Session Levels: Sweeps of Asian (19:00-01:00 NY) or London (02:00-05:00 NY) extremes.
C) Layer 2 Confirmation System :
i) H1 Confirmations (H1S): Sweep patterns on 1-hour charts within the 4H candle formation.
ii) M15 Sweep (M15S): 15-minute sweep confirmations.
iii) M15 FVG (M15F): 15-minute fair value gap formations.
3) Usage Guidelines :
A) Setup Instructions :
i) Apply to 4-hour charts only.
ii) Configure session times based on your analysis preferences.
iii) Customize label appearance and colors to match your chart theme.
iv) Enable/disable features based on your trading style.
B) Signal Interpretation :
i) Green Labels: Bullish sweeps with validation criteria met.
ii) Red Labels: Bearish sweeps with validation criteria met.
iii) Purple Labels: Double purge scenarios (both directions swept).
iv) Checkmark (✓): Indicates Layer 2 multi-timeframe confirmation present.
v) For double purge interpretations :
- Low & High means recent purge (just previous candle)
- Low & High means medium term purge (8H prior)
- Low & High means longer term purge (12H + prior)
4) Compatibility :
Max Objects: Supports up to 500 boxes and labels simultaneously.
5) Support & Updates :
This indicator represents educational concepts in market structure analysis. Users should thoroughly test and understand all signals before considering any practical application.
Disclaimer :
Always practice proper risk management. This is for educational purposes only and is not a financial advice.

Manipulation Ribbon [FxScripts]Manipulation Ribbon
Designed to detect areas of price manipulation by Market Makers vs areas where it is trading in a natural, price-driven state. By identifying zones of control and imbalance, the ribbon provides a clear visualization of where price is being held or artificially displaced, offering key insights into potential future direction.
Indicator Function
Unlike traditional oscillators, the Manipulation Ribbon plots a continuous line or ribbon, with no defined y-axis. The ribbon dynamically adapts to market conditions, allowing the user to spot potential manipulation and price containment vs natural price movement.
Calculation Methodology
The Manipulation Ribbon is derived exclusively from price action. The underlying algorithm evaluates where price is, where it should be and where it’s being held.
The resulting ribbon reflects these dynamics in real time, providing a visual framework for interpreting price behavior at a granular level.
Operational Use: Divergences
The primary use of the Manipulation Ribbon is to locate divergences between price and the ribbon.
There are two distinct types of divergence to look for:
Price Containment: Where the ribbon moves but price doesn’t. This can help identify zones where price is being held, often preceding sharp movements once control is released.
Price Manipulation: Where price moves but the ribbon doesn’t. This can help identify liquidity sweeps, often preceding swift reversals once the liquidity has been taken.
Analytical Scenarios
High Liquidity Sweep: Price forms a higher high while the ribbon forms a lower high. Indicates a liquidity sweep may be occurring at the highs and a potential bearish reversal may be imminent.
Low Liquidity Sweep: Price forms a lower low while the ribbon forms a higher low. Indicates a liquidity sweep may be occurring at the lows and a potential bullish reversal may be imminent.
Top Edge Hold: Upwards movement of the ribbon without price followthrough. Indicates price may be being held at the highs, suggesting Market Makers are artificially holding price down in order to create a top edge and potential bearish reversal.
Bottom Edge Hold: Downwards movement of the ribbon without price followthrough. Indicates price may be being held at the lows, suggesting Market Makers are artificially holding price up in order to create a bottom edge and potential bearish reversal.
Settings
Guides: Option to have dynamic guides applied to your chart. Customizable style, color and width.
Guide Lookback: Due to the ribbon having a non-standard y-axis scale, it’s not possible to plot standard interval guides. Due to technical limitations this value is not calculable automatically either. The upper and lower bounds of the guides are therefore calculated using a user-inputted lookback function. In order to ensure the guides use the correct y-axis on the chart, simply input the average number of bars in your current viewport using the ruler, the guides will automatically update to match this.
Line 1 / Band 1: Option to turn on/off Line 1 and Band 1 alongside updating color and linewidth. Line 1 and Band 1 use the current chart symbol as their source.
Line 2 / Band 2: Option to add a second line and/or band to the chart. Use this to compare any correlated instrument e.g. BTCUSDT and ETHUSDT (as visualized in the chart above) or other pairs such as XAUUSD/XAUEUR or ES/NQ. Due to differences in y-axis scaling it's advised to add this as an additional indicator on a new pane (as per chart above).
Inverse Line 2 / Band 2: Option to show/hide the inverse of Line 2 and Band 2. This is useful for comparing inversely correlated symbols e.g. EURUSD and USDCHF.
Performance and Optimization
Backtesting Results: The Manipulation Ribbon has undergone extensive backtesting across various instruments, timeframes and market conditions, demonstrating strong performance in identifying where price is out of sync with its natural state. User backtesting is strongly encouraged as it allows traders to gain familiarity with the ribbon using their preferred instruments and timeframes.
Optimization for Diverse Markets: The Manipulation Ribbon can be used on crypto, forex, indices, commodities and stocks. The Manipulation Ribbon's algorithmic foundation ensures consistent performance across a variety of instruments. The lack of complex settings makes it easy for the trader to set up and go.
Educational Resources and Support
Users of the Manipulation Ribbon benefit from comprehensive educational resources and full access to FxScripts Support. This ensures traders can maximize the potential of the Manipulation Ribbon and other tools in the Sigma Indicator Suite by learning best practices and gaining insights from an experienced team of traders.

Swing High/Low Levels (Auto Remove)Plots untapped swing high and low levels from higher timeframes. Used for liquidity sweep strategy. Cluster of swing levels are a magnet for price to return to and reverse. Indicator gives option for candle body or wick for sweep to remove lines.

Swing High/Low Levels (Auto Remove)Plots untapped swing high and low levels from higher timeframes. Used for liquidity sweep strategy. Cluster of swing levels are a magnet for price to return to and reverse. Indicator gives option for candle body or wick for sweep.

B A N K $ - Breaks & SweepsThis indicator automatically maps on Breaks of Structure & Liquidity Sweeps. It works by calculating pivot points based on how many candles are above/below either side of a pivot.
The user can manually set how many candles need to be above/below either side of a pivot if they would prefer to change it.
The indicator will dynamically adjust the lines as the user changes timeframe to allow for seamless analysis.
Features
Break of Structure lines
Liquidity Sweep lines
Dealing Range - this allows the user to visualise the current dealing range
Explanation
A sweep is determined by whether a candle closes through a pivot point with a body closure or not. If the candle wicks this level but fails to close through it, the line will turn red to indicate a liquidity sweep.
If the following 3 candles go on to close through the break line, this will then update it from a red sweep line to the normal break line again. (sometimes the initial candle that touches a level will not close through it but price will continue to break that level in the next few candles).

cd_SMT_Sweep_CISD_CxGeneral
This indicator is designed to show trading opportunities after sweeps of higher timeframe (HTF) highs/lows and, if available, Smart Money Technique (SMT) divergence with a correlated asset, followed by confirmation from a lower timeframe change in state delivery (CISD).
Users can track SMT, Sweep, and CISD levels across nine different timeframes.
________________________________________
Usage and Details
Commonly correlated timeframes are available in the menu by default. Users can also enter other compatible timeframes manually if necessary.
The indicator output is presented as:
• A summary table
• Display on HTF candles
• CISD levels shown as lines
Users can disable any of these from the menu.
Presentations of selected timeframes are displayed only if they are greater than or equal to the active chart timeframe.
From the Show/Hide section, you can control the display of:
• SMT table
• Sweep table
• HTF candles
• CISD levels
• HTF boxes aligned with the active timeframe
________________________________________
SMT Analysis
To receive analysis, users must enter correlated assets in the menu (or adjust them as needed).
If asset X is paired with correlated asset Y, then a separate entry for Y correlated with X is not required.
Four correlation pairs are included by default. Users should check them according to their broker/exchange or define new ones.
Checkboxes at the beginning of each row allow activation/deactivation of pairs.
SMT analysis is performed on the last three candles of each selected HTF.
If one asset makes a new high while the correlated one does not (or one makes a new low while the other does not), this is considered SMT and will be displayed both in the table and on the chart.
Charts without defined correlated assets will not display an SMT table.
________________________________________
Sweep Analysis
For the selected timeframes, the current candle is compared with the previous one.
If price violates the previous level and then pulls back behind it, this is considered a sweep. It is displayed in both the table and on the chart.
Within correlated pairs, the analysis is done separately and shown only in the table.
Example with correlated and non-correlated pairs:
• In the table, X = false, ✓ = true.
• The Sweep Table has two columns for Bullish and Bearish results.
• For correlated pairs, both values appear side by side.
• For undefined pairs, only the active asset is shown.
Example 1: EURUSD and GBPUSD pair
• If both sweep → ✓ ✓
• If one sweeps, the other does not → ✓ X
• If neither sweeps → X X
Example 2: AUDUSD with no correlated pair defined
• If sweep → ✓
• If no sweep → X
________________________________________
HTF Candles
For every HTF enabled by the user, the last three candles (including the current one) are shown on the chart.
SMT and sweep signals are marked where applicable.
________________________________________
CISD Levels
For the selected timeframes, bullish and bearish CISD levels are plotted on the chart.
________________________________________
HTF Boxes
HTF boxes aligned with the active timeframe are displayed on the chart.
Box border colors change according to whether the active HTF candle is bullish or bearish.
________________________________________
How to Read the Chart?
Let’s break down the example below:
• Active asset: Nasdaq
• Correlated asset: US500 (defined in the menu, confirmed in the table bottom row)
• Active timeframe: H1 → therefore, the HTF box is shown for Daily
• Since a correlated pair is defined, the indicator runs both SMT and Sweep analysis for the selected timeframes. Without correlation, only Sweep analysis would be shown.
Table is prepared for H1 and higher timeframes (as per user selection and active TF).
Observations:
• SMT side → H1 timeframe shows a bearish warning
• Sweep side → Bearish column shows X and ✓
o X → no sweep on Nasdaq
o ✓ → sweep on US500
Meaning: US500 made a new high (+ sweep) while Nasdaq did not → SMT formed.
The last column of the table shows the compatible LTF for confirmation.
For H1, it suggests checking the 5m timeframe.
On the chart:
• CISD levels for selected timeframes are drawn
• SMT line is marked on H1 candles
• Next step: move to 5m chart for CISD confirmation before trading (with other confluences).
Similarly, the Daily row in the table shows a Bullish Sweep on US500.
________________________________________
Alerts
Two alert options are available:
1. Activate Alert (SMT + Sweep):
Triggers if both SMT and Sweep occur in the selected timeframes. (Classic option)
2. Activate Alert (Sweep + Sweep):
Triggers if sweeps occur in both assets of a correlated pair at the same timeframe.
Interpretation:
If SMT + Sweep are already present on higher timeframes, and simultaneous sweeps appear on lower timeframes, this may indicate a strong directional move.
Of course, this must be validated with CISD and other confluences.
________________________________________
HTF CISD Levels
Although CISD levels act as confirmation levels in their own timeframe, observing how price reacts to HTF CISD levels can provide valuable insights for intraday analysis.
POIs overlapping with these levels may be higher priority.
________________________________________
What’s Next in Future Versions?
• Completed CISD confirmations
• Additional alert options
• Plus your feedback and suggestions
________________________________________
Final Note
I’ll be happy to hear your opinions and feedback.
Happy trading!
Liquidity Swing Points [BackQuant]Liquidity Swing Points
This tool marks recent swing highs and swing lows and turns them into persistent horizontal “liquidity” levels. These are places where resting orders often accumulate, such as stop losses above prior highs and below prior lows. The script detects confirmed pivots, records their prices, draws lines and labels, and manages their lifecycle on the chart so you can monitor potential sweep or breakout zones without manual redrawing.
What it plots
LQ-H at confirmed swing highs
LQ-L at confirmed swing lows
Horizontal levels that can optionally extend into the future
Timed removal of old levels to keep the chart clean
Each level stores its price, the bar where it was created, its type (high or low), plus a label and a line reference for efficient updates.
How it works
Pivot detection
A swing high is confirmed when the highest high has swing_length bars on both sides that are lower.
A swing low is confirmed when the lowest low has swing_length bars on both sides that are higher.
Pivots are only marked after they are confirmed, so they do not repaint.
Level creation
When a pivot confirms, the script records the price and the creation bar (offset by the right lookback).
A new line is plotted at that price, labeled LQ-H or LQ-L.
Rendering and extension
Levels can be drawn to the most recent bar only or extended to the right for forward reference.
Label size and line color/transparency are configurable.
Lifecycle management
On each confirmed bar, the script checks level age.
Levels older than a chosen bar count are removed automatically to reduce clutter.
How it can be used
Liquidity sweeps: Watch for price to probe beyond a level then close back inside. That behavior often signals a potential fade back into the prior range.
Breakout validation: If price pushes through a level and holds on closes, traders may treat that as continuation. Retests of the level from the other side can serve as structure checks.
Context for entries and exits: Use nearby LQ-H or LQ-L as reference for stop placement or partial-take zones, especially when other tools agree.
Multi-timeframe mapping: Plot swing points on higher timeframes, then drill down to time entries on lower timeframes as price interacts with those levels.
Why liquidity levels matter
Prior swing points are focal areas where many strategies set stops or pending orders. Price often revisits these zones, either to “sweep” resting liquidity before reversing, or to absorb it and trend. Marking these areas objectively helps frame scenarios like failed breaks, successful breakouts, and retests, and it reduces the subjectivity of eyeballing structure.
Settings to know
Swing Detection Length (swing_length), Controls sensitivity. Lower values find more local swings. Higher values find more significant ones.
Bars until removal (removeafter), Deletes levels after a fixed number of bars to prevent buildup.
Extend Levels Right (extend_levels), Keeps levels projected into the future for easier planning.
Label Size (label_size), Choose tiny to large for chart readability.
One color input controls both high and low levels with transparency for context.
Strengths
Objective marking of recent structure without hand drawing
No repaint after confirmation since pivots are locked once the right lookback completes
Lightweight and fast with simple lifecycle management
Clear visuals that integrate well with any price-action workflow
Practical tips
For scalping: use smaller swing_length to capture more granular liquidity. Keep removeafter short to avoid clutter.
For swing trading: increase swing_length so only more meaningful levels remain. Consider extending levels to the right for planning.
Combine with time-of-day filters, ATR for stop sizing, or a separate trend filter to bias trades taken at the levels.
Keep screenshots focused: one image showing a sweep and reversal, another showing a clean breakout and retest.
Limitations and notes
Levels appear after confirmation, so they are delayed by swing_length bars. This is by design to avoid repainting.
On very noisy or illiquid symbols, you may see many nearby levels. Increasing swing_length and shortening removeafter helps.
The script does not assess volume or session context. Consider pairing with volume or session tools if that is part of your process.

Sweep2Trade Pro [CHE]Sweep2Trade Pro \ — Liquidity Sweep → Trend → Confirmation
Sweep2Trade Pro \ helps you catch high-probability reversals or continuations that start with a liquidity sweep, align with the T3 trend, and finalize with a structure confirmation (BOS). It’s designed to reduce noise, time your entries, and keep you out of weak, chop-driven signals.
What’s a “sweep”?
A liquidity sweep happens when price briefly breaks a prior swing high/low (where many stops sit), triggers those stops, and then snaps back. This “stop-hunt” creates liquidity for bigger players and often precedes a sharp move in the opposite direction if the break fails, or fuels continuation if structure actually shifts.
What’s a BOS (Break of Structure)?
A BOS is a price action event where the market takes out a recent swing level in the trend’s direction, signaling continuation and confirming that structure has shifted (bullish BOS through a recent swing high, bearish BOS through a recent swing low).
How the indicator works (at a glance)
1. Regime Filter (T3 + R²)
T3 Moving Average: A smoother, faster-responding moving average that aims to reduce lag while filtering noise, so trend direction changes are clearer.
R² (Coefficient of Determination): Measures how “linear” the recent price path is (0→1). Higher values = stronger, cleaner trend; lower values = more chop. Used here to allow trades only when trend quality exceeds a user-set threshold.
2. Sweep Detection
Bullish sweep: price pokes below a prior swing low and closes back above it.
Bearish sweep: price pokes above a prior swing high and closes back below it.
Lookback length is configurable.
3. Sequence Lock (built-in FSM)
The script manages state in phases so you don’t jump the gun:
Phase 1: Sweep detected → wait for T3 to turn in the corresponding direction.
Phase 2: T3 direction confirmed → show “SWEEP OK” and wait for final confirmation.
Trade Signal: Only fires if confirmation arrives before a timeout.
4. Confirmation Layer
BOS via wick or close (you choose),
Strong close toward the signal (top/bottom quartile of the candle),
Optional “close above/below T3” condition.
These checks help avoid weak sweeps that immediately fade.
5. Alerts & Visuals
“SWEEP OK” markers show when the sweep + T3 direction align.
Final BUY/SELL arrows appear only when the confirmation layer passes.
Ready-made alert conditions for automation.
What you can do with it
Time reversals after sweeps: Enter when a stop-hunt fades and structure confirms.
Ride continuations: Use BOS with the T3 trend to pyramid or re-enter with structure on your side.
Filter chop: Let R² gate entries to periods with cleaner directional drift.
Automate: Use the included alerts with your platform or webhook setup.
Inputs (key settings)
Regime Filter
T3 Length / Volume Factor: Controls smoothness and responsiveness. Smaller length → faster, more sensitive; higher volume factor → smoother curve.
R² Lookback & Threshold: Length of the linear fit window and the minimum “trend quality” required. Higher thresholds mean fewer, cleaner signals.
Sweep / Sequence
Swing Lookback: How far back to define the “reference” high/low for sweeps.
Timeout: Maximum bars allowed between phases to keep signals fresh.
Restart timeout on Phase 2: Optional safety so entries don’t go stale.
Confirmation
BOS Lookback: Micro-pivot window for structure breaks.
Wick vs Close BOS: Conservative traders may prefer close.
Require close above/below T3: Tightens confirmation with trend alignment.
Practical guide (quick start)
1. Timeframe & markets: Works across majors, indices, and crypto. Start with 5m–1h intraday or 1h–4h swing; adjust R² threshold upward on noisier pairs.
2. Entry recipe (Long):
Bullish sweep of a prior low → T3 turns up → BOS/strong close.
Optional: enable “close above T3” for extra confirmation.
3. Entry recipe (Short): Mirror the above.
4. Stops: Common choices are just beyond the sweep wick (tighter) or past the BOS invalidation (safer).
5. Targets: Previous structural levels, measured move, or a T3 trail (exit when price closes back through T3).
6. Avoid low-quality contexts: If R² is very low, market is likely ranging erratically—skip or widen filters.
Tips & best practices
Context first: The same sweep means different things in a strong trend vs. flat regime; that’s why the T3+R² filter exists.
BOS choice: Wick-based BOS is earlier but noisier; close-based BOS is slower but cleaner. Tune per market.
Backtest -> Forward test: Validate settings per symbol/timeframe; then paper trade before going live.
Risk: Fixed fractional risk with asymmetric R\:R (e.g., 1:1.5–1:3) generally performs better than “all-in” discretionary sizing.
Behind the scenes (for the curious)
T3 is a multi-stage EMA construction that produces a smooth curve with reduced lag versus simple/standard EMAs.
R² is the square of correlation (0–1). Here it’s used as a moving gauge of how well price aligns to a linear path—our “trend quality” dial.
Stop-hunts / sweeps are a recognized microstructure phenomenon where clustered stops provide the liquidity that fuels the next move.
Disclaimer
No indicator guarantees profits. Sweep2Trade Pro \ is a decision aid; always combine with solid risk management and your own judgment. Backtest, forward test, and size responsibly.
The content provided, including all code and materials, is strictly for educational and informational purposes only. It is not intended as, and should not be interpreted as, financial advice, a recommendation to buy or sell any financial instrument, or an offer of any financial product or service. All strategies, tools, and examples discussed are provided for illustrative purposes to demonstrate coding techniques and the functionality of Pine Script within a trading context.
Any results from strategies or tools provided are hypothetical, and past performance is not indicative of future results. Trading and investing involve high risk, including the potential loss of principal, and may not be suitable for all individuals. Before making any trading decisions, please consult with a qualified financial professional to understand the risks involved.
By using this script, you acknowledge and agree that any trading decisions are made solely at your discretion and risk.
Enhance your trading precision and confidence 🚀
Happy trading
Chervolino

Liquidity Sweep Scanner [TradingFinder]🔵 Introduction
Recognizing how liquidity develops and how price reacts at key structural levels is critical for spotting precise, low-risk trade entries. The Liquidity Sweep Scanner is an advanced tool built to track market activity in real time, pinpoint liquidity sweeps, define reaction zones, and identify confirmation candles across multiple instruments and timeframes.
Key Advantages :
Detects high-probability reversal points with precision.
Combines liquidity analysis, market structure, and candle confirmation.
Works seamlessly across multiple symbols and timeframes.
This screener can scan a broad watchlist or analyze every timeframe of a single asset to find optimal reversal zones. It starts by identifying a clear swing point either a swing high or swing low and marking a reaction zone between that point and the candle’s highest or lowest open/close value.
If price revisits the zone, performs a liquidity grab, and forms an indecision candle such as a doji or narrow-bodied bar that closes inside the zone, this may indicate rejection of the level and a failed breakout attempt. Based on the surrounding market context, the screener then flags a potential bullish or bearish reversal and generates the appropriate Long or Short signal.
By focusing on precise entry timing, institutional order flow alignment, and filtering out false breakouts, the Liquidity Sweep Scanner zeroes in on the market areas where liquidity engineering, reversal potential, and inefficiency overlap. This makes it an indispensable tool for price action traders who rely on clear, high-quality setups without the distraction of market noise.
🔵 How to Use
The Liquidity Sweep Scanner continuously evaluates market structure, issuing alerts when a potential reversal setup emerges. It merges liquidity behavior, swing point analysis, and candle confirmation within predefined reaction zones.
To illustrate, imagine price forms a swing high or low, then later returns to that level. If it sweeps the prior extreme and produces a qualifying candle inside the reaction zone, the tool signals a possible reversal.
🟣 Long Setup
For a bullish scenario, the screener first spots a valid swing low a level often packed with sell-side liquidity. From there, it defines a reaction zone stretching from the swing low to the candle’s lowest open/close point.
If price retests this area with a wick dipping below the swing low but then closes back inside the zone, it signals absorption of selling pressure and rejection of further downside. The screener then awaits a confirmation candle commonly a doji or small-bodied bar closing inside the zone. Once these conditions align, a Long signal is logged and, if alerts are active, the trader receives a notification.
🟣 Short Setup
For bearish opportunities, the process begins by locating a valid swing high typically an area dense with buy-side liquidity. The reaction zone is drawn from the swing high to the candle’s highest open/close value.
When price retests this zone, sweeps above the swing high, and fails to close higher, it suggests a bull trap and waning upward momentum. The screener then requires a confirmation candle often a doji or rejection bar that closes back within the zone before confirming a Short signal.
These bearish setups help traders pinpoint likely institutional sell zones, offering a clear view of where price may reverse following a liquidity event.
🔵 Settings
🟣 Logical settings
Liquidity Swing period : You can set the swing detection period.
Market Structure Period :You can set the Pivot Period to determine the detection direction.
Max Swing Back Method : It is in two modes "All" and "Custom". If it is in "All" mode, it will check all swings, and if it is in "Custom" mode, it will check the swings to the extent you determine.
Max Swing Back : You can set the number of swings that will go back for checking.
Maximum Distance Between Swing and Signal : The maximum number of candles allowed between the swing point and the potential signal. The default value is 50, ensuring that only recent and relevant price reactions are considered valid.
🟣 Display Settings
Table on Chart : Allows users to choose the position of the signal dashboard either directly on the chart or below it, depending on their layout preference.
Number of Symbols : Enables users to control how many symbols are displayed in the screener table, from 10 to 20, adjustable in increments of 2 symbols for flexible screening depth.
Table Mode : This setting offers two layout styles for the signal table :
Basic : Mode displays symbols in a single column, using more vertical space.
Extended : Mode arranges symbols in pairs side-by-side, optimizing screen space with a more compact view.
Table Size : Lets you adjust the table’s visual size with options such as: auto, tiny, small, normal, large, huge.
Table Position : Sets the screen location of the table. Choose from 9 possible positions, combining vertical (top, middle, bottom) and horizontal (left, center, right) alignments.
🟣 Symbol Settings
Each of the 10 symbol slots comes with a full set of customizable parameters :
Symbol : Define or select the asset (e.g., XAUUSD, BTCUSD, EURUSD, etc.).
Timeframe : Set your desired timeframe for each symbol (e.g., 15, 60, 240, 1D).
🟣 Alert Settings
Alert : Enables alerts for LSS.
Message Frequency : Determines the frequency of alerts. Options include 'All' (every function call), 'Once Per Bar' (first call within the bar), and 'Once Per Bar Close' (final script execution of the real-time bar). Default is 'Once per Bar'.
Show Alert Time by Time Zone : Configures the time zone for alert messages. Default is 'UTC'.
🔵 Conclusion
The Liquidity Sweep Scanner equips traders with a precise, structured method for spotting high-probability reversals by merging liquidity sweeps, reaction zone mapping, and candle confirmation.
It not only filters out market noise but also highlights price areas where inefficiency and reversal potential align. Beyond identifying clean entry points, the tool includes a market direction detection feature allowing traders to quickly determine the prevailing trend and align their trades accordingly.
With adjustable settings such as the Pivot Period for fine-tuning detection direction, it adapts to various trading styles and timeframes, making it a powerful and versatile addition to any trader’s strategy.
유료 스크립트
