MTF Order Flow DashboardThe MTF Order Flow Dashboard is a compact, real-time table overlay that provides an at-a-glance view of market structure across three key timeframes:
✅ 1-Minute
✅ 5-Minute
✅ 1-Hour
//If extra 1 min is added to candle closure countdown wait till next tick for correction//
This tool is designed to help traders quickly assess directional bias, detect structure shifts, and stay aware of upcoming candle closes — a powerful aid for scalping, day trading, or momentum-based strategies.
Pivot-Based Market Structure Detection
Uses user-defined pivot length to determine if the market is showing a Bullish, Bearish, or Neutral structure on each timeframe.
Color-Coded Structure
Easily visualize the current trend per timeframe:
🟢 Bullish | 🔴 Bearish | ⚪ Neutral
Live Candle Countdown Timers
Displays time remaining until the next candle close for each timeframe, using timenow for near real-time updates (as fast as ticks arrive).
Compact Table Display
Non-intrusive table displayed in the top-right of your chart with clean formatting for fast decision-making.
Built-in Alerts
Optional alerts when all timeframes align bullish or bearish, giving potential trade setup signals.
Inputs:
Select timeframes for structure analysis (1m, 5m, 1h)
Adjust pivot sensitivity with the Pivot Length input
표준 편차

Volatility Strategy 01a quantitative volatility strategy (especially effective in trend direction on the 15min chart on the s&p-index)
the strategy is a rule-based setup, which dynamically adapts to the implied volatility structure (vx1!–vx2!)
context-dependent mean reversion strategy based on multiple timeframes in the vix index
a signal is provided under following conditions:
1. the vvix/vix spread has deviated significantly beyond one standard deviation
2. the vix is positioned above or below 3 moving averages on 3 minor timeframes
3. the trade direction is derived from the projected volatility regime, measured via vx1! and vx2! (cboe)

Volatility Zones (STDEV %)This indicator displays the relative volatility of an asset as a percentage, based on the standard deviation of price over a custom length.
🔍 Key features:
• Uses standard deviation (%) to reflect recent price volatility
• Classifies volatility into three zones:
Low volatility (≤2%) — highlighted in blue
Medium volatility (2–4%) — highlighted in orange
High volatility (>4%) — highlighted in red
• Supports visual background shading and colored line output
• Works on any timeframe and asset
📊 This tool is useful for identifying low-risk entry zones, periods of expansion or contraction in price behavior, and dynamic market regime changes.
You can adjust the STDEV length to suit your strategy or timeframe. Best used in combination with your entry logic or trend filters.

Adaptive Multi-MA OptimizerAdaptive Multi-MA Optimizer
This indicator provides a powerful, customizable solution for traders seeking dynamically optimized moving averages with precision and control. It integrates multiple custom-built moving average types, applies real-time volatility-based optimization, and includes an optional composite smoothing engine.
🧠 Key Features
Dynamic Optimization:
Automatically selects the optimal lookback length based on market volatility stability using a custom standard deviation differential model.
Multiple Custom MA Types:
Includes fully custom implementations of:
SMA (Simple Moving Average)
EMA (Exponential Moving Average)
WMA (Weighted Moving Average)
VWMA (Volume Weighted MA)
DEMA (Double EMA)
TEMA (Triple EMA)
Hull MA
ALMA (Arnaud Legoux MA)
Composite MA Option:
A unique "Composite" mode blends all supported MAs into a single average, then applies optional smoothing for enhanced signal clarity.
Dynamic Smoothing:
The composite mode supports volatility-adjusted smoothing (based on optimized lookback), making it adaptable to different market regimes.
Fully Custom Logic:
No built-in MA functions are used — every moving average is hand-coded for transparency and educational value.
⚙️ How It Works
Optimization:
The script evaluates a range of lengths (minLen to maxLen) using the standard deviation of price returns. It selects the length with the most stable recent volatility profile.
Calculation:
The selected MA type is calculated using that optimized length. If "Composite" is chosen, all MA types are averaged and smoothed dynamically.
Visualization:
The adaptive MA is plotted on the chart, changing color based on its position relative to price.
📌 Use Cases
Trend-following strategies that adapt to different market conditions.
Traders wanting a high-fidelity composite of multiple MAs.
Analysts interested in visualizing market smoothness without lag-heavy signals.
Coders looking to learn how to build custom indicators from scratch.
🧪 Inputs
MA Type: Choose from 8 MA types or a blended Composite.
Lookback Range: Control min/max and step size for optimization.
Source: Choose any price series (e.g., close, hl2).
⚠️ Disclaimer
This indicator is for educational and informational purposes only and does not constitute financial advice, trading advice, or investment recommendations. Use of this script is at your own risk. Past performance does not guarantee future results. Always perform your own analysis and consult with a qualified financial advisor before making trading decisions.

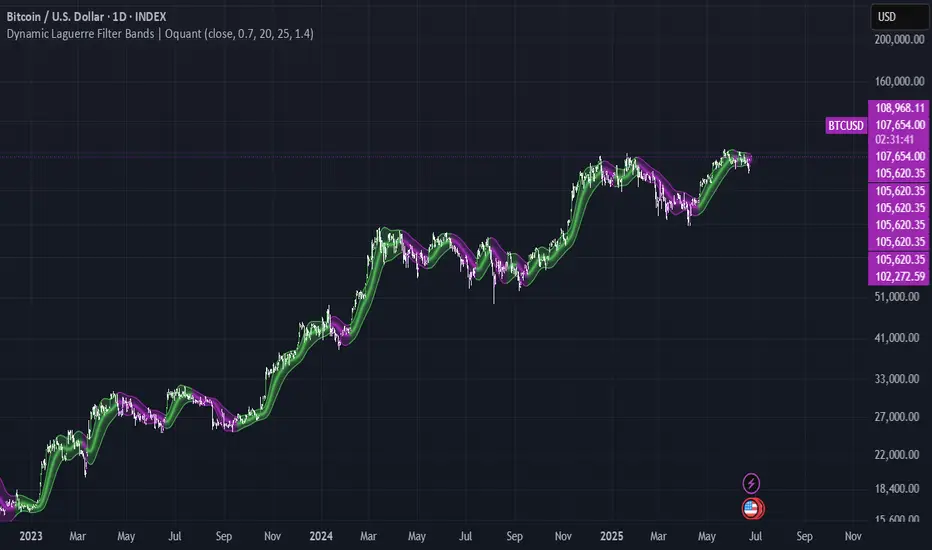
Dynamic Laguerre Filter Bands | OttoThis indicator combines trend-following and volatility analysis by enhancing the traditional Laguerre filter with a dynamic, volatility-adjusted band system. Instead of using fixed thresholds, the bands adapt in real-time to changing market conditions by applying smoothed standard deviation calculations. This design keeps the indicator responsive to significant price movements while effectively filtering out short-term market noise, resulting in more accurate trend identification and breakout signals.
Core Concept
The indicator is built around the following key components:
Laguerre Filter:
The Laguerre filter is designed to smooth out price data by reducing market noise while still being quick enough to detect real changes in price direction. Its goal is to create a clear, smooth trend line that helps traders/investors focus on the overall market trend without getting distracted by small, random price swings.
It uses a parameter called gamma to control how it balances smoothness and responsiveness:
A lower gamma gives more weight to recent price data, making the filter react faster to new price changes. This means the trend line is more sensitive but may also be less smooth and more prone to small fluctuations.
A higher gamma gives more weight to past price data, making the filter smoother and less sensitive to quick changes. This helps reduce noise and produces a steadier trend line, but it also introduces more lag, meaning the filter reacts slower to new price moves.
By adjusting gamma, the Laguerre filter lets you choose the balance between following price changes quickly and having a stable, noise-free trend signal.
Standard Deviation:
shows how much price varies from the mean. In this indicator, it’s used to measure market volatility.
Volatility Bands: The upper and lower bands are based on an EMA-smoothed standard deviation of price. The EMA reduces sudden jumps in volatility, creating smoother and more stable bands that still respond to changing market conditions. These bands are plotted around the Laguerre filter line, expanding and contracting in a controlled way to stay aligned with real market movement while avoiding short-term noise.
Signal Logic:
A long signal is triggered when the close price crosses above the upper band.
A short signal occurs when the close price falls below the lower band.
⚙️ Inputs
Source: Price source used in calculations
Gamma: Adjusts how much the Laguerre filter responds to price changes. Lower gamma values make the filter react more to recent prices, while higher values give more influence to older data, making the line smoother but slower to respond.
Volatility Length: Period used to calculate standard deviation
Volatility Smoothing Length: EMA smoothing length for standard deviation
Multiplier: Scales the width of the bands based on volatility
📈 Visual Output
Laguerre Filter Line: Plots the laguerre filter line, colored dynamically based on signal direction (green for bullish, purple for bearish)
Upper & Lower Bands: Volatility-based bands that adjust with market conditions. (green for bullish, purple for bearish)
Glow Effect: Optional glow layer to enhance visibility of the laguerre filter trend line (green for bullish, purple for bearish)
Bar Coloring: Candlesticks and bar colors reflect the active signal state for fast visual interpretation (green for bullish, purple for bearish)
How to Use
Apply the indicator to your chart and monitor for signal events:
Long Signal: When price closes above the upper band
Short Signal: When price closes below the lower band
🔔 Alerts
This indicator supports optional alert conditions you can enable for:
Long Signal: Close price crossing above the upper band
Short Signal: Close price crossing below the lower band
⚠️ Disclaimer:
This indicator is intended for educational and informational purposes only. Trading/investing involves risk, and past performance does not guarantee future results. Always test and evaluate indicators/strategies before applying them in live markets. Use at your own risk.
Adaptive Normalized Global Liquidity OscillatorAdaptive Normalized Global Liquidity Oscillator
A dynamic, non-repainting oscillator built on real central bank balance sheet data. This tool visualizes global liquidity shifts by aggregating monetary asset flows from the world’s most influential central banks.
🔍 What This Script Does:
Aggregates Global Liquidity:
Includes Federal Reserve (FED) assets and subtracts liabilities like the Treasury General Account (TGA) and Reverse Repo Facility (RRP), combined with asset positions from the ECB, BOJ, PBC, BOE, and over 10 other central banks. All data is normalized into USD using FX rates.
Adaptive Normalization:
Optimizes the lookback period dynamically based on rate-of-change stability—no fixed lengths, enabling adaptation across macro conditions.
Self-Optimizing Weighting:
Applies inverse standard deviation to balance raw liquidity, smoothed momentum (HMA), and standardized deviation from the mean.
Percentile-Ranked Highlights:
Liquidity readings are ranked relative to history—extremes are visually emphasized using gradient color and adaptive transparency.
Non-Repainting Design:
Data is anchored with bar index awareness and offset techniques, ensuring no forward-looking bias. What you see is what was known at that time.
⚠️ Important Interpretation Note:
This is not a zero-centered oscillator like RSI or MACD. The signal line does not represent neutrality at zero.
Instead, a dynamic baseline is calculated using a rolling mean of scaled liquidity.
0 is irrelevant on its own—true directional signals come from crosses above or below this adaptive baseline.
Even negative values may signal strength if they are rising above the moving average of past liquidity conditions.
✅ What to Watch For:
Crossover Above Dynamic Baseline:
Indicates liquidity is expanding relative to recent conditions—supports a risk-on interpretation.
Crossover Below Dynamic Baseline:
Suggests deteriorating liquidity conditions—may align with risk-off shifts.
Percentile Extremes:
Readings near the top or bottom historical percentiles can act as contrarian or confirmation signals, depending on momentum.
⚙️ How It Works:
Bounded Normalization:
The final oscillator is passed through a tanh function, keeping values within and reducing distortion.
Adaptive Transparency:
The strength of deviations dynamically adjusts plot intensity—visually highlighting stronger liquidity shifts.
Fully Customizable:
Toggle which banks are included, adjust dynamic optimization ranges, and control visual display options for plot and background layers.
🧠 How to Use:
Trend Confirmation:
Sustained rises in the oscillator above baseline suggest underlying monetary support for asset prices.
Macro Turning Points:
Reversals or divergences, especially near OB/OS zones, can foreshadow broader risk regime changes.
Visual Context:
Use the dynamic baseline to see if liquidity is supportive or suppressive relative to its own adaptive history.
📌 Disclaimer:
This indicator is for educational and informational purposes only. It does not constitute financial advice. Past performance is not indicative of future results. Always consult a qualified financial advisor before making trading or investment decisions.

Adaptive RSI Oscillator📌 Adaptive RSI Oscillator
This indicator transforms the classic RSI into a fully adaptive, self-optimizing oscillator — normalized between -1 and 1, dynamically smoothed, and enhanced with divergence detection.
🔧 Key Features
Self-Optimizing RSI: Automatically selects the optimal RSI lookback length based on return stability (no hardcoded periods).
Dynamic Smoothing: Adapts to market conditions using a fraction of the optimized length.
Normalized Output : Converts traditional RSI to a consistent scale across all assets and timeframes.
Divergence Detection: Compares RSI behavior vs. price percentile ranks and scales the signal accordingly.
Gradient Visualization: Color-coded background and plot lines reflect the strength and direction of the signal with soft transitions.
Neutral Zone Adaptation: Dynamically widens or narrows the zone of inaction based on volatility, reducing noise.
🎯 Use Cases
Identify extreme momentum zones without relying on fixed 70/30 RSI levels
Detect divergences early with adaptive filtering
Highlight potential exhaustion or continuation
⚠️ Disclaimer: This indicator is for informational and educational purposes only. It does not constitute financial advice or a recommendation to buy or sell any security. Always conduct your own research and consult a licensed financial advisor before making investment decisions. Use at your own risk.

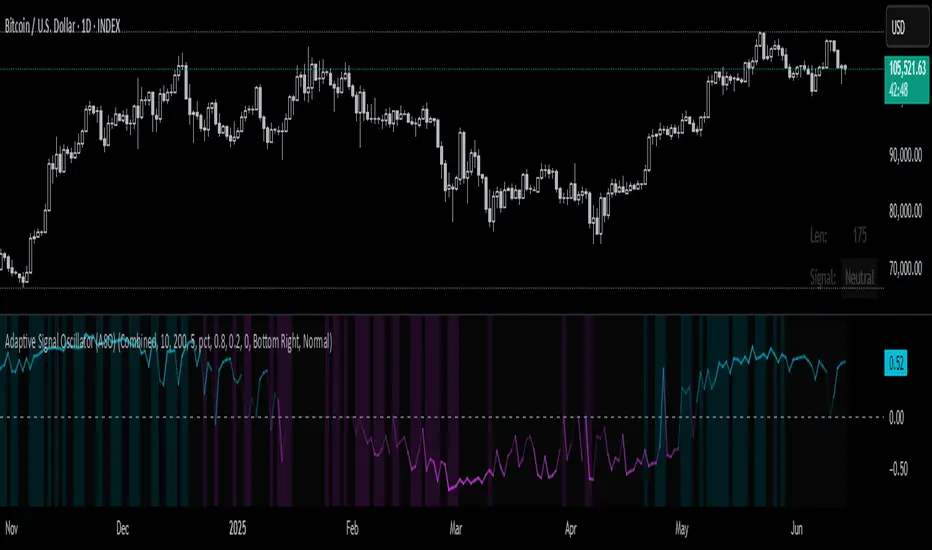
Adaptive Signal Oscillator (ASO)📘 Adaptive Signal Oscillator (ASO)
A fully dynamic, self-calibrating oscillator that adapts to any asset or timeframe by optimizing for real-time signal stability and volatility structure — without relying on static parameters or hardcoded thresholds.
🔍 Overview
The Adaptive Signal Oscillator (ASO) is a next-generation technical analysis tool designed to provide context-aware long/short signals across crypto, equities, or forex markets. Unlike traditional oscillators (RSI, Stochastics, MACD), ASO requires no manual tuning of lookback periods or overbought/oversold zones — it self-optimizes based on current market behavior.
🧠 How It Works
✅ 1. Dynamic Lookback Optimization
ASO evaluates a range of lookback lengths between user-defined minLen and maxLen. For each length, it calculates the standard deviation of returns and finds the one with the least volatility change (i.e., the most stable structure). This length is dynamically assigned as bestLen, recalculated on every bar.
✅ 2. Multi-Layer Signal Composition
Four independent signal layers are computed using bestLen:
RSI Layer: Measures relative price strength via a custom dynamic RSI.
Z-Score Layer: Standardized deviation of price from its mean.
Volatility Layer: Standard deviation of log or percent returns.
Price Position Layer: Current price percentile within the lookback window.
Each of these layers is transformed into a percentile score scaled to the range .
✅ 3. Volatility-Based Weighting
The standard deviation (volatility) of each signal layer is computed. Less volatile layers are weighted more heavily, ensuring the final composite signal prioritizes stable, consistent inputs.
Weights are normalized and combined to form a composite score, representing a dynamically blended, noise-weighted signal across the four layers.
✅ 4. Optional Adaptive Smoothing
A boolean toggle lets users apply smoothing to the final score. The smoothing window scales proportionally to bestLen, preserving adaptiveness even during trend transitions.
✅ 5. Percentile-Based Thresholding
Rather than using arbitrary fixed thresholds, ASO converts the composite score into a ranked percentile. Long/short signals are then generated based on user-defined percentile bands, adapting naturally to each asset’s behavior.
📈 Interpreting ASO
Score > Threshold → Strong long signal (highlighted in aqua).
Score < Threshold → Strong short signal (highlighted in fuchsia).
Crossing h_thresh (e.g., 0) → Neutral-to-bias change; useful for early trend cues.
The background and label update in real time to reflect the current regime and bestLen.
⚙️ Inputs
minLen, maxLen, step: Define the search range for optimal lookback length.
retMethod: Choose between log or percent return calculations.
threshHigh, threshLow: Define signal zones using percentiles.
smooth: Enable dynamic score smoothing.
h_thresh: Midline crossover zone for directional context.
⚠️ Disclaimer
This tool is designed for exploratory and educational purposes only. It does not offer financial advice or trading recommendations. Past performance is not indicative of future results.
Always consult a licensed financial advisor before making investment decisions.
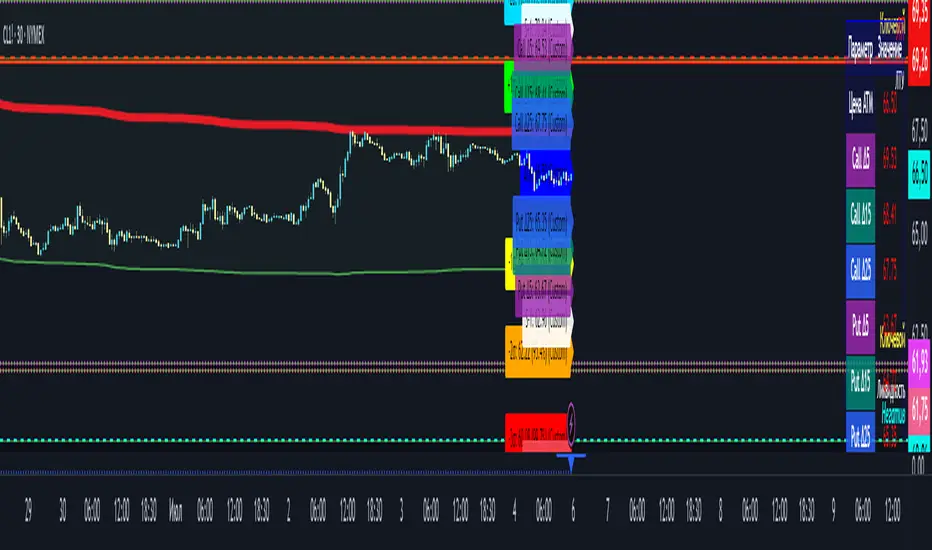
Option Range Projector PRO (with Alerts)Indicator Name: Option Range Projector PRO (with Alerts)
Short Description
This is a powerful and flexible tool for traders that visualizes expected price movement ranges based on option pricing principles and statistical deviations. The indicator plots standard deviation levels (Sigmas) and boundaries calculated from the price of an options Straddle, providing a unique insight into market volatility expectations.
It is ideal for options traders, as well as those who trade futures or spot assets and want to gain an edge by understanding where the market anticipates price boundaries on a specific date.
Core Concepts
The indicator is based on three key ideas:
Standard Deviation (Sigma, σ): In statistics, this is a measure of value dispersion. In trading, when applied to prices, standard deviation levels show the probable range within which the price is expected to remain until a specific date (expiration).
±1σ (1 Sigma): Approximately 68.2% probability that the price will stay within this range.
±2σ (2 Sigmas): Approximately 95.4% probability. These levels often act as strong support/resistance.
±3σ (3 Sigmas): Approximately 99.7% probability. Reaching these levels is a statistically rare event.
Implied Volatility (IV): This is a key component. IV is the market's forecast of the asset's future volatility. It is derived from current option prices and reflects how significant the price movements are expected to be by traders. The higher the IV, the wider the calculated ranges will be.
Straddle-Based Levels: A straddle is an options strategy involving the simultaneous purchase of a Call and a Put option with the same strike price and expiration date. The cost of this combination (Call + Put) directly reflects the market's expected price movement in points. Our indicator uses this value to construct alternative, highly accurate boundaries of the expected range.
Key Features
Flexible Expiration Choice: Easily switch between standard contracts (Weekly, Monthly, Quarterly) or set any custom number of days to expiration (DTE).
Dual Volatility Calculation Mode: Use automatic calculation based on historical data or enter a precise IV value manually (e.g., from your broker's terminal) for maximum accuracy.
Two Types of Predictive Levels: Visualize classic standard deviations (Sigmas) and/or levels calculated from the Straddle price for a comprehensive analysis.
Expiration Comparison: Enable the display of additional levels for a different expiration date to visually compare short-term and long-term market expectations.
"Greeks" Calculation: The indicator calculates and displays key option Greeks (Delta, Gamma, Theta, Vega), helping to deepen the understanding of an option position's characteristics.
Informative Table: All key data—ATM price, IV, DTE, level prices, Greeks, and option prices—are consolidated into one clear table for quick analysis.
Customizable Alerts: Get instant notifications directly in TradingView when the price crosses any of the important levels (±1σ, ±2σ, ±3σ).
Full Visual Customization: Control colors, line thickness, labels, and zone fills to adapt the indicator to your trading style.
How to Use (Settings)
Price Settings:
Auto-detect ATM Price: When enabled, the indicator will use the current closing price as the At-The-Money (ATM) price.
Manual ATM Price: If auto mode is disabled, you can set a precise ATM price manually.
Volatility Settings:
Auto-calculate IV: Calculates historical volatility over a specified period. Useful if you don't have access to real-time IV.
Manual IV Value: (Recommended for accuracy). Enter the Implied Volatility (IV) value for the desired strike from your brokerage terminal or analytical services here.
Expiration:
Contract Type: Choose one of the standard terms (Weekly, Monthly, Quarterly) or "Custom" to use a manual day input.
Days to Expiration: Active only for the "Custom" type.
Show Multiple Expirations: Enables a second set of levels with a different term for comparison.
Straddle Boundaries:
Use Manual Input: Allows you to enter the precise Call and Put Settle prices from the official exchange summary (e.g., from the CME website). This provides the most accurate boundaries based on real market prices.
Trading Ideas and Application
Mean Reversion Trading: The ±2σ and ±3σ levels often act as strong overbought/oversold zones. A price reaching these extreme values has a high statistical probability of reversing or correcting back towards the central ATM price.
Trend Confirmation and Breakouts: A confident close outside the ±1σ range can indicate the beginning of a strong directional move.
Risk Management: Use the levels to set stop-losses or determine profit targets. For example, when opening a trade near the +1σ level, you might consider a target at +2σ and place a stop-loss behind the ATM level.
Volatility Analysis: By comparing the width of the ranges for different expirations, you can assess how the market is pricing short-term versus long-term risks. A narrow range suggests low expectations, while a wide range indicates high ones.
Disclaimer: This indicator is an analysis tool and does not provide direct financial advice or trading signals. All trading decisions are your own. Use this indicator in conjunction with other analysis methods.
VWAP %BVWAP %B - Volume Weighted Average Price Percent B
The VWAP %B indicator combines the reliability of VWAP (Volume Weighted Average Price) with the analytical power of %B oscillators, similar to Bollinger Bands %B but using volume-weighted statistics.
## How It Works
This indicator calculates where the current price sits relative to VWAP-based standard deviation bands, expressed as a percentage from 0 to 1:
• **VWAP Calculation**: Uses volume-weighted average price as the center line
• **Standard Deviation Bands**: Creates upper and lower bands using standard deviation around VWAP
• **%B Formula**: %B = (Price - Lower Band) / (Upper Band - Lower Band)
## Key Levels & Interpretation
• **Above 1.0**: Price is trading above the upper VWAP band (strong bullish momentum)
• **0.8 - 1.0**: Overbought territory, potential resistance
• **0.5**: Price exactly at VWAP (equilibrium)
• **0.2 - 0.0**: Oversold territory, potential support
• **Below 0.0**: Price is trading below the lower VWAP band (strong bearish momentum)
## Trading Applications
**Trend Following**: During strong trends, breaks above 1.0 or below 0.0 often signal continuation rather than reversal.
**Mean Reversion**: In ranging markets, extreme readings (>0.8 or <0.2) may indicate potential reversal points.
**Volume Context**: Unlike traditional %B, this incorporates volume weighting, making it more reliable during high-volume periods.
## Parameters
• **Length (20)**: Period for standard deviation calculation
• **Standard Deviation Multiplier (2.0)**: Controls band width
• **Source (close)**: Price input for calculations
## Visual Features
• Reference lines at key levels (0, 0.2, 0.5, 0.8, 1.0)
• Background highlighting for extreme breaks
• Real-time values table
• Clean oscillator format below price chart
Perfect for intraday traders and swing traders who want to combine volume analysis with momentum oscillators.

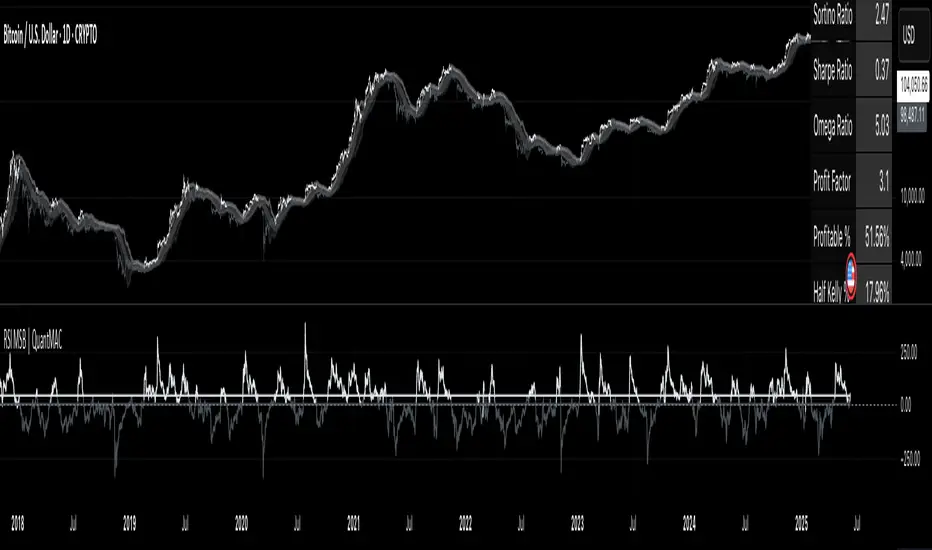
RSI MSB | QuantMAC📊 RSI MSB | QuantMAC
🎯 Overview
The RSI MSB (Momentum Shifting Bands) represents a groundbreaking fusion of traditional RSI analysis with advanced momentum dynamics and adaptive volatility bands. This sophisticated indicator combines RSI smoothing , relative momentum calculations , and dynamic standard deviation bands to create a powerful oscillator that automatically adapts to changing market conditions, providing superior signal accuracy across different trading environments.
🔧 Key Features
Hybrid RSI-Momentum Engine : Proprietary combination of smoothed RSI with relative momentum analysis
Dynamic Adaptive Bands : Self-adjusting volatility bands that respond to indicator strength
Dual Trading Modes : Flexible Long/Short or Long/Cash strategies for different risk preferences
Advanced Performance Analytics : Comprehensive metrics including Sharpe, Sortino, and Omega ratios
Smart Visual System : Dynamic color coding with 9 professional color schemes
Precision Backtesting : Date range filtering with detailed historical performance analysis
Real-time Signal Generation : Clear entry/exit signals with customizable threshold sensitivity
Position Sizing Intelligence : Half Kelly criterion for optimal risk management
📈 How The MSB Technology Work
The Momentum Shifting Bands technology is built on a revolutionary approach that combines multiple signal sources into one cohesive system:
RSI Foundation : 💪
Calculate traditional RSI using customizable length and source
Apply exponential smoothing to reduce noise and false signals
Normalize values for consistent performance across different timeframes
Momentum Analysis Engine : ⚡
Compute fast and slow momentum using rate of change calculations
Calculate relative momentum by comparing fast vs slow momentum
Normalize momentum values to 0-100 scale for consistency
Apply smoothing to create stable momentum readings
Dynamic Combination : 🔄
The genius of MSB lies in its weighted combination of RSI and momentum signals. The momentum weight parameter allows traders to adjust the balance between RSI stability and momentum responsiveness, creating a hybrid indicator that captures both trend continuation and reversal signals.
Adaptive Band System : 🎯
Calculate dynamic standard deviation multiplier based on indicator strength
Generate upper and lower bands that expand during high volatility periods
Create normalized oscillator that scales between band boundaries
Provide visual reference for overbought/oversold conditions
⚙️ Comprehensive Parameter Control
RSI Settings : 📊
RSI Length: Controls the period for RSI calculation (default: 21)
Source: Price input selection (close, open, high, low, etc.)
RSI Smoothing: Reduces noise in RSI calculations (default: 20)
Momentum Settings : 🔥
Fast Momentum Length: Short-term momentum period (default: 19)
Slow Momentum Length: Long-term momentum period (default: 21)
Momentum Weight: Balance between RSI and momentum (default: 0.6)
Oscillator Settings : ⚙️
Base Length: Foundation moving average for band calculations (default: 40)
Standard Deviation Length: Period for volatility measurement (default: 53)
SD Multiplier: Base band width adjustment (default: 0.7)
Oscillator Multiplier: Scaling factor for oscillator values (default: 100)
Signal Thresholds : 🎯
Long Threshold: Bullish signal trigger level (default: 93)
Short Threshold: Bearish signal trigger level (default: 53)
🎨 Advanced Visual System
Main Chart Elements : 📈
Dynamic Shifting Bands: Upper and lower bands with intelligent transparency
Adaptive Fill Zone: Color-coded area between bands showing current market state
Basis Line: Moving average foundation displayed as subtle reference points
Smart Bar Coloring: Candles change color based on oscillator state for instant visual feedback
Oscillator Pane : 📊
Normalized MSB Oscillator: Main signal line with dynamic coloring based on market state
Threshold Lines: Horizontal reference lines for entry/exit levels
Zero Line: Central reference for oscillator neutrality
Color State Indication: Line colors change based on bullish/bearish conditions
📊 Professional Performance Metrics
The built-in analytics suite provides institutional-grade performance measurement:
Net Profit % : Total strategy return percentage
Maximum Drawdown % : Worst peak-to-trough decline
Win Rate % : Percentage of profitable trades
Profit Factor : Ratio of gross profits to gross losses
Sharpe Ratio : Risk-adjusted return measurement
Sortino Ratio : Downside-focused risk adjustment
Omega Ratio : Probability-weighted performance ratio
Half Kelly % : Optimal position sizing recommendation
Total Trades : Complete transaction count
🎯 Strategic Trading Applications
Long/Short Mode : ⚡
Maximizes profit potential by capturing both upward and downward price movements. The MSB technology helps identify when momentum is building in either direction, allowing for optimal position switches between long and short positions.
Long/Cash Mode : 🛡️
Conservative approach ideal for retirement accounts or risk-averse traders. The indicator's adaptive nature helps identify the best times to be invested versus sitting in cash, protecting capital during adverse market conditions.
🚀 Unique Advantages
Traditional Indicators vs RSI MSB :
Static vs Dynamic: While most indicators use fixed parameters, MSB bands adapt based on indicator strength
Single Signal vs Multi-Signal: Combines RSI reliability with momentum responsiveness
Lagging vs Balanced: Optimized balance between signal speed and accuracy
Simple vs Intelligent: Advanced momentum analysis provides superior market insight
💡 Professional Setup Guide
For Day Trading (Short-term) : 📱
RSI Length: 14-18
RSI Smoothing: 12-15
Momentum Weight: 0.7-0.8
Thresholds: Long 90, Short 55
For Swing Trading (Medium-term) : 📊
RSI Length: 21-25 (default range)
RSI Smoothing: 18-22
Momentum Weight: 0.5-0.7
Thresholds: Long 93, Short 53 (defaults)
For Position Trading (Long-term) : 📈
RSI Length: 25-30
RSI Smoothing: 25-30
Momentum Weight: 0.4-0.6
Thresholds: Long 95, Short 50
🧠 Advanced Trading Techniques
MSB Divergence Analysis : 🔍
Watch for divergences between price action and MSB readings. When price makes new highs/lows but the oscillator doesn't confirm, it often signals upcoming reversals or momentum shifts.
Band Width Interpretation : 📏
Expanding Bands: Increasing volatility, expect larger price moves
Contracting Bands: Decreasing volatility, prepare for potential breakouts
Band Touches: Price touching outer bands often signals reversal opportunities
Multi-Timeframe Analysis : ⏰
Use MSB on higher timeframes for trend direction and lower timeframes for precise entry timing. The momentum component makes it particularly effective for timing entries within established trends.
⚠️ Important Risk Disclaimers
Critical Risk Factors :
Market Conditions: No indicator performs equally well in all market environments
Backtesting Limitations: Historical performance may not reflect future market behavior
Parameter Sensitivity: Different settings may produce significantly different results
Volatility Risk: Momentum-based indicators can be sensitive to extreme market conditions
Capital Risk: Always use appropriate position sizing and stop-loss protection
📚 Educational Benefits
This indicator provides exceptional learning opportunities for understanding:
Advanced RSI analysis and momentum integration techniques
Adaptive indicator design and dynamic band calculations
The relationship between momentum shifts and price movements
Professional risk management using Kelly Criterion principles
Modern oscillator interpretation and multi-signal analysis
🔍 Market Applications
The RSI MSB works effectively across various markets:
Forex : Excellent for currency pair momentum analysis
Stocks : Individual equity and index trading with momentum confirmation
Commodities : Adaptive to commodity market momentum cycles
Cryptocurrencies : Handles extreme volatility with momentum filtering
Futures : Professional derivatives trading applications
🔧 Technical Innovation
The RSI MSB represents advanced research into multi-signal technical analysis. The proprietary momentum-RSI combination has been optimized for:
Computational Efficiency : Fast calculation even on high-frequency data
Signal Clarity : Clear, actionable trading signals with reduced noise
Market Adaptability : Automatic adjustment to changing momentum conditions
Parameter Flexibility : Wide range of customization options for different trading styles
🔔 Updates and Evolution
The RSI MSB | QuantMAC continues to evolve with regular updates incorporating the latest research in momentum-based technical analysis. The comprehensive parameter set allows for extensive customization and optimization across different market conditions.
Past Performance Disclaimer : Past performance results shown by this indicator are hypothetical and not indicative of future results. Market conditions change continuously, and no trading system or methodology can guarantee profits or prevent losses. Historical backtesting may not reflect actual trading conditions including market liquidity, slippage, and fees that would affect real trading results.
Master The Markets With Multi-Signal Intelligence! 🎯📈
COV Bands ~ C H I P ACOV Bands ~ C H I P A is a custom volatility and trend identification tool designed to capture directional shifts using the Coefficient of Variation (COV), calculated from standard deviation relative to a mean price baseline.
Key features include:
A configurable SMA-based mean baseline to anchor volatility measurements clearly.
Adjustable upper and lower band multipliers to independently calibrate sensitivity and responsiveness for bullish or bearish breakouts.
Dynamic bands derived from price-relative volatility (COV), enabling adaptive identification of significant price deviations.
User-controlled standard deviation length to manage sensitivity and smoothness of volatility signals.
Direct candle coloring, providing immediate visual feedback using vibrant electric blue for bullish momentum and bright red for bearish momentum.
This indicator is particularly useful for detecting meaningful price movements, breakout signals, and potential reversals when the market moves significantly beyond its typical volatility boundaries.
Note: This indicator has not undergone formal robustness or optimization testing. Therefore, future performance in live trading environments isn't guaranteed.

RSI Shifting Band Oscillator | QuantMAC📊 RSI Shifting Band Oscillator | QuantMAC
🎯 Overview
The RSI Shifting Band Oscillator represents a breakthrough in adaptive technical analysis, combining the innovative dual-stage RSI processing with dynamic volatility bands to create an oscillator that automatically adjusts to changing market momentum conditions. This cutting-edge indicator goes beyond traditional static approaches by using smoothed RSI to dynamically shift band width based on momentum transitions, providing superior signal accuracy across different market regimes.
🔧 Key Features
Revolutionary Dual RSI Technology: Proprietary two-stage RSI calculation with exponential smoothing that measures momentum transitions in real-time
Dynamic Adaptive Bands: Self-adjusting volatility bands that expand and contract based on RSI distance from equilibrium
Dual Trading Modes: Flexible Long/Short or Long/Cash strategies for different trading preferences
Advanced Performance Analytics: Comprehensive metrics including Sharpe, Sortino, and Omega ratios
Smart Visual System: Dynamic color coding with 9 professional color schemes
Precision Backtesting: Date range filtering with detailed historical performance analysis
Real-time Signal Generation: Clear entry/exit signals with customizable threshold sensitivity
Position Sizing Intelligence: Half Kelly criterion for optimal risk management
📈 How The Dual RSI Technology Works
The Dual RSI system is the heart of this indicator's innovation. Unlike traditional RSI implementations, this approach analyzes the smoothed momentum transitions between different RSI states, providing early warning signals for momentum regime changes.
RSI Calculation Process:
Calculate traditional RSI using specified length and price source
Apply exponential moving average smoothing to reduce noise
Measure RSI distance from neutral 50 level to determine momentum strength
Use RSI deviation to dynamically adjust standard deviation multipliers
Create adaptive bands that respond to momentum conditions
Generate normalized oscillator values for clear signal interpretation
The genius of this dual RSI approach lies in its ability to detect when markets are transitioning between momentum and consolidation periods before traditional indicators catch up. This provides traders with a significant edge in timing entries and exits.
⚙️ Comprehensive Parameter Control
RSI Settings:
RSI Length: Controls the lookback period for momentum analysis (default: 14)
RSI Smoothing: Reduces noise in RSI calculations using EMA (default: 20)
Source: Price input selection (close, open, high, low, etc.)
Oscillator Settings:
Base Length: Foundation moving average for band calculations (default: 40)
Standard Deviation Length: Period for volatility measurement (default: 26)
SD Multiplier: Base band width adjustment (default: 2.7)
Oscillator Multiplier: Scaling factor for oscillator values (default: 100)
Signal Thresholds:
Long Threshold: Bullish signal trigger level (default: 90)
Short Threshold: Bearish signal trigger level (default: 56)
🎨 Advanced Visual System
Main Chart Elements:
Dynamic Shifting Bands: Upper and lower bands that automatically adjust width based on RSI momentum
Adaptive Fill Zone: Color-coded area between bands showing current market state
Basis Line: Moving average foundation displayed as subtle reference points
Smart Bar Coloring: Candles change color based on oscillator state for instant visual feedback
Oscillator Pane:
Normalized RSI Oscillator: Main signal line centered around zero with dynamic coloring
Threshold Lines: Horizontal reference lines for entry/exit levels
Zero Line: Central reference for oscillator neutrality
Color State Indication: Line colors change based on bullish/bearish conditions
📊 Professional Performance Metrics
The built-in analytics suite provides institutional-grade performance measurement:
Net Profit %: Total strategy return percentage
Maximum Drawdown %: Worst peak-to-trough decline
Win Rate %: Percentage of profitable trades
Profit Factor: Ratio of gross profits to gross losses
Sharpe Ratio: Risk-adjusted return measurement
Sortino Ratio: Downside-focused risk adjustment
Omega Ratio: Probability-weighted performance ratio
Half Kelly %: Optimal position sizing recommendation
Total Trades: Complete transaction count
🎯 Strategic Trading Applications
Long/Short Mode: ⚡
Maximizes profit potential by capturing both upward and downward price movements. The dual RSI technology helps identify when momentum is strengthening or weakening, allowing for optimal position switches between long and short.
Long/Cash Mode: 🛡️
Conservative approach ideal for retirement accounts or risk-averse traders. The indicator's adaptive nature helps identify the best times to be invested versus sitting in cash, protecting capital during adverse market conditions.
🚀 Unique Advantages
Traditional Indicators vs RSI Shifting Bands:
Static vs Dynamic: While most indicators use fixed parameters, RSI bands adapt in real-time
Lagging vs Leading: Dual RSI detects momentum transitions before they fully manifest
One-Size vs Adaptive: The same settings work across different market conditions
Simple vs Intelligent: Advanced momentum analysis provides superior market insight
💡 Professional Setup Guide
For Day Trading (Short-term):
RSI Length: 10-12
RSI Smoothing: 15-18
Base Length: 25-30
Thresholds: Long 85, Short 60
For Swing Trading (Medium-term):
RSI Length: 14-16 (default range)
RSI Smoothing: 20-25
Base Length: 40-50
Thresholds: Long 90, Short 56 (defaults)
For Position Trading (Long-term):
RSI Length: 18-21
RSI Smoothing: 25-30
Base Length: 60-80
Thresholds: Long 92, Short 50
🧠 Advanced Trading Techniques
RSI Divergence Analysis:
Watch for divergences between price action and smoothed RSI readings. When price makes new highs/lows but RSI doesn't confirm, it often signals upcoming reversals.
Band Width Interpretation:
Expanding Bands: Increasing momentum, expect larger price moves
Contracting Bands: Decreasing momentum, prepare for potential breakouts
Band Touches: Price touching outer bands often signals reversal opportunities
Multi-Timeframe Analysis:
Use RSI oscillator on higher timeframes for trend direction and lower timeframes for precise entry timing.
⚠️ Important Risk Disclaimers
Past performance is not indicative of future results. This indicator represents advanced technical analysis but should never be used as the sole basis for trading decisions.
Critical Risk Factors:
Market Conditions: No indicator performs equally well in all market environments
Backtesting Limitations: Historical performance may not reflect future market behavior
Momentum Risk: Adaptive indicators can be sensitive to extreme momentum conditions
Parameter Sensitivity: Different settings may produce significantly different results
Capital Risk: Always use appropriate position sizing and stop-loss protection
📚 Educational Benefits
This indicator provides exceptional learning opportunities for understanding:
Advanced RSI analysis and momentum measurement techniques
Adaptive indicator design and implementation
The relationship between momentum transitions and price movements
Professional risk management using Kelly Criterion principles
Modern oscillator interpretation and signal generation
🔍 Market Applications
The RSI Shifting Band Oscillator works across various markets:
Forex: Excellent for currency pair momentum analysis
Stocks: Individual equity and index trading
Commodities: Adaptive to commodity market momentum cycles
Cryptocurrencies: Handles extreme momentum variations effectively
Futures: Professional derivatives trading applications
🔧 Technical Innovation
The RSI Shifting Band Oscillator represents years of research into adaptive technical analysis. The proprietary dual RSI calculation method has been optimized for:
Computational Efficiency: Fast calculation even on high-frequency data
Noise Reduction: Advanced smoothing without excessive lag
Market Adaptability: Automatic adjustment to changing conditions
Signal Clarity: Clear, actionable trading signals
🔔 Updates and Evolution
The RSI Shifting Band Oscillator | QuantMAC continues to evolve with regular updates incorporating the latest research in adaptive technical analysis. The code is thoroughly documented for transparency and educational purposes.
Trading Notice: Financial markets involve substantial risk of loss. The RSI Shifting Band Oscillator is a sophisticated technical analysis tool designed to assist in trading decisions but cannot guarantee profitable outcomes.
---
Master The Markets With Adaptive Intelligence! 🎯📈

time-specific standard devs [keypoems]Time-Specific Net Change Percentage Standard Deviations Extensions
A candlestick is the story of how price moved during a single period: it opens, explores a high and a low, and finally closes.
The indicator asks one question:
“By what percentage did price change from open to close?”
That single percentage value – called the net-change % – is the raw material for everything that follows.
Why net-change % matters
If you collect that percentage for thousands of finished candles (daily candles, 1-hour, 4-hour – whatever you close) you get a probability distribution: most candles move only a little, a few move a lot. When you plot those percentages you get the familiar bell-curve. From any bell-curve you can read two key statistics:
Mean – the “typical” net-change.
Standard Deviation (σ) – how far a candle normally wanders from that mean.
A well-known property of a bell-curve is that ≈68 % of all observations stay between –1 σ and +1 σ, and ≈95 % stay within ±2 σ.
For traders that translates into a probabilistic map of where an unfinished candle is likely to close.
What the indicator draws
Open-anchored levels
Every box is centred on the candle’s open price.
The indicator draws boxes that mark +σ, +½ σ, –½ σ, –σ … as selected in the Inputs.
Time-specific calculation
Instead of mixing all 1-hour candles together, the script isolates only the 09:00-10:00 New-York hour (or any other slot you are at that moment) and builds a bell-curve from that subset.
The result is a set of expectations truly tailored to that exact hour’s behaviour.
Generic and Specific Std Dev Box
Indicator computes both generic levels – the classic “all candles aggregated” standard deviations, and specific levels – the refined, hour-by-hour (or 4-hour-by-4-hour, etc.) deviations.
The indicator shows Boxes that represent both aggregated values and "per period" standard deviation projection levels.
Mirrored levels (optional)
Negative σ levels are drawn automatically so you have symmetrical upside & downside projections.
Math behind the scenes
For each chosen higher-timeframe (HTF):
Collect the last N net-change % values (user-defined look-back, default 5 000 candles).
Compute:
μ = mean(net-change %)
σ = stdev(net-change %)
Project prices:
LevelPrice = Open × (1 + k × σ)
where k is 0 , ±0.5 , ±1 , ±1.5 … as enabled in the inputs.
Because everything is done in percentage space the technique adapts automatically to instruments that trade at very different absolute prices (equities, futures, crypto, FX).
How to read it in real time
When a developing candle races straight into +1 σ with plenty of time left, statistics say “68 % of the time it will finish back inside the box.”
A tag of +2 σ is an even rarer event (~5 % probability) – a natural place to look for exhaustion or take-profit cues.
Conversely, if price refuses to reverse at +1 σ and instead sticks above that edge, it is signalling an unusually strong session and may warrant trend-continuation tactics.
Key Inputs
Higher Timeframe Choose 5m to H8 reference frame
Show levels for last X periods
Look-back length Sample size for σ
StdDev Fibs Fib1 … Fib9 toggles & values: Decide which σ multiples to plot
Mirror levels Draw matching negative projections
Extend boxes Keep boxes visible beyond their candle
Best-practice usage
Combine with structure – treat σ edges as context, not automatic entry.
Mind the sample size – if you choose extremely narrow windows (e.g., Sunday 18:00-19:00 futures open) make sure your look-back still captures hundreds of cases.
Disclaimer
Trading involves risk. The author and this indicator simply display historical probability ranges; they do not assure profits or prevent losses. Always perform your own due diligence and, if necessary, consult a licensed financial professional before dealing in any financial instrument.

ATR% Multiple from MAThis indicator builds upon the original idea by jfsrevg of using the ATR% multiple from a daily 50-period moving average to highlight when a stock or instrument is extended relative to its own volatility. My version expands on this by incorporating an ADR% (Average Daily Range percentage) volatility filter, which helps refine the signals to adapt better to different instruments and timeframes.
What it does:
• Calculates the 50-period simple moving average (SMA) using daily data as the baseline trend reference.
• Measures the instrument’s Average True Range (ATR) relative to the current close (ATR%).
• Uses this ratio to identify when an instrument is significantly extended above its average volatility-based range.
• Adds a dynamic ADR% filter — computed as the average daily range divided by the daily close — to adjust the extension threshold dynamically based on recent price volatility.
• Plots small circles above price bars when extension conditions are met, signaling potential overbought conditions.
•The script works on both daily and weekly timeframes, but all volatility calculations are based on daily data to ensure consistency.
How to use:
• Traders can use this indicator to spot when a stock or instrument is significantly stretched relative to its own volatility, which may signal a good time to scale out or manage risk.
• The dynamic ADR% filter helps reduce false positives by adjusting thresholds based on market conditions.
• Use the customizable settings for ATR length, SMA length, and ADR length to fine-tune the indicator for your preferred instruments.
Original Contributions:
• Integrated an ADR% filter that refines the extension threshold based on real-time volatility.
• Added dynamic thresholds that adapt to market conditions, making the indicator more reliable across different instruments and timeframes.
• Maintained daily volatility calculations while allowing signals to appear on both daily and weekly charts.

Interpolated Median Volatility LSMA | OttoThis indicator combines trend-following and volatility analysis by enhancing traditional LSMA with percentile-based linear interpolation applied to both the Least Squares Moving Average (LSMA) and standard deviation. Rather than relying on raw values, it uses the interpolated median (50th percentile) to smooth out noise while preserving sensitivity to significant price shifts. This approach produces a cleaner trend signal that remains responsive to real market changes, adapts to evolving volatility conditions, and improves the accuracy of breakout detection.
Core Concept
The indicator builds on these core components:
LSMA (Least Squares Moving Average): A linear regression-based moving average that fits line using user selected source over user defined period. It offers a smoother and more reactive trend signal compared to standard moving averages.
Standard Deviation shows how much price varies from the mean. In this indicator, it’s used to measure market volatility.
Volatility Bands: Instead of traditional Bollinger-style bands, this script calculates custom upper and lower bands using percentile-based linear interpolation on both the LSMA and standard deviation. This method produces smoother bands that filter out noise while remaining adaptive to meaningful price movements, making them more aligned with real market behavior and helping reduce false signals.
Percentile interpolation estimates a specific percentile (like the median — the 50th percentile) from a set of values — even when that percentile doesn't fall exactly on one data point. Instead of selecting a single nearest value, it calculates a smoothed value between nearby points. In this script, it’s used to find the median of past LSMA and standard deviation values, reducing the impact of outliers and smoothing the trend and volatility signals for more robust results.
Signal Logic: A long signal is identified when close price goes above the upper band, and a short signal when close price goes below the lower band.
⚙️ Inputs
Source: The price source used in calculations
LSMA Length: Period for calculating LSMA
Standard Deviation Length: Period for calculating volatility
Percentile Length: Period used for interpolating percentile values of LSMA and standard deviation
Multiplier: Controls the width of the bands by scaling the interpolated standard deviation
📈 Visual Output
Colored LSMA Line: Changes color based on signal (green for bullish, purple for bearish)
Upper & Lower Bands: Volatility bands calculated using interpolated values (green for bullish, purple for bearish)
Bar Coloring: Price bars are colored to reflect signal state (green for bullish, purple for bearish)
Optional Candlestick Overlay: Enhances visual context by coloring candles to match the signal state (green for bullish, purple for bearish)
How to Use
Add the indicator to your chart and look for signals when close price goes above or below the bands.
Long Signal: close Price goes above the upper band
Short Signal: close Price goes below the lower band
🔔 Alerts:
This script supports alert conditions for long and short signals. You can set alerts based on band crossovers to be notified of potential entries/exits.
⚠️ Disclaimer:
This indicator is intended for educational and informational purposes only. Trading/investing involves risk, and past performance does not guarantee future results. Always test and evaluate strategies before applying them in live markets. Use at your own risk.

RTI Shifting Band Oscillator | QuantMAC📊 RTI Shifting Band Oscillator | QuantMAC - Revolutionary Adaptive Trading Indicator
🎯 Overview
The RTI Shifting Band Oscillator represents a breakthrough in adaptive technical analysis, combining the innovative Range Transition Index (RTI) with dynamic volatility bands to create an oscillator that automatically adjusts to changing market conditions. This cutting-edge indicator goes beyond traditional static approaches by using RTI to dynamically shift band width based on market volatility transitions, providing superior signal accuracy across different market regimes.
🔧 Key Features
Revolutionary RTI Technology : Proprietary Range Transition Index that measures volatility transitions in real-time
Dynamic Adaptive Bands : Self-adjusting volatility bands that expand and contract based on RTI readings
Dual Trading Modes : Flexible Long/Short or Long/Cash strategies for different trading preferences
Advanced Performance Analytics : Comprehensive metrics including Sharpe, Sortino, and Omega ratios
Smart Visual System : Dynamic color coding with 9 professional color schemes
Precision Backtesting : Date range filtering with detailed historical performance analysis
Real-time Signal Generation : Clear entry/exit signals with customizable threshold sensitivity
Position Sizing Intelligence : Half Kelly criterion for optimal risk management
📈 How The RTI Technology Works
The Range Transition Index (RTI) is the heart of this indicator's innovation. Unlike traditional volatility measures, RTI analyzes the transitions between different volatility states, providing early warning signals for market regime changes.
RTI Calculation Process:
Calculate True Range for each period using high, low, and previous close
Compute Average True Range over the RTI Length period
Sum absolute differences between consecutive True Range values
Normalize by dividing by ATR to create the raw RTI
Apply smoothing to reduce noise and create the final RTI value
Use RTI to dynamically adjust standard deviation multipliers
The genius of RTI lies in its ability to detect when markets are transitioning between calm and volatile periods before traditional indicators catch up. This provides traders with a significant edge in timing entries and exits.
⚙️ Comprehensive Parameter Control
RTI Settings:
RTI Length : Controls the lookback period for volatility analysis (default: 25)
RTI Smoothing : Reduces noise in RTI calculations (default: 12)
Base MA Length : Foundation moving average for band calculations (default: 40)
Source : Price input selection (close, open, high, low, etc.)
Oscillator Settings:
Standard Deviation Length : Period for volatility measurement (default: 27)
SD Multiplier : Base band width adjustment (default: 1.5)
Oscillator Multiplier : Scaling factor for oscillator values (default: 100)
Signal Thresholds:
Long Threshold : Bullish signal trigger level (default: 82)
Short Threshold : Bearish signal trigger level (default: 55)
🎨 Advanced Visual System
Main Chart Elements:
Dynamic Shifting Bands : Upper and lower bands that automatically adjust width based on RTI
Adaptive Fill Zone : Color-coded area between bands showing current market state
Basis Line : Moving average foundation displayed as subtle reference points
Smart Bar Coloring : Candles change color based on oscillator state for instant visual feedback
Oscillator Pane:
Normalized RTI Oscillator : Main signal line centered around zero with dynamic coloring
Threshold Lines : Horizontal reference lines for entry/exit levels
Zero Line : Central reference for oscillator neutrality
Color State Indication : Line colors change based on bullish/bearish conditions
📊 Professional Performance Metrics
The built-in analytics suite provides institutional-grade performance measurement:
Net Profit % : Total strategy return percentage
Maximum Drawdown % : Worst peak-to-trough decline
Win Rate % : Percentage of profitable trades
Profit Factor : Ratio of gross profits to gross losses
Sharpe Ratio : Risk-adjusted return measurement
Sortino Ratio : Downside-focused risk adjustment
Omega Ratio : Probability-weighted performance ratio
Half Kelly % : Optimal position sizing recommendation
Total Trades : Complete transaction count
🎯 Strategic Trading Applications
Long/Short Mode: ⚡
Maximizes profit potential by capturing both upward and downward price movements. The RTI technology helps identify when trends are strengthening or weakening, allowing for optimal position switches between long and short.
Long/Cash Mode: 🛡️
Conservative approach ideal for retirement accounts or risk-averse traders. The indicator's adaptive nature helps identify the best times to be invested versus sitting in cash, protecting capital during adverse market conditions.
🚀 Unique Advantages
Traditional Indicators vs RTI Shifting Bands:
Static vs Dynamic : While most indicators use fixed parameters, RTI bands adapt in real-time
Lagging vs Leading : RTI detects volatility transitions before they fully manifest
One-Size vs Adaptive : The same settings work across different market conditions
Simple vs Intelligent : Advanced volatility analysis provides superior market insight
💡 Professional Setup Guide
For Day Trading (Short-term):
RTI Length: 15-20
RTI Smoothing: 8-10
Base MA Length: 20-30
Thresholds: Long 80, Short 60
For Swing Trading (Medium-term):
RTI Length: 25-35 (default range)
RTI Smoothing: 12-15
Base MA Length: 40-50
Thresholds: Long 83, Short 55 (defaults)
For Position Trading (Long-term):
RTI Length: 40-50
RTI Smoothing: 15-20
Base MA Length: 60-80
Thresholds: Long 85, Short 50
🧠 Advanced Trading Techniques
RTI Divergence Analysis:
Watch for divergences between price action and RTI readings. When price makes new highs/lows but RTI doesn't confirm, it often signals upcoming reversals.
Band Width Interpretation:
Expanding Bands : Increasing volatility, expect larger price moves
Contracting Bands : Decreasing volatility, prepare for potential breakouts
Band Touches : Price touching outer bands often signals reversal opportunities
Multi-Timeframe Analysis:
Use RTI on higher timeframes for trend direction and lower timeframes for precise entry timing.
⚠️ Important Risk Disclaimers
Past performance is not indicative of future results. This indicator represents advanced technical analysis but should never be used as the sole basis for trading decisions.
Critical Risk Factors:
Market Conditions : No indicator performs equally well in all market environments
Backtesting Limitations : Historical performance may not reflect future market behavior
Volatility Risk : Adaptive indicators can be sensitive to extreme market conditions
Parameter Sensitivity : Different settings may produce significantly different results
Capital Risk : Always use appropriate position sizing and stop-loss protection
📚 Educational Benefits
This indicator provides exceptional learning opportunities for understanding:
Advanced volatility analysis and measurement techniques
Adaptive indicator design and implementation
The relationship between volatility transitions and price movements
Professional risk management using Kelly Criterion principles
Modern oscillator interpretation and signal generation
🔍 Market Applications
The RTI Shifting Band Oscillator works across various markets:
Forex : Excellent for currency pair volatility analysis
Stocks : Individual equity and index trading
Commodities : Adaptive to commodity market volatility cycles
Cryptocurrencies : Handles extreme volatility variations effectively
Futures : Professional derivatives trading applications
🔧 Technical Innovation
The RTI Shifting Band Oscillator represents years of research into adaptive technical analysis. The proprietary RTI calculation method has been optimized for:
Computational Efficiency : Fast calculation even on high-frequency data
Noise Reduction : Advanced smoothing without excessive lag
Market Adaptability : Automatic adjustment to changing conditions
Signal Clarity : Clear, actionable trading signals
🔔 Updates and Evolution
The RTI Shifting Band Oscillator | QuantMAC continues to evolve with regular updates incorporating the latest research in adaptive technical analysis. The code is thoroughly documented for transparency and educational purposes.
Trading Notice: Financial markets involve substantial risk of loss. The RTI Shifting Band Oscillator is a sophisticated technical analysis tool designed to assist in trading decisions but cannot guarantee profitable outcomes. Always conduct thorough testing, implement proper risk management, and consider seeking advice from qualified financial professionals. Only trade with capital you can afford to lose.
---
Master The Markets With Adaptive Intelligence! 🎯📈

Bollinger Bands Oscillator | QuantMAC📊 Bollinger Bands Oscillator | QuantMAC
🎯 Overview
The Bollinger Bands Oscillator is a sophisticated technical analysis tool that combines the power of traditional Bollinger Bands with an oscillator-based approach for enhanced signal generation. This indicator transforms the classic Bollinger Bands into a percentage-based oscillator, providing clearer entry and exit signals for both trending and ranging markets.
🔧 Key Features
Dual Trading Modes : Choose between Long/Short or Long/Cash strategies
Advanced BB% Calculation : Enhanced Bollinger Band percentage with customizable multipliers
Comprehensive Metrics : Built-in performance analytics including Sharpe Ratio, Sortino Ratio, and Profit Factor
Visual Color Coding : Dynamic bar coloring and 9 different color schemes for optimal chart visibility
Date Range Filtering : Backtest specific time periods with customizable start dates
Real-time Signal Generation : Clear long and short entry signals with threshold customization
Advanced Risk Management : Half Kelly criterion calculation for optimal position sizing
📈 How It Works
The indicator operates by calculating a modified Bollinger Band percentage that oscillates between values, typically ranging from 0 to 100+. When the BB% crosses above the Long Threshold (default: 83), it generates a bullish signal. Conversely, when it crosses below the Short Threshold (default: 55), it produces a bearish signal.
Core Calculation Process:
Calculate the moving average basis using the specified Base Length (default: 40 periods)
Determine standard deviation using a separate SD Length (default: 27 periods)
Create upper and lower bands using the SD Multiplier (default: 2.6)
Convert to percentage oscillator with BB% Multiplier (default: 100)
Generate signals based on threshold crossovers
⚙️ Customizable Parameters
BMD Settings:
Base Length : Controls the moving average period (default: 40)
Standard Deviation Length : Determines volatility calculation period (default: 27)
SD Multiplier : Adjusts band width sensitivity (default: 2.6)
BB% Multiplier : Scales the oscillator values (default: 100)
Source : Choose price source (close, open, high, low, etc.)
Signal Thresholds:
Long Threshold : Entry level for bullish positions (default: 83)
Short Threshold : Entry level for bearish positions (default: 55)
🎨 Visual Elements
Main Chart Overlay:
Bollinger Bands : Upper and lower bands with customizable colors and transparency
Middle Line : Basis line displayed as subtle dots
Band Fill : Colored area between bands for easy visualization
Bar Coloring : Candles change color based on current signal state
Separate Oscillator Pane:
BB% Line : Main oscillator line with dynamic coloring
Threshold Lines : Horizontal lines marking entry/exit levels
Color Coding : Line colors change based on bullish/bearish state
📊 Performance Metrics
The indicator includes a comprehensive metrics table displaying:
Net Profit % : Total return percentage
Max Drawdown % : Maximum peak-to-trough decline
Win Rate % : Percentage of profitable trades
Profit Factor : Ratio of gross profit to gross loss
Sharpe Ratio : Risk-adjusted return measure
Sortino Ratio : Downside risk-adjusted return
Omega Ratio : Probability-weighted ratio of gains vs losses
Half Kelly % : Optimal position sizing recommendation
Total Trades : Number of completed transactions
🎯 Trading Strategies
Long/Short Mode: 🔄
The indicator alternates between long and short positions based on threshold crossovers. This mode is ideal for traders who can profit from both rising and falling markets.
Long/Cash Mode: 💰
This conservative approach only takes long positions, moving to cash during bearish signals. Perfect for traders in accounts that don't allow short selling or those preferring a buy-and-hold approach with strategic exits.
🚀 Getting Started
Add the indicator to your chart
Choose your preferred Trading Mode (Long/Short or Long/Cash)
Adjust the Base Length and SD Length to match your trading timeframe
Fine-tune the Long Threshold and Short Threshold based on your risk tolerance
Select your preferred color scheme from 9 available options
Enable the metrics table to monitor performance in real-time
💡 Pro Tips
Lower thresholds (e.g., Long: 75, Short: 60) generate more frequent but potentially less reliable signals
Higher thresholds (e.g., Long: 90, Short: 45) produce fewer but potentially higher-quality signals
Shorter base lengths make the indicator more responsive to recent price action
Longer base lengths smooth out noise but may lag market turns
Use the Half Kelly % metric to guide position sizing decisions
⚠️ Important Disclaimers
Past performance is not indicative of future results . This indicator is a technical analysis tool designed to assist in trading decisions but should not be used as the sole basis for investment choices.
Key Risk Considerations:
Market Conditions : No indicator works perfectly in all market environments
Backtesting Bias : Historical performance may not reflect future market behavior
Risk Management : Always use proper position sizing and stop-loss orders
Multiple Confirmations : Consider using additional indicators and analysis methods
📚 Educational Value
This indicator serves as an excellent learning tool for understanding:
Bollinger Band mechanics and interpretation
Oscillator-based trading strategies
Performance metrics and risk assessment
Position sizing using Kelly Criterion principles
The relationship between volatility and price movement
🔔 Updates and Support
The Bollinger Bands Oscillator | QuantMAC is regularly updated to ensure compatibility with TradingView's latest features. The code is thoroughly commented for educational purposes and transparency.
Remember: Trading involves substantial risk of loss and is not suitable for all investors. The value of investments may go down as well as up, and you may not get back the amount you invested. Always conduct your own research and consider seeking advice from a qualified financial advisor.

Neural Adaptive VWAPNeural Adaptive VWAP with ML Features is an advanced trading indicator that enhances traditional Volume Weighted Average Price (VWAP) calculations through machine learning-inspired adaptive algorithms and predictive volume modeling.
🌟 Key Features:
🧠 Machine Learning-Inspired Adaptation
Dynamic weight adjustment system that learns from prediction errors
Multi-feature volume prediction using time-of-day patterns, price momentum, and volatility
Adaptive learning mechanism that improves accuracy over time
📊 Enhanced VWAP Calculation
Combines actual and predicted volume for forward-looking VWAP computation
Session-based reset with proper daily anchoring
Confidence bands based on rolling standard deviation for dynamic support/resistance
🎯 Advanced Signal Generation
Volume-confirmed crossover signals to reduce false entries
Color-coded candle visualization based on VWAP position
Multi-level strength indicators (strong/weak bullish/bearish zones)
⚙️ Intelligent Feature Engineering
Normalized volume analysis with statistical z-score
Time-series pattern recognition for intraday volume cycles
Price momentum and volatility integration
Sigmoid activation functions for realistic predictions
📈 How It Works:
The indicator employs a sophisticated feature engineering approach that extracts meaningful patterns from:
Volume Patterns: Normalized volume analysis and historical comparisons
Temporal Features: Time-of-day and minute-based cyclical patterns
Market Dynamics: Price momentum, volatility, and rate of change
Adaptive Learning: Error-based weight adjustment similar to neural network training
Unlike static VWAP indicators, this system continuously adapts its calculation methodology based on real-time market feedback, making it more responsive to changing market conditions while maintaining the reliability of traditional VWAP analysis.
🔧 Customizable Parameters:
VWAP Length (1-200 bars)
Volume Pattern Lookback (5-50 periods)
Learning Rate (0.001-0.1) for adaptation speed
Prediction Horizon (1-10 bars ahead)
Adaptation Period for weight updates
📊 Visual Elements:
Blue Line: Adaptive VWAP with predictive elements
Red/Green Bands: Dynamic confidence zones
Colored Candles: Position-based strength visualization
Signal Arrows: Volume-confirmed entry points
Info Table: Real-time performance metrics and weight distribution
🎯 Best Use Cases:
Intraday Trading: Enhanced execution timing with volume prediction
Institutional-Style Execution: Improved VWAP-based order placement
Trend Following: Adaptive trend identification with confidence zones
Support/Resistance Trading: Dynamic levels that adjust to market conditions

OA - Sigma BandsDescription:
The OA - Sigma Bands indicator is a fully adaptive, volatility-sensitive dynamic band system designed to detect price expansion and potential breakouts. Unlike traditional fixed-width Bollinger Bands, OA - Sigma Bands adjust their boundaries based on a combination of standard deviation (σ) and Average Daily Range (ADR), making them more responsive to real market behavior and shifts in volatility.
Key Concepts & Logic
This tool constructs three distinct band regions:
Sigma Bands (±σ):
Calculated using the standard deviation of the closing price over a user-defined lookback period. This acts as the core volatility filter to identify statistically significant price deviations.
ADR Zones (±ADR):
These zones provide an additional layer based on the percentage average of daily price ranges over the last 20 bars. They help visualize intraday or short-term expected volatility.
Dynamic Adjustment Logic:
When price breaks outside the upper/lower sigma or ADR boundaries for a defined number of bars (user input), the system recalibrates. This ensures that the bands evolve with volatility and don’t remain outdated in trending markets.
Inputs & Customization
Sigma Multiplier: Set how wide the sigma bands should be (default: 1.5).
Lookback Period: Controls how many bars are used to calculate the standard deviation (default: 200).
Break Confirmation Bars: Determines how many candles must close beyond a boundary to trigger band recalibration.
ADR Period: Internally fixed at 20 bars for stable short-term volatility measurement.
Full Color Customization: Customize the band colors and fill transparency to suit your chart style.
Benefits & Use Cases
Breakout Trading: Detect when price exits statistically significant ranges, confirming trend expansion.
Mean Reversion: Use the outer bands as potential reversion zones in sideways or low-volatility markets.
Volatility Awareness: Visually identify when price is compressed or expanding.
Dynamic Structure: The auto-updating nature makes it more reliable than static historical zones.
Overlay-Ready: Designed to sit directly on price charts with minimal clutter.
Disclaimer
This script is intended for educational and informational purposes only. It does not constitute investment advice, financial guidance, or a recommendation to buy or sell any security. Always perform your own research and apply proper risk management before making trading decisions.
If you enjoy this script or find it useful, feel free to give it or leave a comment!

Full Day Midpoint Line with Dynamic StdDev Bands (ETH & RTH)A Pine Script indicator designed to plot a midpoint line based on the high and low prices of a user-defined trading session (typically Extended Trading Hours, ETH) and to add dynamic standard deviation (StdDev) bands around this midpoint.
Session Midpoint Line:
The midpoint is calculated as the average of the session's highest high and lowest low during the defined ETH period (e.g., 4:00 AM to 8:00 PM).
This line represents a central tendency or "fair value" for the session, similar to a pivot point or volume-weighted average price (VWAP) anchor.
Interpretation:
Prices above the midpoint suggest bullish sentiment, while prices below indicate bearish sentiment.
The midpoint can act as a dynamic support/resistance level, where price may revert to or react at this level during the session.
Dynamic StdDev Bands:
The bands are calculated by adding/subtracting a multiple of the standard deviation of the midpoint values (tracked in an array) from the midpoint.
The standard deviation is dynamically computed based on the historical midpoint values within the session, making the bands adaptive to volatility.
Interpretation:
The upper and lower bands represent potential overbought (upper) and oversold (lower) zones.
Prices approaching or crossing the bands may indicate stretched conditions, potentially signaling reversals or breakouts.
Trend Identification:
Use the midpoint as a reference for the session’s trend. Persistent price action above the midpoint suggests bullishness, while below indicates bearishness.
Combine with other indicators (e.g., moving averages, RSI) to confirm trend direction.
Support/Resistance Trading:
Treat the midpoint as a dynamic pivot point. Price rejections or consolidations near the midpoint can be entry points for mean-reversion trades.
The StdDev bands can act as secondary support/resistance levels. For example, price reaching the upper band may signal a potential short entry if accompanied by reversal signals.
Breakout/Breakdown Strategies:
A strong move beyond the upper or lower band may indicate a breakout (bullish above upper, bearish below lower). Confirm with volume or momentum indicators to avoid false breakouts.
The dynamic nature of the bands makes them useful for identifying significant price extensions.
Volatility Assessment:
Wider bands indicate higher volatility, suggesting larger price swings and potentially riskier trades.
Narrow bands suggest consolidation, which may precede a breakout. Traders can prepare for volatility expansions in such scenarios.
The "Full Day Midpoint Line with Dynamic StdDev Bands" is a versatile and visually intuitive indicator well-suited for day traders focusing on session-specific price action. Its dynamic midpoint and volatility-adjusted bands provide valuable insights into support, resistance, and potential reversals or breakouts.

(FVC) Fractal Volatility Compression (DAFE) (FVC) Fractal Volatility Compression
See the Market’s Volatility DNA.
The Fractal Volatility Compression (FVC) is a next-generation tool for traders who want to see volatility compression and expansion across multiple timeframes and volatility engines—not just price, but the very structure of volatility itself.
What Makes FVC Unique?
Dual-Engine Volatility:
Plots both classic price-based (Stdev) and meta-volatility (VoVix) compression/expansion, so you can see when the market is “coiling” or “exploding” on multiple levels.
Fractal, Multi-Timeframe Analysis:
Measures volatility on short, medium, and long timeframes, then normalizes each as a Z-score. The result: a true “coiled spring” detector that works on any asset, any timeframe.
Threshold Lines You Control:
Yellow center line: Your neutral baseline.
Green compression line: When crossed, the market is “spring-loading.”
Red expansion line: When crossed, volatility is breaking out.
All lines are solid, clean, and end before the dashboard for a professional look.
Agreement Fill: When both engines agree (both above or both below the center line), a bright fill highlights the zone—red for expansion, green for compression.
Signature Dashboard & Info Line:
Dashboard (right-middle) shows all Z-scores and FVC values, color-coded for instant clarity.
Compact info label for mobile or minimalist users.
Inputs & Customization
Thresholds: Set the yellow, green, and red lines to match your asset, timeframe, and risk tolerance.
Timeframes & Lengths: Tune the short, medium, and long volatility windows for your style.
Toggle Lines: Show/hide Stdev or VoVix FVC lines independently.
Dashboard & Info Line: Toggle for your workflow and screen size.
How to Use
Compression (below green): Market is “coiling” across timeframes—watch for explosive moves.
Expansion (above red): Volatility is breaking out—expect regime shifts or trend acceleration.
Agreement Fill: When both lines agree, the signal is strongest.
Not a Buy/Sell Signal: These are regime and structure signals—combine with your own
strategy and risk management.
Why should you use FVC?
See what others can’t:
Most tools show only one dimension of volatility. FVC reveals the fractal DNA of market compression and expansion. Works on any asset, any timeframe. Professional, clean, and fully customizable.
Fractal Volatility Compression (FVC):
Because the next big move is born in the market’s hidden compression.
For educational purposes only. Not financial advice. Always use proper risk management
Use with discipline. Trade your edge.
— Dskyz, for DAFE Trading Systems

(MVD) Meta-Volatility Divergence (DAFE) Meta-Volatility Divergence (MVD)
Reveal the Hidden Tension in Volatility.
The Meta-Volatility Divergence (MVD) indicator is a next-generation tool designed to expose the disagreement between multiple volatility measures—helping you spot when the market’s “volatility engines” are out of sync, and a regime shift or volatility event may be brewing.
What Makes MVD Unique?
Multi-Source Volatility Analysis:
Unlike traditional volatility indicators that rely on a single measure, MVD fuses four distinct volatility signals:
ATR (Average True Range): Captures the average range of price movement.
Stdev (Standard Deviation): Measures the dispersion of closing prices.
Range: The average difference between high and low.
VoVix: A proprietary “volatility of volatility” metric, quantifying the difference between fast and slow ATR, normalized by ATR’s own volatility.
Divergence Engine:
The core MVD line (yellow) represents the mean absolute deviation (MAD) of these volatility measures from their average. When the line is flat, all volatility measures are in agreement. When the line rises, it means the market’s volatility signals are diverging—often a precursor to regime shifts, volatility expansions, or hidden stress.
Dynamic Z-Score Normalization:
The MVD line is normalized as a Z-score, so you can easily spot when current divergence is rare or extreme compared to recent history.
Visual Clarity:
Yellow center line: Tracks the real-time divergence of volatility measures.
Green dashed thresholds: Mark the ±2.00 Z-score levels, highlighting when divergence is unusually high and action may be warranted.
Dashboard: Toggleable panel shows all key metrics (ATR, Stdev, VoVix, MVD Z) and your custom branding.
Compact Info Label : For mobile or minimalist users, a single-line summary keeps you informed without clutter.
What Makes The MVD line move?
- The MVD line rises when the included volatility measures (ATR, Stdev, Range, VoVix) are moving in different directions or at different magnitudes. For example, if ATR is rising but Stdev is falling, the line will move up, signaling disagreement.
- The line falls or flattens when all volatility measures are in sync, indicating a consensus in the market’s volatility regime.
- VoVix adds a unique dimension, making the indicator especially sensitive to sudden changes in volatility structure that most tools miss.
Inputs & Settings
ATR Length: Sets the lookback for ATR calculation. Shorter = more sensitive, longer = smoother.
Stdev Length: Sets the lookback for standard deviation. Adjust for your asset’s volatility.
Range Length: Sets the lookback for the average high-low range.
MVD Lookback: Controls the window for Z-score normalization. Higher values = more historical context, lower = more responsive.
Show Dashboard: Toggle the full dashboard panel on/off.
Show Compact Info Label: Toggle the mobile-friendly info line on/off.
Tip:
Adjust these settings to match your asset’s volatility and your trading timeframe. There is no “one size fits all”—tuning is key to extracting the most value from MVD.
How to make MVD work for you:
Threshold Crosses: When the MVD line crosses above or below the green dashed thresholds (±2.00), it signals that volatility measures are diverging more than usual. This is a heads-up that a volatility event, regime shift, or hidden market stress may be developing.
Not a Buy/Sell Signal: A threshold cross is not a direct buy or sell signal. It is an indication that the market’s volatility structure is changing. Use it as a filter, confirmation, or alert in combination with your own strategy and risk management.
Dashboard & Info Line: Use the dashboard for a full view of all metrics, or the info label for a quick glance—especially useful on mobile.
Chart: MNQ! on 5min frames
ATR: 14
StDev L: 11
Range L: 13
MDV LB: 13
Important Note
MVD is a market structure and volatility regime tool.
It is designed to alert you to potential changes in market conditions, not to provide direct trade entries or exits. Always combine with your own analysis and risk management.
Meta-Volatility Divergence:
See the market’s hidden tension. Anticipate the next wave.
For educational purposes only. Not financial advice. Always use proper risk management.
Use with discipline. Trade your edge.
— Dskyz, for DAFE Trading Systems
