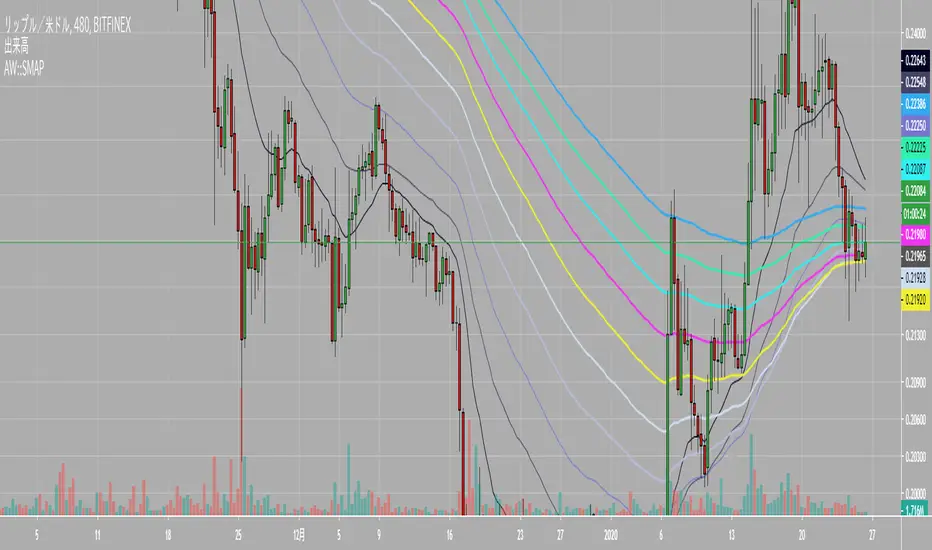
QSMA - 8 Simple Moving Averages (20, 50 - 400) / CryptoprospaModified others script to make SMA in this range.
By adding this one indicator to your chart, you save time and overcome the limits or restrictions to how many indicators you can add to your chart.
You can also modify the colour and\or width to your liking.
Enjoy.
Regards Cryptoprospa.
Sma

Ali_Trading Tools
This Tools includes the following:
MA:50 with Color Code
MA:100,200
EMA:15
Bollinger Bands
Ichimoku Cloud
Pivot Point High and Low

QMA/SMA DifferenceIntroduction
The quadratic moving average (QMA) or quadratic weighted moving average (QWMA) is a type of moving average who is closer to the price when price is up trending. This moving average is defined as the square root of the moving average of the squared price. The QMA-SMA difference use this moving average to provide a new volatility indicator who aim to be reactive and filter noisy volatility in order to only provide essential information.
QMA - SMA
This indicator is defined as the difference between a quadratic moving average and a simple moving average of same period. Since the QMA emphasize up movements and tend to be away from down movements she is always greater than the simple moving average, so a simple difference between those moving average provide our volatility indicator. Below is a comparison with a standard deviation and the indicator of both period 100.
Since its a difference between two moving average it can be interesting to use a simple moving as source for the standard deviation to provide another comparison
The standard deviation is smoother but still contain more information as well as having less reactivity.
Conclusion
I have a presented a new volatility indicator based on the quadratic moving average and compared it with a classic standard deviation. It is possible to change the power order of the QMA in order to provide different results, in order to do so you must also change the root, this is done in pine with : pow(sma(pow(close,w),length),1/w) where w is the power order, notice that an high power order can provide non attributed values.


SuperMega Static/Dynamic EMA & SMA MultiComboAll the moving averages you'll ever need!!!
5 EMAs
5 SMAs
3 static EMAs
3 static SMAs
Static EMAs and SMAs are shown on every timeframe. For example, you can set static EMAs or SMAs to show 21 day, 50 week and 200 week on every timeframe of the chart. Plus standard 5 EMAs and 5 SMAs (user-defined) is showing for that specific timeframe.

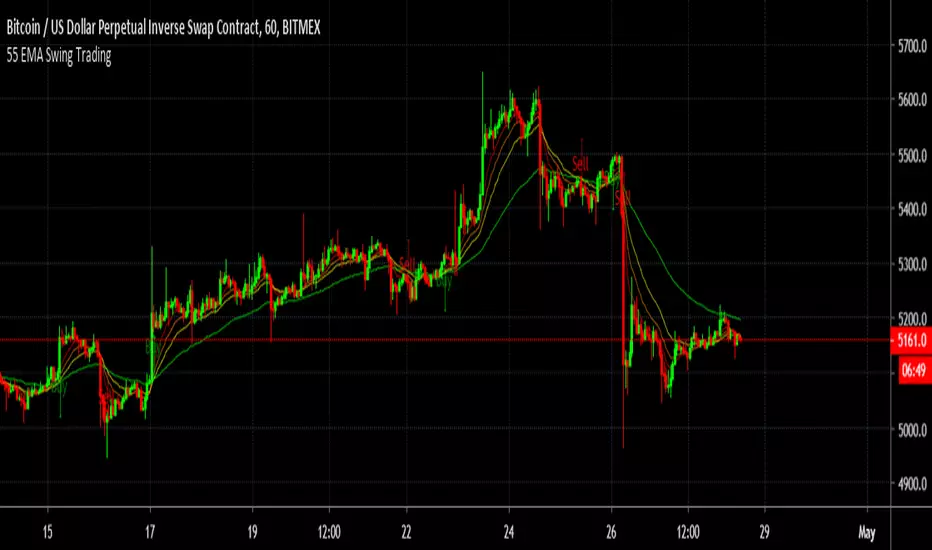
55 EMA Swing TradingA simple Buy and sell strategy using 55 EMA - " 55 EMA Swing Trading"
The source code is publicly available to for further modification.
Multiple MAs - 1ema, 4smaSimple script that allows you to customize the MA's length & color
(1) EMA - exponential moving average
(4) SMA - slow moving averages
Common SMA's are: 10, 50, 100, 200

Dynamically Adjustable Moving AverageIntroduction
The Dynamically Adjustable Moving Average (AMA) is an adaptive moving average proposed by Jacinta Chan Phooi M’ng (1) originally provided to forecast Asian Tiger's futures markets. AMA adjust to market condition in order to avoid whipsaw trades as well as entering the trending market earlier. This moving average showed better results than classical methods (SMA20, EMA20, MAC, MACD, KAMA, OptSMA) using a classical crossover/under strategy in Asian Tiger's futures from 2014 to 2015.
Dynamically Adjustable Moving Average
AMA adjust to market condition using a non-exponential method, which in itself is not common, AMA is described as follow :
1/v * sum(close,v)
where v = σ/√σ
σ is the price standard deviation.
v is defined as the Efficacy Ratio (not be confounded with the Efficiency Ratio) . As you can see v determine the moving average period, you could resume the formula in pine with sma(close,v) but in pine its not possible to use the function sma with variables for length, however you can derive sma using cumulation.
sma ≈ d/length where d = c - c_length and c = cum(close)
So a moving average can be expressed as the difference of the cumulated price by the cumulated price length period back, this difference is then divided by length. The length period of the indicator should be short since rounded version of v tend to become less variables thus providing less adaptive results.
AMA in Forex Market
In 2014/2015 Major Forex currencies where more persistent than Asian Tiger's Futures (2) , also most traded currency pairs tend to have a strong long-term positive autocorrelation so AMA could have in theory provided good results if we only focus on the long term dependency. AMA has been tested with ASEAN-5 Currencies (3) and still showed good results, however forex is still a tricky market, also there is zero proof that switching to a long term moving average during ranging market avoid whipsaw trades (if you have a paper who prove it please pm me) .
Conclusion
An interesting indicator, however the idea behind it is far from being optimal, so far most adaptive methods tend to focus more in adapting themselves to market complexity than volatility. An interesting approach would have been to determine the validity of a signal by checking the efficacy ratio at time t . Backtesting could be a good way to see if the indicator is still performing well.
References
(1) J.C.P. M’ng, Dynamically adjustable moving average (AMA’) technical
analysis indicator to forecast Asian Tigers’ futures markets, Physica A (2018),
doi.org
(2) www.researchgate.net
(3) www.ncbi.nlm.nih.gov


8 Separate Moving AveragesCOINBASE:BTCUSD Combine all your moving averages into one indicator.
This indicator allows for 8 separate moving averages, which can individually be configured as simple or exponential to any lengths you wish.
Allowing you to make room for other indicators.
Since is just moving averages, it can be used in any market.
Find me on twitter. Handle @Samih .

ArkWork:: Switchable MA PackageThis indicator add many EMA (or SMA ).
Each EMA switchable to SMA .
Q. How many?
A. It’s 10 Moving Average.
All Moving AveragesHello guys .
This indicator is for those who need more than three to averages.
If you like, I can add Ichimoku too.
Support me with your likes.
thanks all.

MA's setup with crosses For now the best setup is with almost all crosses. TV restict more than 64 outputs.

SMA/pivot/Bollinger/MACD/RSI en pantalla gráficoMulti-indicador con los indicadores que empleo más pero sin añadir ventanas abajo.
Contiene:
Cruce de 3 medias móviles
La idea es no tenerlas en pantalla, pero están dibujadas también. Yo las dejo ocultas salvo que las quiera mirar para algo.
Lo que presento en pantalla es la media lenta con verde si el cruce de las 3 marca alcista, amarillo si no está claro y rojo si marca bajista.
Pivot
Normalmente los tengo ocultos pero los muestro cuando me interesa. Están todos aunque aparezcan 2 seguidos.
Bandas de Bollinger
No dibujo la línea central porque empleo la media como tal.
Parabollic SAR
Lo empleo para dibujar las ondas de Elliott como postula Matías Menéndez Larre en el capítulo 11 de su libro "Las ondas de Elliott". Así que, aunque se puede mostrar, lo mantengo oculto y lo que muestro es dónde cambia (SAR cambio).
MACD
No está dibujado porque necesitaría sacarlo del gráfico.
Marco en la parte superior cuándo la señal sobrepasa al MACD hacia arriba o hacia abajo con un flecha indicando el sentido de esta señal.
RSI
Similar al MACD pero en la parte inferior.
Probablemente, programe otro indicador para visualizar en una ventanita MACD, RSI y volumen todo junto. El volumen en la principal hay veces que no te permite ver bien alguna sombra y los otros 2 te quitan mucho espacio para graficar si los tienes permanentemente en 2 ventanas separadas.
Zero Phase Filtering [Repaint] - ExperimentalImportant !
The indicator is for experimental purpose only, it must not be used as a decisional tool but only as a visual one (like Zig-Zag, Fractal etc). The information this indicator display is uncertain and subject to drastic changes over time. If you have further question feel free to pm me.
Introduction
Most of the filters you will find are causal, this mean that they depend on present and past input values, this explain the lag they produce. Non causal filters however will use future input values. A well know way to get a zero-phase filter is by using the forward backward method, but this is not possible in pinescript as i recall. So we have to use some kind of function that will display future values, this is possible using the security function in version 2 or the one in version 3 using barmerge.lookahead_on .
The Use Of A Repainting Indicator
Its always better to filter data in order to have a clearer view of what is happening, this can be useful when doing some forecasting or doing less formal kind of analysis. However since it repaint you cant use it as a signal provider or use signals of other indicators using this filter as source.
For example if you want to forecast a smooth indicator, the forecast of this indicator under normal circumstances could still have lag associated with it, so you would have to react before your forecast, this wont happen if you apply this filter as your indicator source.
The Filter
We smooth with a simple moving average the price provided by the security function twice, length control the smoothing level. Since security depend on the time frame you are in you must select your time frame in the indicator parameter selection window.
Filtering using 45 minutes time frame close price in a 5 minutes chart, we fix this by selecting our time frame.
Consider the fact that the input of the indicator is just periodic price, so sometimes the lag can sometimes be less or more than 0 and the estimation not centered.
The indicator can work on time frames up to 1h, after that the filter have some lag, i tried fixing this and i ended up having data errors.
Applying our filter as source for the rsi oscillator.
Conclusion
It is possible to have a kind of zero-phase filters, but it would be better if pinescript could support backward indexing thus making us able to do forward backward filtering.
Since noise can affect our analysis, applying smoothing without having to use offset in plot can be considered useful.

Nova's: MA Assassin ComboALL IN ONE MOVING AVERAGE STRATEGY.
SAVE SPACE AND ASSASSINATE THE MARKET!!

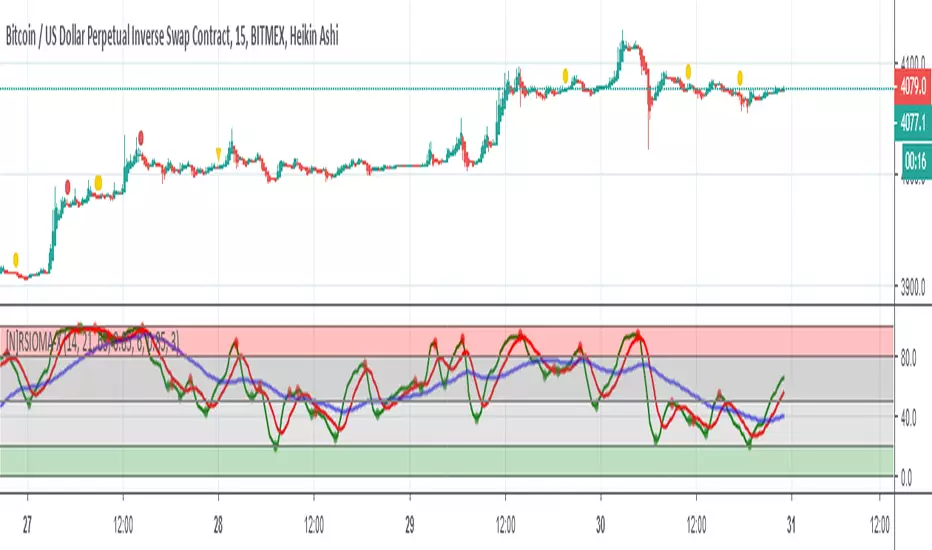
[N]RSIOMA - eXtremisRSIOMA Indicator
This indicator takes two moving averages, calculates their RSI (Relative Strength Index) and then also adds a moving average of the calculated RSI. These two lines now can accurately signal the trend changes.
RSIOMA eXtremis is based on ALMA (Arnaud Legoux Moving Average)
- Why ALMA?
- The Arnaud Legoux moving average applies the moving average twice, once from left to right and the other from right from left with the process said to eliminate price lag or phase shift significantly ,
a problem that is common to the traditional moving averages.
About ALMA
Offset : The offset value is used to tweak the ALMA to be more inclined towards responsiveness or smoothness. The offset can be set in decimals between 0 and 1. A setting of 0.99 makes the ALMA extremely responsive, while a value of 0.01 makes it very smooth.
Sigma : The sigma setting is a parameter used for the filter. A setting of 6 makes the filter rather large while a smaller sigma setting makes it more focused.
About Market Base
It shows the overall direction of the market. The overall market has a tendency to do two things. It can turn slowly, or it can continue to go in the initial direction. This is because it’s too big and it can’t turn too quickly.
About Divergences
Regular Divergence - regular divergence is a sign of trend reversal.
Hidden Divergence - hidden divergence is a sign of trend continuation
RSIOMA eXtremis can detect all types.
HOW TO TRADE
- Look out for bounces. When RSI line bounces off from MA line it means the trend will likely continue;
- Look out for support / resistance of RSI LINE.
- Look out for Market Base Line, it can be used to determine the long-term trend.
- 20 - 80 levels are important
- Green > Red = Long
- Red > Green = Short
- Green > Red > Market Base = you can go long for a while
- Red > Green > Market Base = you can go short for a while
- Green & Red bounce from Market Base = initial trend will continue
- Look out for divergences
- Look out for retests after bounces
- Look out for those tiny dots!! Those can tell you a great story. ;)
Try different settings for your strategy
MAY THE % BE WITH YOU!
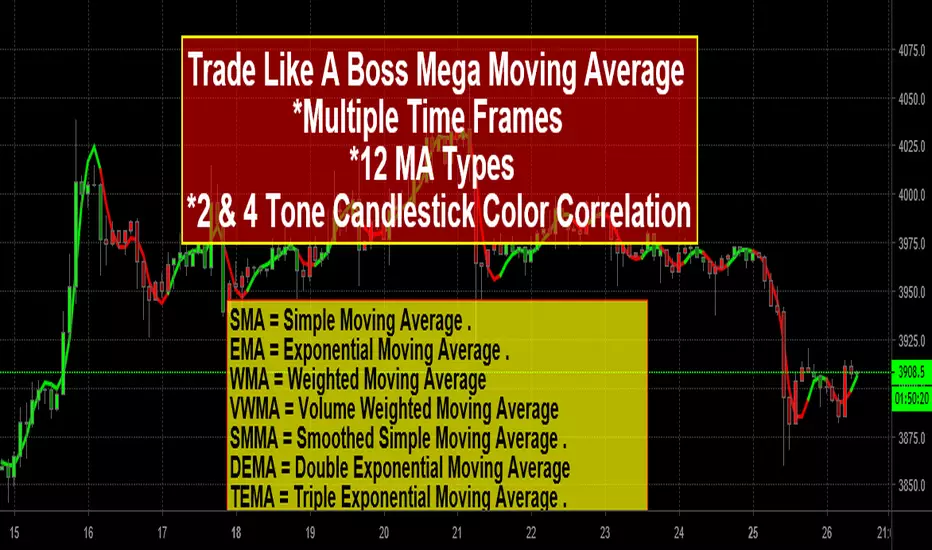
Trade Like A Boss Mega Moving Average-Multi-TimeFrame-12MA TypesTrade Like A Boss MA Has 12 Moving Averages and Includes 2-Tone & 4-Tone Candlestick Color Correlation All In ONE Indicator. The Trade Like A Boss MA Is Absolutely The Only Moving Average Indicator You Will Ever Need.
*Buy or Long on Green, Sell or Short on Red
( Indicator is preset with HullMa for 2 hour and 4 hour timeframes )
Enjoy! And Happy Trading!
Features/Options:
Choose between 12 different types of moving averages, or add all or a few MA's to your chart:
SMA = Simple Moving Average .
EMA = Exponential Moving Average .
WMA = Weighted Moving Average
VWMA = Volume Weighted Moving Average
SMMA = Smoothed Simple Moving Average .
DEMA = Double Exponential Moving Average
TEMA = Triple Exponential Moving Average .
LAGMA = Laguerre Moving Average.
HullMA = Hull Moving Average
SSMA = Ehlers Super Smoother Moving average
ZEMA = Near Zero Lag Exponential Moving Average .
TMA = Triangular (smoothed) Simple Moving Average .
3) Candlestick Color Correlation -
2-Tone Candle Colors:
Lime = candle closed above MA Line.
Red = candle closed below MA Line.
4-Tone Candle Colors :
Lime = Bullish candle closed above MA Line.
Green = Bearish candle closed above MA Line.
Red = Bullish candle closed below MA Line.
Maroon = Bearish candle closed below MA Line.
If you enjoy using this indicator and make money please feel free to send a donation to my Bitmex donation trading account!
Send BTC donation to -3BMEXd8stjXuJtVHz3gxU5RQ37AXKCB3hg
All proceeds from this account go to The Hydrocephalus Association.
My eldest daughter was born with Congenital Hydrocephalus
RPS Moving Average CrossThis indicator is a powerful SMA and EMA Cross tool, that gives the trader better perception on the trend and gives potential BUY (UP arrow) and SELL (DOWN arrow) signals.
Highly configurable and gives deep customization, valuing individual preferences.
How to trade using this tool:
Buy @ Bullish 5 X 8 and Sell @ Bearish 5 X 8 (Suitable for Intra-Day Traders)
Buy @ Bullish 10 X 21 and Sell @ Bearish 10 X 21 (Suitable for Day Traders)
Buy @ Bullish 21 X 50 and Sell @ Bearish 21 X 50 (Suitable for Swing Traders)
Buy @ Bullish 50 X 200 and Sell @ Bearish 50 X 200 (Suitable for Investors)
Hit Like, if you find any value in this tool.
Share your trading experience using this tool in the comments section.
Thank you!
~RPS~
