Gucci Sniper Trading Bot [Open]A simple Buy/Sell signal algo designed for a trading bot.
Uses ATR and EMA cross to get signals.
Signals

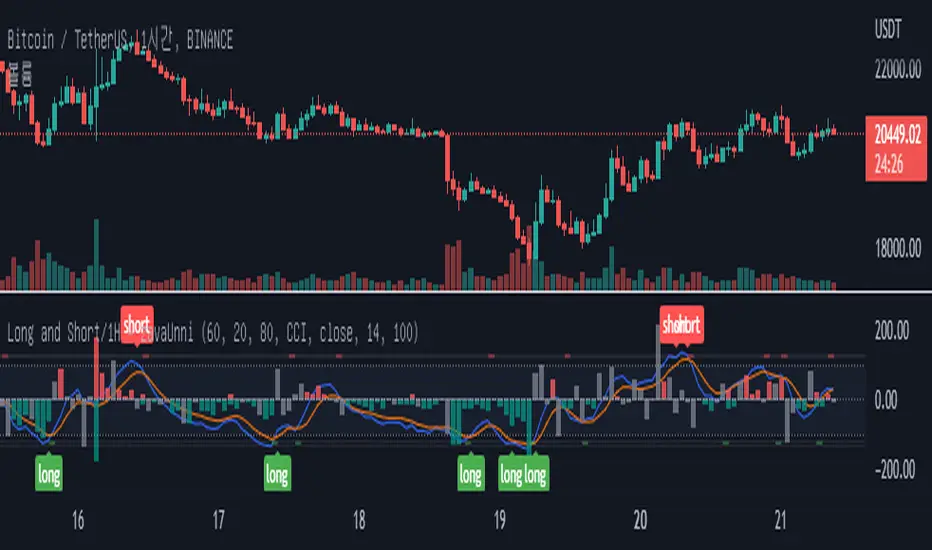
Long and Short Signal_1hours [zavaUnni]This indicator is available in the 1 hour chart.
The Stochastic value of 1 hour of 3 types of length was requested, summed, and then the value was derived.
The blue line is the K and the orange line is D of the Stochastic.
The default is Stochastic, but when RSI is selected in the settings, it can be viewed as the relative strength index of the Stochastic.
If the K value crosses down at 100, a short signal is generated
Cross up below -100 and you'll get a long signal.
You can receive a ready signal by checking Position Ready in Settings.
Short ready signal when the k line goes up to 100.
Long ready signal when the k line goes below -100.
A small spread value of the candle relative to the volume is the principle that resistance has occurred.
Displayed the resistance value based on the average value of the last 100 candles.
The higher the value of the red Histogram, the stronger the selling.
The lower the value of the green Histogram value, the stronger the buying .
The gray histogram is when there's no buying or selling pressure.
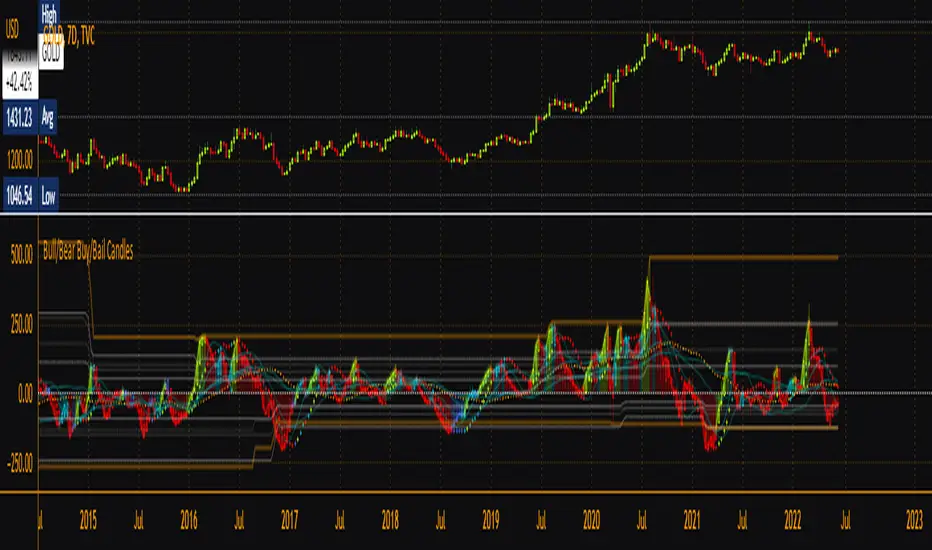
Bull/Bear Buy/Bail CandlesBased on BullBearPower indicator, this is a heavily modified version with colored candles to show when bulls or bears are buying or bailing. Includes Fibonacci Levels based on Highest/Lowest value in variable length, along with optional second timeframe and alternative calculation for candles and linear regression curves for increased versatility. Green = bullish /long, Aqua = still-bullish albeit weakening, blue = weak albeit strengthening and red = weak/short. Perfect as a confirmation indicator for those looking to time markets.
Ext/Non EMA SignalsThis allows for one EMA to reference the regular session well the other references the extended session. A green arrow will appear above a bear candle closing above both the EMAs and a Red arrow on bull candles closing below both.
This saves me time from jumping back and forth from extended sessions and regular session.
Let me know if you have any questions, I just recently started using Pine Editor to build indicators I was not able to find in the library.

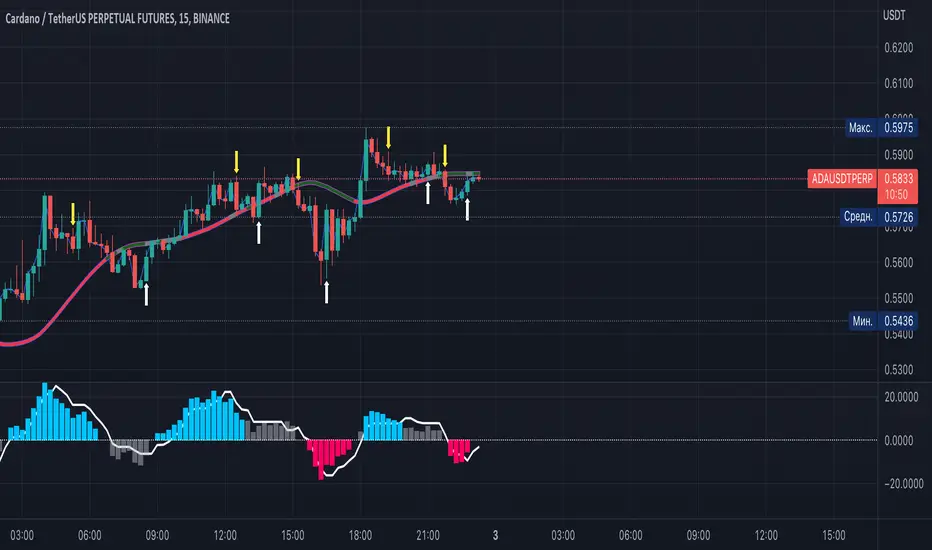
SP IndicatorSP Indicator - One of the best indicators for scalping trading on any timeframes. The best readings are given on 5, 15 and 30 minute frames.
For readings, several indicators are combined into one, which allows you to get a more accurate forecast, which is more than 90%.
Instruction.
The indicator is easy to use. Just install it and follow the arrows to go long or short. Stop loss set small, about 1-2%. In most cases, this is sufficient.
Good luck in bidding!
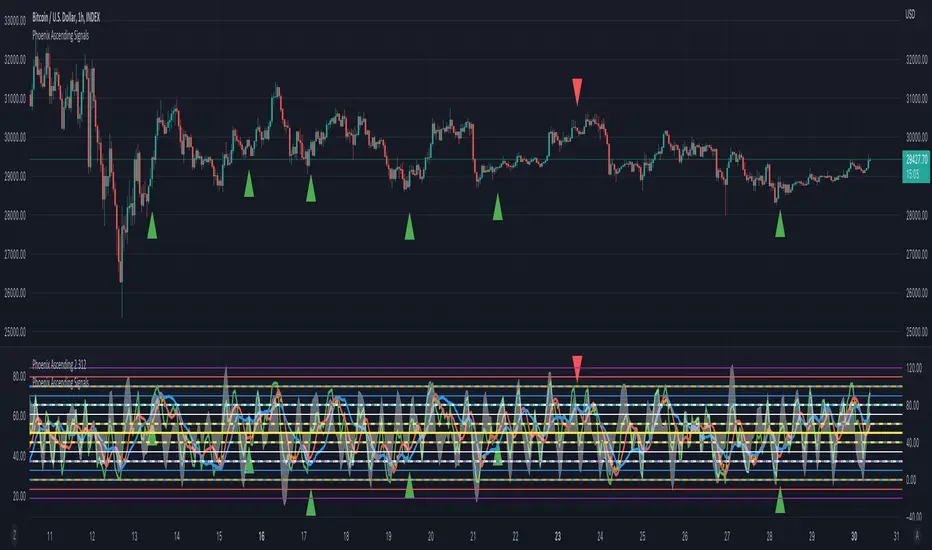
Phoenix Ascending SignalsThis is an overlay script for Phoenix Ascending Oscillator. This indicator will signal entries (red/green triangles) and bounces (yellow triangles). In settings select "Phoenix Ascending: Red RSI". You can overlay on the oscillator or over the chart (choose above and below bars in style settings)
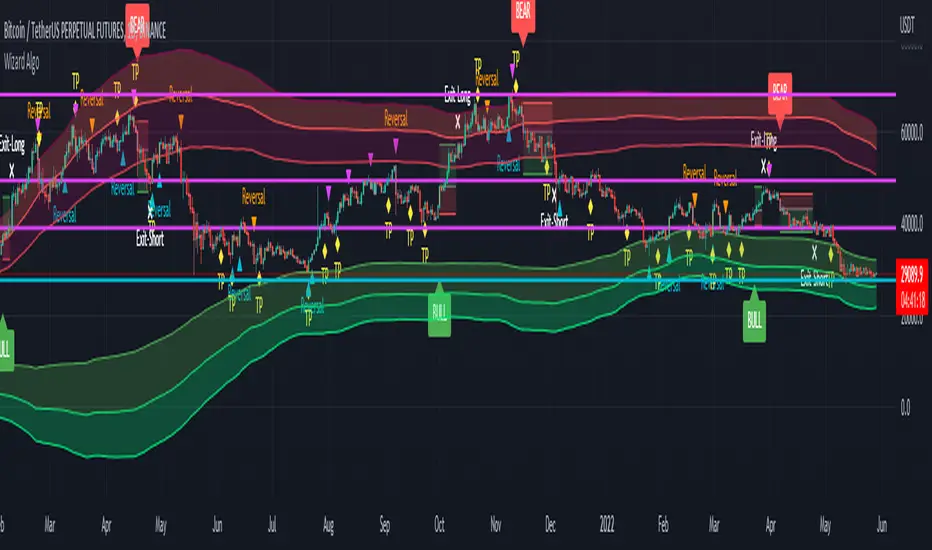
Wizard AlgoWizard Algo:
==============================
Features of the indicator:
- BULL/BEAR Signals
- TP (Take-Profit) and Exit System
- Possible Reversal Signals
- Reversal Scalper
- Reversal Bands
- Trend Bar Colors
- Auto Support/Resistance Levels
- Auto Trend-Lines
================================
Description:
1. Signals: The signals consists of 2 different approaches and the users can choose which signal type they want to use. The indicator gives bull/bear signals based on certain condition, such as trend and momentum. The "TP" signals stands for "Take Profit." These signals help users to decide when to take profits or liquidate all position. The Indicator includes an exit system that can used as another means of closing a position. The exit system uses a 1.5x risk to reward ratio to determine where to keep the take profit and stop loss target.
2.Reversal Scalper: Reversal scalpers are the tiny up(aqua) and down(fuchsia) triangles on the chart. These signals a possible reversal in the price and they can be used to enter a scalping trade. The signals uses mainly momentum and candle price action to determine when there could be a possible reversal in price.
3. Reversal Bands: The reversal band is the green/red cloud like indicator. This can help determine when a price is oversold and therefore, it could reverse. Same goes for the short side, if price is in the overbought territory, then it could reverse to the downside. The reversal bands uses mainly volatility. This is not the same thing as Bollinger bands.
4. Bar Colors: The candle bar colors helps to determine the current trend. The colors are given based on the current trend. The colors lime/red shows strong trend, and orange/cyan/blue shows weak trend.
5. Auto S/R and Auto trendlines: These indicators can be used for determining price actions. Both of these work in similar manner. They mainly look at the previous pivots and draws a line connecting the pivots. S/R are the horizontal lines and the trendline have angles to them.
Trend & Momentum V2Declutter your charts. Simple indicator combining trend and momentum using Moving Average (currently default to 9-day EMA) and RSI (default length of 8). A long signal is generated when the price closes above the moving average and the moving average color turns red to green which indicated that the momentum measured using RSI is greater than 50. A short signal is generated when the price closes below the moving average and the moving average color turns green to red indicating RSI is below 50. Confirmation is done if there is no reversal on the next candle. For best results use multiple timeframe charts to trade on the right side of trend and momentum.

Boom Hunter XL SignalsThis is the alerts script for Boom Hunter XL and overlays on top of your chart or over your indicator. Alerts are provided for common Boom Hunter XL signals such as breakouts, first pullbacks, pumps, dumps, overbought and oversold.
Small Triangle = First pullback entry
Triangle = Breakout
Square = Overbought/Oversold
Circle = Pump and Dump
Bar Colors can be turned on in the settings. Colors are available for signalling pressure, channel pressure and trend.

Best Ichimoku Buy and Sell with alertsThis is Indicator is based on Ichimoku Clouds with Buy and Sell positions and alerts. Before using this indicator take note of the following:
1. This indicator is not Repaiting.
2. there are three ways to put your SL/TP:
* you can use the yellow line above or below the candles to put your SL and your R/R ratio will be 1:1, 1:2, 1:3 (depending on the timeframe and the pairs you choose; I advise you to backtest in your desired timeframe and your currency pairs to choose the right R/R)
* You can choose SL/TP based on Percentage or ATR (It is configurable in the setting; I again advise you to backtest in your desired timeframe and your currency pairs to choose the right R/R)
3. Please pay attention to the Green and Red circles. If there is a Green circle before the Buy position it gives it more confirmation and if there is a Red circle before the Sell position it gives more confirmation on the Sell position (pay attention that these circles appear with latency)
4. If the yellow line is below the candles and it gives Sell signal or the yellow line is above the candles and it gives Buy signal, it is better to avoid that signals.
4. Use this indicator with top 30 Crypto pairs (You can also backtest on other coins as well)
5. Please use this indicator at your discretion and backtest first.
6. If you have any idea to improve the results please let me know in the comments.

Glow-Node AlertsGlow Node Multi Pair Alerts
This indicator allows you to set a single alert in trading view while being alerted of Glow Node auto pilot signals from up to 32 forex pairs.
How to Use
Simply open the indicator on screen.
By default the indicator will have all forex pairs unselected.
Open the settings and toggle the forex pair you would like to set an alert for in the current timeframe.
(Alert signals are optimised using our glow node auto pilot feature. These alerts cant be used with custom settings due to the pair switching.)
Set an alert in trading view and select the drop down.
Select Glow Node Multi alerts and your good to go......
Supported Pairs:
XAUUSD
XAGUSD
AUDCAD
AUDCHF
AUDJPY
AUDNZD
AUDUSD
CADCHF
CADJPY
CHFJPY
EURAUD
EURCAD
EURCHF
EURGBP
EURJPY
EURNZD
EURUSD
GBPAUD
GBPCAD
GBPCHF
GBPJPY
GBPNZD
GBPUSD
NZDCAD
NZDCHF
NZDJPY
USDCAD
USDCHF
USDJPY
BTCUSD
ETHUSD
LTCUSD

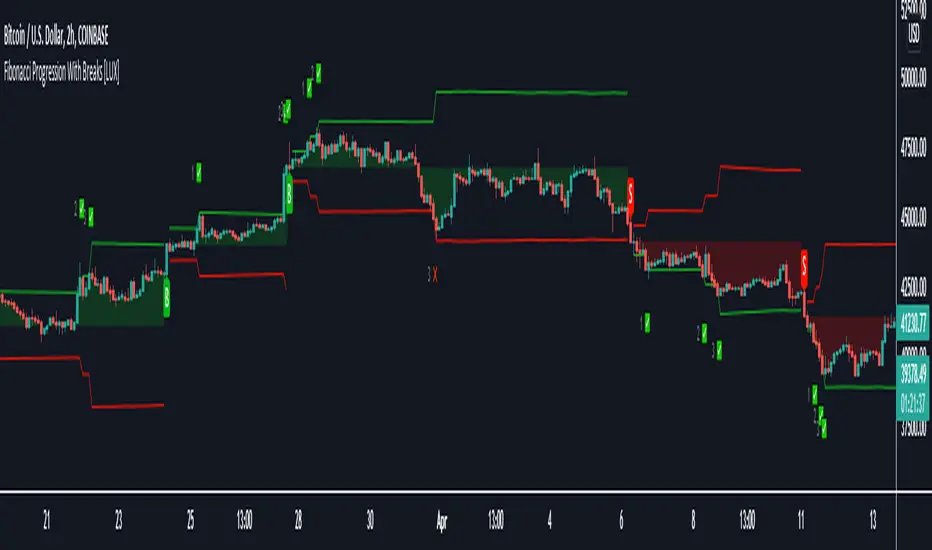
Fibonacci Progression with Breaks [LuxAlgo]This indicator highlights points where price significantly deviates from a central level. This deviation distance is determined by a user-set value or using a multiple of a period 200 Atr and is multiplied by successive values of the Fibonacci sequence.
Settings
Method: Distance method, options include "Manual" or "Atr"
Size: Distance in points if the selected method is "Manual" or Atr multiplier if the selected method is "Atr"
Sequence Length: Determines the maximum number of significant deviations allowed.
Usage
The indicator allows highlighting potential reversal points, but it can also determine trends using the central level, with an uptrend detected if the central level is higher than its previous value and vice versa for a downtrend.
When an uptrend is detected, and the price deviates significantly upward from it a first checkmark will be highlighted alongside the Fibonacci sequence used as a multiplier, if the price deviates downward, a cross will be shown instead, then the distance threshold will be multiplied by the next value in the Fibonacci sequence.
If the price deviates from the central level such that the length of the sequence is greater than the user set Sequence Length , a break label will be shown alongside a new central level with a value determined by the current closing price, while the Fibonacci multiplier will be reset to 1.
Upper and lower extremities made from the central level and threshold distance are highlighted and can be used as support and resistances.
Glow-NodeThis indicator uses multiple different indicators in confluence to identify the direction of the trend, pullback zones, accurate entry points and even exit points to give you a simpler trading experience!
Colour Changing Candles
Our first focus was to identify the direction of the trend so we created an indicator to do just that. Instead of having lots of indicators covering your screen we have set the candles to change colour when the trend changes direction! This means you can focus on taking buy trades when the candles are blue and sell trades when the candles are purple.
Glow Cloud
Our unique cloud works as a support and resistance zone, as well as giving you additional confirmation of the direction of the trend. When the price is above the cloud we’re in a buying market and when the price is below the cloud we’re in a selling market. We can also use breakouts and retests of the cloud to find good trade ideas.
Integrated Volume Indicators
Our volume indicators are working hard in the background to give us a better understanding of the market bias. Although you cannot see the indicators, they are used in confluence with the rest of the features to give us more accurate signals. You can also see whether the volume indicates bullish or bearish momentum using the confirmation table.
Main Signals
Our main signals work best between the 15m-4h timeframes. This feature will send you trading signals based on a few different strategies including MA crossovers. Glow Node will only send the signal when all of the confirmations align, giving you an extremely accurate trade set up. The confirmations consist of the market being in an uptrend, bullish volume, above the cloud and then a cross over signal with our secret tool for a buy trade and vice versa for a sell trade.
Scalping Signals
We know how much you all love scalping! When you drop to a 5 minute timeframe or lower, the main signals disappear and you will only be able to see the scalping signals. The scalping signals are triggered when the market pulls back to the cloud and rejects it meaning you can catch all the pullbacks and continuation as you trade with the trend! We’re honestly extremely excited about this feature!
Confirmation Table
Our confirmation table will tell you if all of the features above are in confluence with each other giving you great trading opportunities. It will also show you what direction the market is trending on higher timeframes. This means you can trade with a higher timeframe trend without having to change your screen. You also don’t have to put lots of effort into adding more confirmations if you miss a signal you can use your own strategy and the confirmations from this table to create your own trade ideas.
Stop Loss Indicators
Stop losses are always a topic of conversation when it comes to trading, do you place your stop loss below the previous low? Previous candle? Below a moving average? There’s so much confusion when it comes to where to put your stop loss so we added 2 different stop loss features which you can decide between. We are always optimising our stop loss settings with the current market conditions so that you can take less losing trades and focus more on winners!

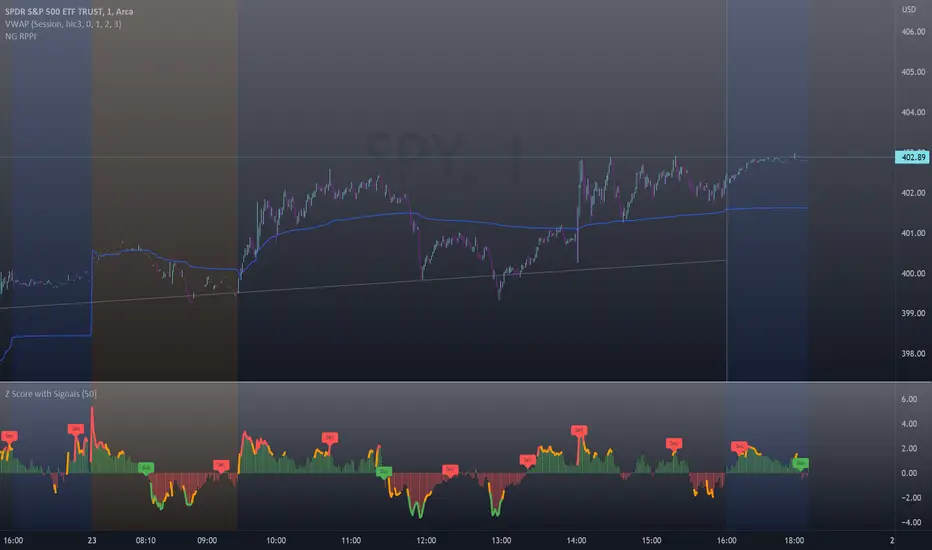
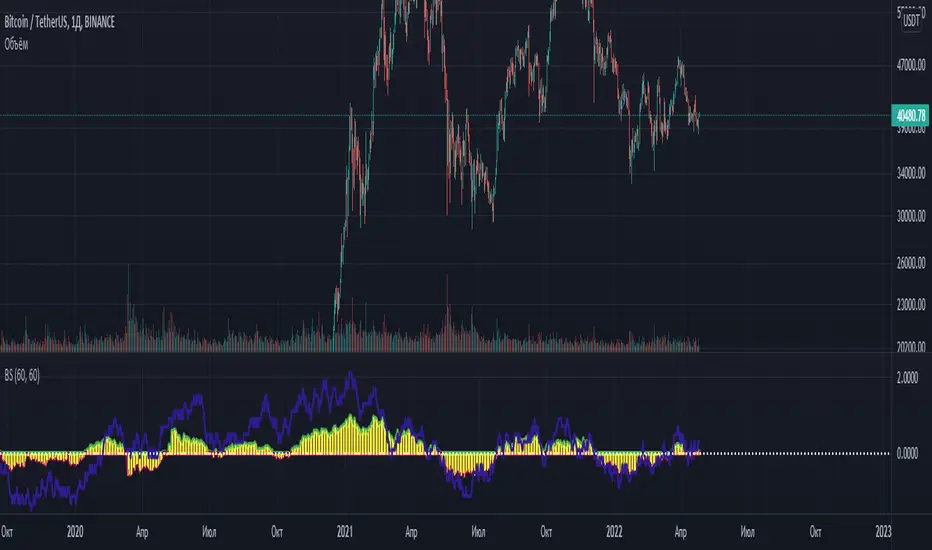
Z-Score with Buy & Sell SignalsThis is my open-source indicator of z-score with buy and sell indicators.
I see there are other z-score indicators, I just am particular about how I like my z-scores calculated and so decided to make my own and add buy and sell signals to help guide me. And I figured I could share it openly here!
What is a Z-Score
A z-score is a statistical measures of the distance, in standard deviations, a value is from its given mean. It is expressed as a standard deviation (or SD). The further a value (in this case, a stock) is from their mean, the more likely a regression to the mean is possible (i.e. a return to the average). So if a stock is trading at 3 standard deviations away from its mean, then we can anticipate it wanting to regress back towards 1 to 0 standard deviations from its mean (i.e. sell off back to a value that brings it closer to that SD).
The inverse is true if it is trading below.
Z-Scores and Stocks
Stocks, like everything in nature, like to trade between -1 and +1 SD away from its mean. Anything above this, we can interpret that there is "stress" on the stock. Anything over 2.50 is tremendous stress on the stock and we can anticipate that it will want to revert to its mean in the near future and bring that value down to at least 1, ideally between the -0.5 and 0.5 range.
Please note, I set the standard VERY high for the indicator to issue a buy and sell signal (/=2.50). Lately with the volatility, stocks have been entering these ranges frequently and so there have been plenty of signals, but traditionally in a stable environment you may not get these signals. I set the bar extremely high because I want to avoid false buy and sell signals (you will still get them though, nothing is perfect!). So the value in this indicator is in interpreting the actual z-score itself, so please be sure you understand exactly what the Z-score is (see the description above).
How the indicator works
The indicator works by calculating the average Z-Score between a stocks high and low. This indicator will present the average deviation a stock has from its high and low average. The higher the Z-Score, the more "overbought" the stock is. The lower the z-score, the more "oversold" the stock is. It uses the previous 500 candles worth of data to calculate its SMA and its Standard deviation in order to calculate the z-score.
Anytime a stock trades 2.50 SDs or more above or below its mean, you will be presented with a Buy or Sell signal, as generally, statistically speaking, after something has travelled 2.50 SDs aware from its mean, there is an increased probability of a reversion happening.
You can use this indicator to determine whether the stock is trading within normal parameters or not and to help you in your analysis as to whether or not a stock could be shorted or longed.
I personally like this for swing trading on the 1 hour chart; however, this can be used on any time from 1 minute to 1 hour. It also allows you to track a stocks progress in its reversion to the mean.
Examples of it in Use:
Gold ETF (ARCA: GLD) on 1 minute
Dow Jones ETF (ARCA: DIA) on 1 minute (my favourite Stock!)
SPY ETF (ARCA: SPY) on 1 hour chart
Disclaimer:
This is not meant to be placed as a sole and single strategy. It should be used in COJUNCTION with your other strategies to help you make a determination.
No indicator is infallible and should never be relied on 100%!
Please let me know your questions/comments/experiences/recommendations below!
Thanks everyone!
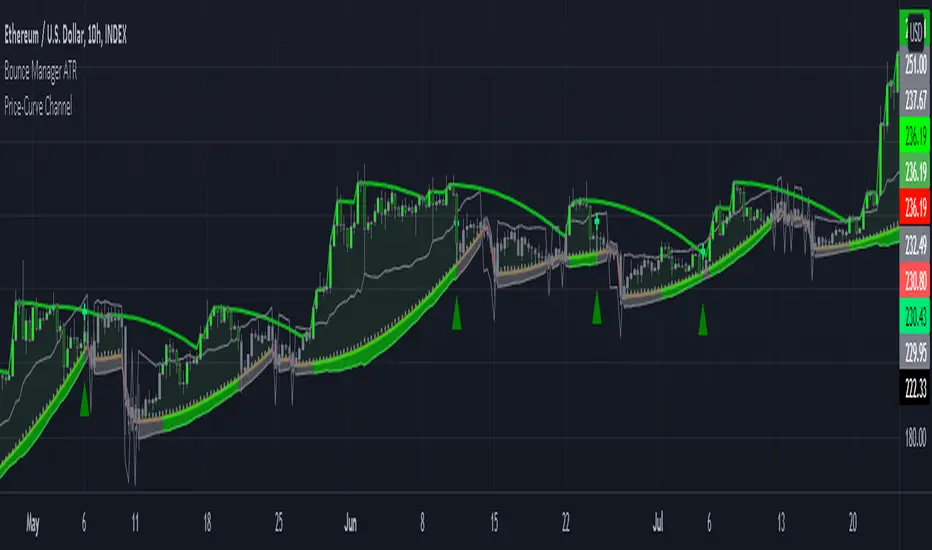
Bounce Manager ATRThis is a tool to turn any line or indicator into a signaller from bounces from the source line.
The ATR version is build to specify what would be considered a worthy entry from the line using ATR multiplier values as inputs.
COMPONENTS:
- Max violation: When price moves past this the script will no longer look for entry until a new trend has been established. The line can also be used as a stop loss.
- Confirmation line: When price touches the line during a trend it
will wait to cross over this line to confirm a reaction from the line.
- Min past distance: A trend filtering system, this is a distance from
the line price has to break to confirm trend direction.
- Stop loss: This can be set to a percentage distance from the low after
bounce. Or it can be set to the max violation line
- Take profit: This can be a fixed take profit target or a risk to reward
based take profit. With risk to reward it will multiply the stop loss
distance by the input and use that to create target (green cross)
- ATR based or % based: there are 2 versions of the script, one for strict
percentage based logic and another one based on ATR values
In bounce manager v1 these stop loss and take profit targets are there only for plotting and visual backtesting purposes. Right now it can only send long and short signals.
Part of the Honest Algo service.
Momentum 2.0 [AstrideUnicorn]Momentum 2.0 is a normalized Momentum oscillator with a moving base-level. The oscillator value is normalized by its standard deviation, similar to the z-score technique. Instead of the zero level, the indicator uses the base-level calculated as the inverted long-term average value of the oscillator. Similar to the zero-level crossing signal used for the Momentum oscillator, our oscillator calculates the base level crossing signal.
The moving base-level helps to reduce the number of false signals. In an uptrend the base-level is below zero, in a downtrend it is above it. This allows us to take into account the trend stability effect. In this case, to form a reversal signal, the oscillator must cross a lower value in an uptrend and a higher value in a downtrend.
HOW TO USE
When the oscillator crosses above the base-level, it gives a bullish signal, when below it gives a bearish signal. The signals are displayed as green and red labels, respectively.
The color of the histogram shows the current direction of the price momentum. Green indicates an upward move and red indicates a downward move. The blue line represents the base-level.
SETTINGS
Oscillator Period - determines the period of the Momentum oscillator
Base Level Period - determines the period used for long-term averaging when calculating the base-level and normalizing the oscillator

Botvenko ScriptI just test&learn pine script...
Damn, what should I write here? So... Its just a differense between the logarithms of two prices of different periods (You can set the period you want)... And it looks really nice... Ahem...
I hope, you enjoy this piece of... Have a nice day, my dear.
Ichimoku Buy/Sell Signals of manual MTF Tenkan crossing KijunIchimoku Buy/Sell Signals based on fast, small time frame Tenkans crossing longer timeframes Kijuns - Manual MTF Analysis
This code marks the potential change of direction based on the input of one timeframe's Ichimoku Tenkan (conversion) line crossing over a higher, longer timeframe's Ichimoku Kijun (base) line.
Feel free to change the inputs if need be and to hide the yellow box. Use Ichimoku rules of Tenkan, Kijun, Lagging Span, and Cloud for Take profit/Stop Losses. It is best to wait 3-5 minutes after the signal to enter to confirm the trend and to confirm if the Lagging Span has broken key levels. I refer to the book Trading with Ichimoku - A Practical Guide to Low-Risk Ichimoku Strategies by Karen Peloille as the Ichimoku rulebook. Good luck.
For day trading/scalping/intraday - 1min/3min/5min
Tenkan Line Timeframe = 1min
Kijun Line Timeframe = 5min
For swing trading - multiple days/weeks - 4HR/Daily/Weekly Charts
Tenkan Line Timeframe = day
Kijun Line Timeframe = week

Money Maykah -- DC-ATR , Stochastic RSI signals v.1-89 --This indicator shows the Stochastic RSI (SSRI) for overbought when the Donchian Channel (DC) is in the upper zone (between basis and upper), and SSRI for oversold when the DC is in the lower zone.
The DC upper and lower have a percentage of the ATR added I call this DC-ATR.
There can be numerous ways to form a strategy based on this. For a bull trend, an ABCD could be traced by A/C = blue signals and B/D = red signals.
Let me know what you think or if there is something wrong with the code. It's probably not the cleanest or more efficient but I am not a pro. If you find a good way to make a strategy from the indicator let me know.
Hope you enjoy!
-Casey R

Candle relative powerThis indicator tries to measure the power of candle.
You can also integrate some candles to measure the power. The “Length” is for integrating candles. If the Length is equal 5, it means indicator calculate power of recent 5 candles.
The second editable factor in “Shadow index” which represent the power of shadows.
The last factor in Average Criteria which is the module of comparing the integrated candles to the past market moves.
This indicator do not supposed to create trading signals! But, you can see every time it breaks the static line it is a sign of bulls or bears power.
I personally use it as a candle power meter so I will evaluate the power of breakouts or trend continuations.

OnBalanceVolume by DGTComparing relative action between price bars and On-Balance Volume (OBV) generates more actionable signals, and plotting OBV on top of price chart alows to visually emphasis the relation between the price bars and OBV.
The On Balance Volume indicator (OBV) is a good metric for measuring buying and selling pressure. Many people believe that buying and selling pressure precede changes in price, making this indicator valuable. The actual individual quantitative value of OBV is not relevant. Instead, traders and analysts look to the nature of OBV movements over time; the slope of the OBV line carries all of the weight of analysis.
* Trend Identification - On Balance Volume (OBV) is useful for identifying or confirming overall market trends, when both price and OBV are moving in the same direction the underlying trend is likely to continue.
* Devrgence - divergence occurs when price movement is not confirmed by the indicator. In many cases, these divergences can indicate a potential reversal
* During a trading range, if the OBV is rising, accumulation may be taking place—a warning of an upward breakout, and coversly if the OBV is falling, distribution may be taking place—a warning of a downward breakout.
Note of caution in using the On Balance Volume
- It is a leading indicator, meaning that it may produce predictions, but there is little it can say about what has actually happened in terms of the signals it produces. Because of this, it is prone to produce false signals. It can therefore be balanced by lagging indicators. Add a moving average line to the OBV to look for OBV line breakouts; you can confirm a breakout in the price if the OBV indicator makes a concurrent breakout
- A large spike in volume on a single day can throw off the indicator for quite a while. For instance, a surprise earnings announcement, being added or removed from an index, or massive institutional block trades can cause the indicator to spike or plummet, but the spike in volume may not be indicative of a trend
This study additionally presents
- Volume Histogram with a Volume Moving Average
- Volume Weighted Colored Bars
Other alternatives where OBV is used as source of creating indicators : RelativeStrength of VolumeIndicators , Neglected-Volume , StochX Indicator of Indicators , etc
As with most indicators however, it is best to use OBV with additional technical analysis tools
Disclaimer: Trading success is all about following your trading strategy and the indicators should fit within your trading strategy, and not to be traded upon solely
The script is for informational and educational purposes only. Use of the script does not constitutes professional and/or financial advice. You alone the sole responsibility of evaluating the script output and risks associated with the use of the script. In exchange for using the script, you agree not to hold dgtrd TradingView user liable for any possible claim for damages arising from any decision you make based on use of the script

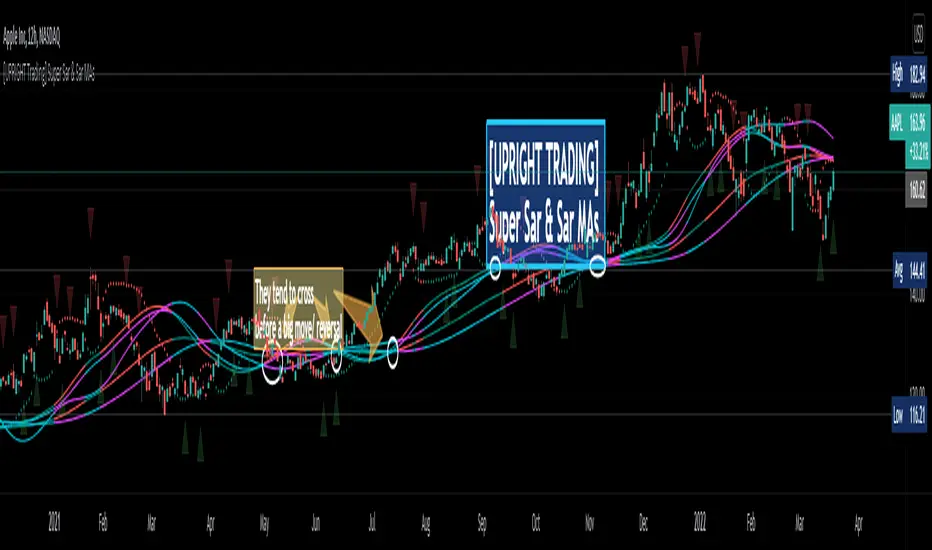
[UPRIGHT Trading] Super Sar & (New) Sar Moving Averages (cc)Hello Traders,
(This is an original creation and a proof of concept.)
As most of you know the PSAR, parabolic SAR indicator, was developed by J. Welles Wilder Jr. and used to determine trend direction and potential reversals in price. This technical indicator uses a trailing stop and reverse method, 'SAR,' or "stop and reverse," to find potential exit and entry points.
My question was: Is it possible to create meaningful Moving Averages by using PSAR?
Turns out, the answer is yes.
As you can see on the above chart, not only is it possible, it does work.
Features:
I've created buy/sell signals, which act as early indication of a potential reversal.
5 original MAs.
My Super Sar
Customizability: For now, the ability to adjust the length and turn on/off the MAs (maybe more features to come).
Enjoy!
As always, please: Like, Follow, Support, etc...
Cheers,
Mike
(UPRIGHT Trading)
TT Price/Trend IndicatorThe TT Price/Trend Indicator identifies potential trend changes and advises of safe places to set orders at retracements.
Main Signals:
When a "BUY" signal prints, it is suggested to set a buy order at the Blue trendline and wait until price retraces back.
When a "SELL" signal prints, it is suggested to set a short order at the Blue trendline and wait until price rises up.
Take Profit:
The Reactive Trendline (the thick line that switches from Green to Red, and Red to Green frequently) is good at finding local bottoms.
It is suggested to Take Profit on your Long once you see the first switch from Green to Red. If the Reactive Trendline is already Red when your LONG order is filled, wait until it goes from Red-Green-Red to Take Profit.
It is suggested to Take Profit on your Short once you see the first switch from Red to Green. If the Reactive Trendline is already Green when your SHORT order is filled, wait until it goes from Green-Red-Green to Take Profit.
Stop Loss Suggestions:
If you are LONG (BUY), set your Stop/Loss to slightly below the last Higher Low (HL)
If you are SHORT (SELL), set your Stop/Loss to slightly above the last Lower High (LH)
Alternatively, if you want to maximise your Risk:Reward ratio, you can CLOSE your order once a candle engulfs and closes over both the Blue Line AND the Grey Line. Once these levels are broken and you are underwater, the risk to hold that position is no longer worth it. However, this approach can shake you out of winning trades, so I advise you to use other strategies such as Volume, Fibonnaci and RSI etc to help you make a final decision.
Important: If you are taking this approach, don't panic sell - wait for the close of the current engulfing candle to make this decision, because quite often it will just be a wick up or down in your favour.
What are the best Strategies?
The best timeframes are as follows:
- 1 Hour
- 2 Hour
- 4 Hour
- 1 Day
- 1 Week
My Favourite is 1 Hour.
Scalping for advanced traders:
- 1 minute
- 5 minutes
If you are scalping, it is highly recommended to use the TT Volume Indicator as well, to confirm price with volume (see scripts under my profile). Price on its own will not be good enough.
I also recommend the RSI with a 14 SMA to identify Strength breakouts.
Other Features:
- VWAP (Dotted Red/Green line) - this is common liquidity and can be one of the most important Support/Resistance levels in Crypto, which is why it is included.
Can you FOMO order?
Unless you are using this with a combination of other indicators (such as the TT Volume Indicator), it is not recommended to FOMO orders at the "BUY" or "SELL" signal unless you have a clear volume breakout. Please see this explanation on FOMO ordering for further information:
