INVITE-ONLY SCRIPT
TT Price/Trend Indicator
업데이트됨
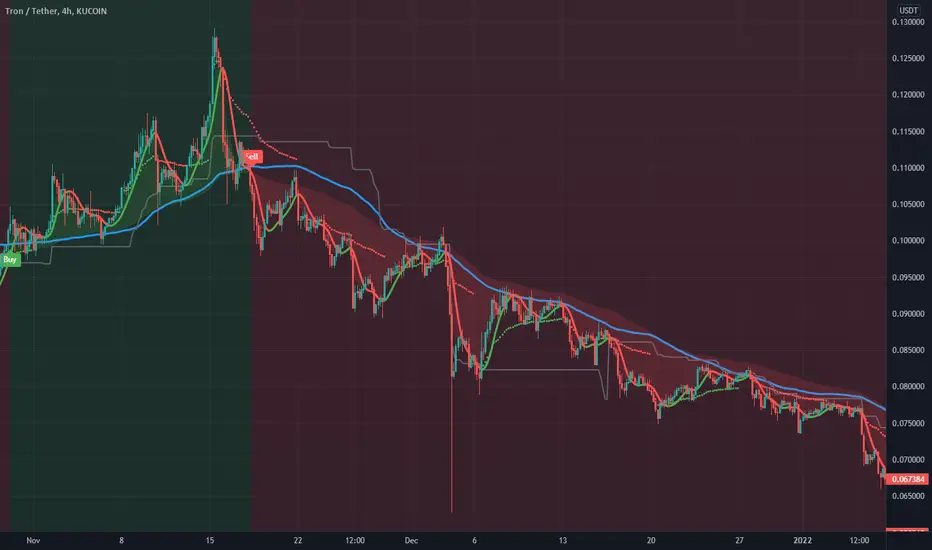
The TT Price/Trend Indicator identifies potential trend changes and advises of safe places to set orders at retracements.
Main Signals:
When a "BUY" signal prints, it is suggested to set a buy order at the Blue trendline and wait until price retraces back.
When a "SELL" signal prints, it is suggested to set a short order at the Blue trendline and wait until price rises up.
Take Profit:
The Reactive Trendline (the thick line that switches from Green to Red, and Red to Green frequently) is good at finding local bottoms.
It is suggested to Take Profit on your Long once you see the first switch from Green to Red. If the Reactive Trendline is already Red when your LONG order is filled, wait until it goes from Red-Green-Red to Take Profit.
It is suggested to Take Profit on your Short once you see the first switch from Red to Green. If the Reactive Trendline is already Green when your SHORT order is filled, wait until it goes from Green-Red-Green to Take Profit.
Stop Loss Suggestions:
If you are LONG (BUY), set your Stop/Loss to slightly below the last Higher Low (HL)
If you are SHORT (SELL), set your Stop/Loss to slightly above the last Lower High (LH)
Alternatively, if you want to maximise your Risk:Reward ratio, you can CLOSE your order once a candle engulfs and closes over both the Blue Line AND the Grey Line. Once these levels are broken and you are underwater, the risk to hold that position is no longer worth it. However, this approach can shake you out of winning trades, so I advise you to use other strategies such as Volume, Fibonnaci and RSI etc to help you make a final decision.
Important: If you are taking this approach, don't panic sell - wait for the close of the current engulfing candle to make this decision, because quite often it will just be a wick up or down in your favour.
What are the best Strategies?
The best timeframes are as follows:
- 1 Hour
- 2 Hour
- 4 Hour
- 1 Day
- 1 Week
My Favourite is 1 Hour.
Scalping for advanced traders:
- 1 minute
- 5 minutes
If you are scalping, it is highly recommended to use the TT Volume Indicator as well, to confirm price with volume (see scripts under my profile). Price on its own will not be good enough.
I also recommend the RSI with a 14 SMA to identify Strength breakouts.
Other Features:
- VWAP (Dotted Red/Green line) - this is common liquidity and can be one of the most important Support/Resistance levels in Crypto, which is why it is included.
Can you FOMO order?
Unless you are using this with a combination of other indicators (such as the TT Volume Indicator), it is not recommended to FOMO orders at the "BUY" or "SELL" signal unless you have a clear volume breakout. Please see this explanation on FOMO ordering for further information:
릴리즈 노트
Fixed colour - TradingView changed its new definition of "Blue"릴리즈 노트
Added Purple Support/Resistance Bands - these are very important long term trendlines and will be helpful for you. I will describe how to use them more in tutorials soon.초대 전용 스크립트
이 스크립트에 대한 접근은 작성자가 승인한 사용자로 제한되며, 일반적으로 지불이 필요합니다. 즐겨찾기에 추가할 수 있지만 권한을 요청하고 작성자에게 권한을 받은 후에만 사용할 수 있습니다. 자세한 내용은 reiiss7에게 문의하거나 아래의 작성자의 지시사항을 따르십시오.
트레이딩뷰는 스크립트 작성자를 100% 신뢰하고 스크립트 작동 원리를 이해하지 않는 한 스크립트 비용을 지불하고 사용하는 것을 권장하지 않습니다. 대부분의 경우 커뮤니티 스크립트에서 무료로 좋은 오픈소스 대안을 찾을 수 있습니다.
차트에 이 스크립트를 사용하시겠습니까?
경고: 액세스를 요청하기 전에 읽어 보시기 바랍니다.
면책사항
이 정보와 게시물은 TradingView에서 제공하거나 보증하는 금융, 투자, 거래 또는 기타 유형의 조언이나 권고 사항을 의미하거나 구성하지 않습니다. 자세한 내용은 이용 약관을 참고하세요.