Tolueno StrategyTolueno Strategy is a help tool for the average trader of tradingview. This tool facilitates the interpretation of entries either long or short.
The use of magic trend has been implemented, in addition to different types of ema and fully configurable signals.
Soon the use of more sophisticated support and resist will be added to be used for inputs and outputs. RR will be improved too.
The tool has alerts
The tool has a dashboard that shows current signal (LONG / SHORT), shows a recommended take profit (not mandatory), recommended stop loss (not mandatory) and the profit that the current operation is achieving, all this to help the trader and his emotions do not harm him.
The tool is constantly updated and will be gradually improved over time with feedback from tradingview users.
Any questions ask in the comment box or by pm.
This indicator is not for sale, it is not a commercial publication.
Signal

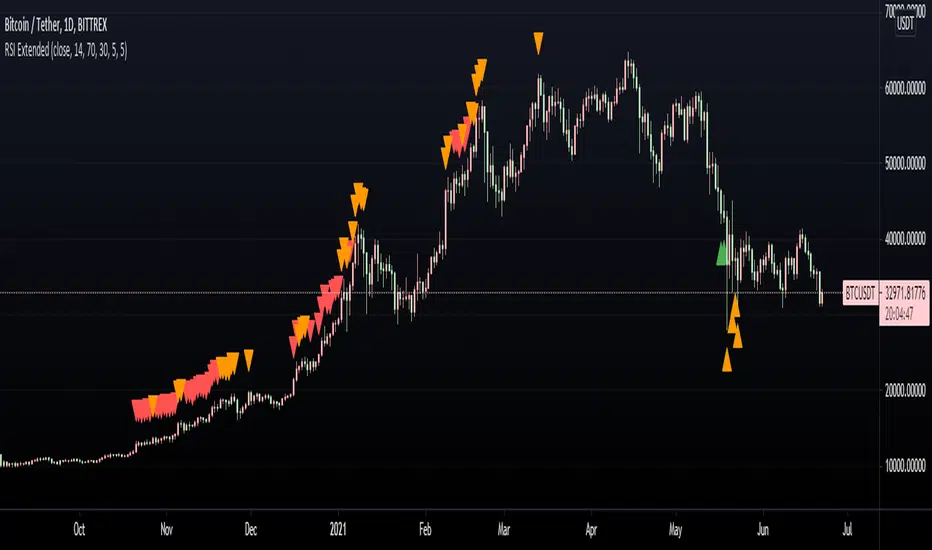
RSI ExtendedThis script is intended to print signals on the main price chart and send alerts when the RSI is overbought or oversold.
You can customize the source of the signal (open, close, etc), as well as oversold/overbought levels, and RSI length.
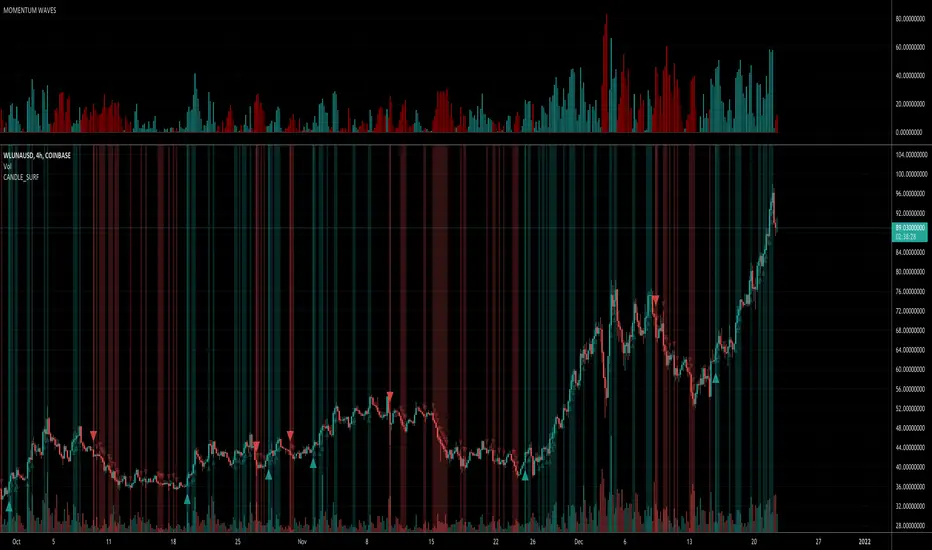
Candle Surf SignalThis script works very well for all assets across various timeframe charts. Good for use with scalping, long term swings, or in combination with multi-timeframe trading.
Surf the candles!
4H Crypto RoycerThis indicator includes simple moving averages (21,50,200) and exponential moving averages (10,144) and has the ability to show this data on the chart with the approval of the user.
The indicator, which controls the intersections with the formulas it contains, can display the Golden Cross and Death Cross warnings to the user on the chart.
It draws a band on the chart with the support area calculations and in these band calculations; blends simple moving and exponential moving averages and smooths them by 1.5%.
It is used as a signal trigger in band overruns by replacing the lower and upper bands by calculation.
While one of our signal triggers is this band, our other variable is 50 simple moving averages.
Inspired by Kıvanç Özbilgiç's Supertrend indicator, the formula was updated using MA50 and 15% Stop-Loss instead of using atr multiplier.
Our chart has been tested in crypto currencies on 4 hour candles, so "4H" has been added to the beginning of the name.
We recommend using the indicator, buy / sell signals and the support band on the 4-hour charts.

Jaws Mean Reversion [Strategy]This very simple strategy is an implementation of PJ Sutherlands' Jaws Mean reversion algorithm. It simply buys when a small moving average period (e.g. 2) is below
a longer moving average period (e.g. 5) by a certain percentage and closes when the small period average crosses over the longer moving average.
If you are going to use this, you may wish to apply this to a range of investment assets using a screener for setups, as the amount signals are low. Alternatively, you may wish to tweak the settings to provide more signals.
Context can be found here:
LINK

ALT SeasonALT season shows a bullish crypto market when BTC is less profitable than Altcoins.
Therefore, traders can sell their BTC and buy Altcoins to gain more profit. Having an indicator that shows Alt season can be very useful.
To use this tool, you need two coins:
1- Main coin like BTC (you may use TOTAL or ETH, BCH)
2- Alt coin like TOTAL2 (you may use any coin rather than BTC and TOTAL)
Lets say we want to exchange Tron (TRX) with BTC or ETH.
Many Brokers (like Binance, CoinBase, ...) let us to trade TRX/BTC and TRX/ETH.
For example, if you have ETH and ETH market is sideways. Then you may sell ETH and buy TRX. To see wether this exchange is profitable, you can set main coin to ETH/USDT and alt coin to TRX/USDT.
The gray bars shows Alt season and buy opportunity in Alt coin markets.
You may leave a like if you find this script useful.

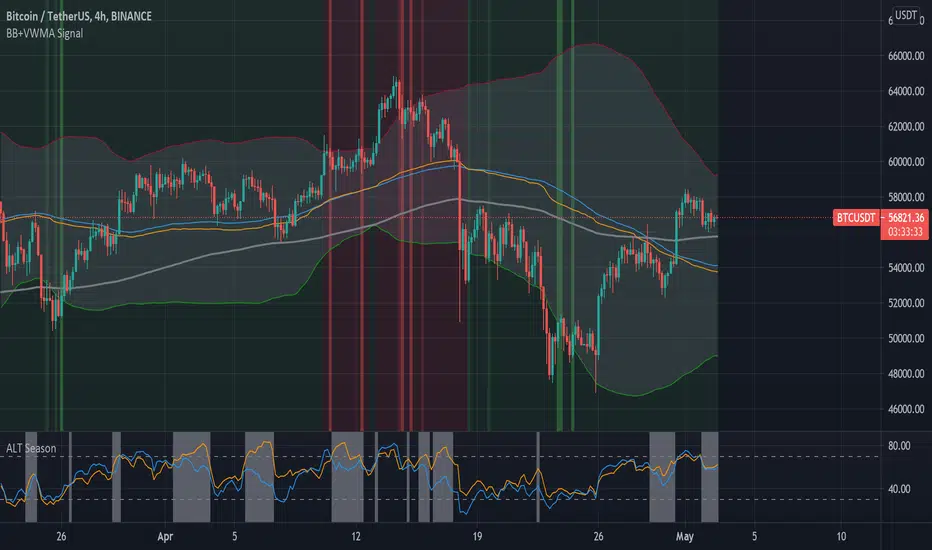
Bollinger Bands + VWMA SignalIn this tool we can use Bollinger bands together with VWMA (volume weighted moving average) and Buy/Sell signals.
Red lines shows sell opportunities and green lines shows buy opportunities.
Sell and buy opportunities are deducted based on two moving average: (base MA) and VWMA.
This tool works in any time frames, but 4H is recommend.
The base moving average is set to 89 (in 4H) and you can change it to any values like (13, 21, 34, 55, 89, 144, ...).
The long(200) moving average can be used as a trend indicator, as well as support and resistance.
You may leave a like of you find it useful.
Fibodex TrapFibodex Trap indicator
this indicator designed by the Fibodex team
you will receive dump and bump singles buy using this indicator
also, you will receive buy and sell signals
indeed by using our indicator you won't need many technical analyses
The accuracy of the indicator with the correct settings is estimated to be more than 70%
also, we are trying to improve it to make it more accurate
notice that this indicator should be used as a secondary tool
By using this indicator, you also accept the risk of using it.
--------------------------------------------------------------------------------------------------------------------------------------------------------------------------------------------------------------------------------------------------------------------------------------------------------
اندیکاتور تله توسط مجموعه فیبودکس ایده پردازی و کد نویسی شده است.
شما با این اندیکاتور قادر خواهید بود تا سیگنال های پامپ و دامپ و همچنین خرید و فروش را دریافت نمایید.
دقت اندیکاتور با تنظیمات صحیح بیش از 70 درصد تخمین زده شده است که مجموعه فیبودکس در جهت بهبود و افزایش دقت آن تلاش خواهد کرد.
به یاد داشته باشید که از این اندیکاتور به عنوان کمکی و دریافت تاییده کمک بگیرید .
شما با استفاده از این اندیکاتور ریسک استفاده از آن را هم می پذیرید

72s Strat: Backtesting Adaptive HMA+ pt.1This is a follow up to my previous publication of Adaptive HMA+ few months ago, as a mean to provide some kind of initial backtesting tools. Which can be use to explore many possible strategies, optimise its settings to better conform user's pair/tf, and hopefully able to help tweaking your general strategy.
If you haven't read the study or use the indicator, kindly go here first to get the overall idea.
The first strategy introduce in this backtest is one most basic already described in the study; buy/sell is when movement is there and everything is on the right side; When RSI has turned to other side, we can use it as exit point (if in profit of course, else just let it hit our TP/SL, why would we exit before profit). Also, base on RSI when we make entry, we can further differentiate type of signals. --Please check all comments in code directly where the signals , entries , and exits section are.
Second additional strategy to check; is when we also use second faster Adaptive HMA+ for exit. So this is like a double orders on a signal but with different exit-rule (/more on this on snapshots below). Alternatively, you can also work the code so to only use this type of exit.
There's also an additional feature which you can enable its visuals, the Distance Zone , is to help measuring price distance to our xHMA+. It's just a simple atr based envelope really, I already put the sample code in study's comment section, but better gonna update it there directly for non-coder too, after this.
In this sample I use Lot for order quantity size just because that's what I use on my broker. Also what few friends use while we forward-testing it since the study is published, so we also checked/compared each profit/loss report by real number. To use default or other unit of measurement, change the entry code accordingly.
If you change your order size, you should also change the commission in Properties Tab. My broker commission is 5 USD per order/lot, so in there with example order size 0.1 lot I put commission 0.5$ per order (I'll put 2.5$ for 0.5 lot, 10$ for 2 lot, and so on). Crypto usually has higher charge. --It is important that you should fill it base on your broker.
SETTINGS
I'm trying to keep it short. Please explore it further again. (Beginner should also first get acquaintance with terms use here.)
ORDERS:
Base Minimum Profit Before Exit:
The number is multiplier of ongoing ATR. Means that when basic exit condition is met, algo will check whether you're already in minimum profit or not, if not, let it still run to TP or SL, or until it meets subsequent exit condition, then it will check again.
Default Target Profit:
Multiplier of ATR at signal. If reached before any eligible exit condition is met, exit TP.
Base StopLoss Point:
You can change directly in code to use other like ATR Trailing SL, fix percent SL, or whatever. In the sample, 4 options provided.
Maximum StopLoss:
This is like a safety-net, that if at some point your chosen SL point from input above happens to be exceeding this maximum input that you can tolerate, then this max point is the one will be use as SL.
Activate 2nd order...:
The additional doubling of certain buy/sell with different exits as described above. If enable, you should also set pyramiding to at least: 2. If not, it does nothing.
ADAPTIVE HMA+ PERIOD
Many users already have their own settings for these. So in here I only sample the default as first presented in the study. Make it to your adaptive.
MARKET MOVEMENT
(1) Now you can check in realtime how much slope degree is best to define your specific pair/tf is out of congestion (yellow) area. And (2) also able to check directly what ATR lengths are more suitable defining your pair's volatility.
DISTANCE ZONE
Distance Multiplier. Each pair/tf has its own best distance zone (in xHMA+ perspective). The zone also determine whether a signal should appear or not. (Or what type of signal, if you wanna go more detail in constructing your strategy)
USAGE
(Provided you already have your own comfortable settings for minimum-maximum period of Adaptive HMA+. Best if you already have backtested it manually too and/or apply as an add-on to your working strategy)
1. In our experiences, first most important to define is both elements in the Market Movement Settings . These also tend to be persistent for whole season since it's kinda describing that pair/tf overall behaviour. Don't worry if you still get a low Profit Factor here, but by tweaking you should start to see positive changes in one of Max Drawdown and Net Profit, or Percent Profitable.
2. Afterwards, find your pair/tf Distance Zone . When optimising this, what we seek is just a "not to bad" equity curves to start forming. At least Max Drawdown should lessen more. Doesn't have to be great already, but should be better, no red in Net Profit.
3. Then go manage the "Trailing Minimum Profit", TP, SL, and max SL.
4. Repeat 1,2,3. 👻
5. Manage order size, commission, and/or enable double-order (need pyramiding) if you like. Check if your equity can handle max drawdown before margin call.
6. After getting an acceptable backtest result, go to List of Trades tab and find the biggest loss or when many sequencing loss in a row happened. Click on it to go to exact point on chart, observe why the signal failed and get at least general idea how it can be prevented . The rest is yours, you should know your pair/tf more than other.
You can also re-explore your minimum-maximum period for both Major and minor xHMA+.
Keep in mind that all numbers in Setting are conceptually in a form of range . You don't want to get superb equity curves but actually a "fragile" , means one can easily turn it to disaster just by changing only a fraction in one/two of the setting.
---
If you just wanna test the strength of the indicator alone, you can disable "Use StopLoss" temporarily while optimising settings.
Using no SL might be tempting in overall result data in some cases, but NOTE: It is not recommended to not using SL, don't forget that we deliberately enter when it's in high volatility. If want to add flexibility or trading for long-term, just maximise your SL. ie.: chose SL Point>ATR only and set it maximum. (Check your max drawdown after this).
I think this is quite important specially for beginners, so here's an example; Hypothetically in below scenario, because of some settings, the buy order after the loss sell signal didn't appear. Let's say if our initial capital only 1000$ using leverage and order size 0,5 lot (risky position sizing already), moreover if this happens at the beginning of your trading season, that's half of account gone already in one trade . Your max SL should've made you exit after that pumping bar.
The Trailing Minimum Profit is actually look like this. Search in the code if you want to plot it. I just don't like too many lines on chart.
To maximise profit we can try enabling double-order. The only added rule coded is: RSI should rising when buy and falling when sell. 2nd signal will appears above or below default buy/sell signal. (Of course it's also prone to double-loss, re-check your max drawdown after. Profit factor play its part in here for a long run). Snapshot in comparison:
Two default sell signals on left closed at RSI exit, the additional sell signal closed later on when price crossover minor xHMA+. On buy side, price haven't met our minimum profit when first crossunder minor xHMA+. If later on we hit SL on this "+buy" signal, at least we already profited from default buy signal. You can also consider/treat this as multiple TP points.
For longer-term trading, what you need to maximise is the Minimum Profit , so it won't exit whenever an exit condition happened, it can happen several times before reaching minimum profit. Hopefully this snapshot can explain:
Notice in comparison default sell and buy signal now close in average after 3 days. What's best is when we also have confirmation from higher TF. It's like targeting higher TF by entering from smaller TF.
As also mention in the study, we can still experiment via original HMA by putting same value for minimum-maximum period setting. This is experimental EU 1H with Major xHMA+: 144-144, Flat market 13, Distance multiplier 3.6, with 2nd order activated.
Kiwi was a bit surprising for me. It's flat market is effectively below 6, with quite far distance zone of 3.5. Probably because I'm using big numbers in adaptive period.
---
The result you see in strategy tester report below for EURUSD 15m is using just default settings you see in code, as follow:
0,1 lot for each order (which is the smallest allowed by my broker).
No pyramiding. Commission: 0.5 usd per order. Slippage: 3
Opening position is only using basic strategy #1 (RSI exit). Additional exit not activated.
Minimum Profit: 1. TP: 3.
SL use: Half-distance zone. Max SL: 4.5.
Major xHMA+: 172-233. minor xHMA+: 89-121
Distance Zone Multiplier: 2.7
RSI: Standard 14.
(From our forward-testing, the difference we get from net profit is because of the spread, our entry isn't exactly at the close/open price. Not so much though, but not the same. If somebody can direct me to any example where we can code our entry via current bid/ask price, that would be awesome!)
It's already a long post (sorry), think I'm gonna pause here. Check out the code :)
---
DISCLAIMER: Past performance is no guarantee of future results , and so on.. you know the drill ;)
Please read whole description first before using, don't take 1-2 paragraph and claim it's the whole logic, you are responsible of your own actions and understanding.

NVME Vanquisher X"Enter with precision, focus on the mission, dismiss the indecision, support NVME's vision" ~ That is what the Vanquisher X will provide.
One may ask, what is so unique about it compared to other algorithms?
We have our own calculation module and strategy that uses other indicators and maths to determine the next location of the trend and with our algorithm you can have full customisation of all the features we have. You can change the overall colour scheme of every single plot within the indicator, you can change the algorithms sensitivity and scalar to as many different numbers as possible, there are helpful drawings, trend confirming drawings, pullback drawings, pair mark-ups, custom dashboards and much more. Our settings panel is also simple and easy to use providing you with different appropriately named subsections for each feature and there are tooltips to let you know what each tab or input does. So, traders if that doesn't get you hooked then keeping reading!
Traders commonly struggle to decide whether or not to enter a trade, hold a trade, stop a trade or take profit and that is what makes us different. You stop when you see the opposite signal or a change in candle colour, you can follow our automatic TP and SL levels for trade goals and you enter when a signal meets your analysis.
NVME Vanquisher X is to be used as confluence with your analysis or trading style and should not in anyway shape or form be used as a indication to buy or sell just because the signal says so, it is there to give you a higher chance of having a high probability trade though past results is not indicative of future results and getting access doesn't mean you will become a millionaire in a day as it is not a get rich quick indicator so it won't guarantee 100% success.
What is your goal?
Our goal is to give you traders an edge in trading, whether it be for stocks, indices, cryptos, forex, commodities, futures and altcoins, all assets are supported and we want to make the best of every trader with NVME.
Recommended Timeframes:
15 Minutes, 1 Hour, 4 Hour with our settings of 2 or 3 sensitivity and 144 on the algo scalar.
Does it support all chart types?
Yes, all charts supported, however we recommend Heikin-Ashi as an optimal choice for trading but if you are already experienced with something else then you can use that :)
Screenshots:
Features:
/Trend Confirming Drawings:
-200 EMA (Added so that free users don't have to waste 1 indicator space)
-Trend Cloud (Colour switches from negative to positive depending on the trend and the cloud has a low fill opacity)
-Confirmation Highlight (Highlights the background with a positive or negative colour depending on the trend identified)
-Following Highlight (Unique highlighting to the background that shows either a positive or negative colour based on the trend however it doesn't identify ranging markets)
//Combinations//
-TC+EMA, EMA+Highlight, Cloud+Highlight, FH+EMA, FH+CLOUD, All v1 (EMA+CLOUD+CH), All v2 (EMA+CLOUD+FH)
/Helpful Drawings:
-Predictive Channel (Using candle maths, this will plot a price following linear regression channel that can be useful for breakout trading or using as support and resistance)
-Predictive S/R (Using candle maths and validation, this will plot support and resistance zones across the market to show you different areas where price could reject or reverse)
-Predictive Trend-Lines (Using candle maths and EMA, this will plot a trend-line in the direction of the trend and this can be useful for breakout trading or following the trend)
-Predictive Supply and Demand Highlight (Using other indicators, this will plot a highlight filled plot that will outline areas of supply and demand, which can be useful for support and resistance trading)
-Previous Order Blocks (Using candle maths, validation and confirmation latency, this will plot filled in squares of potential orders blocks from the past so they can be used for future reference in analysis)
-Predictive ZigZag (Using candle maths, this will plot a price following line that forms a zig zag pattern to show if the market is going in a higher high and higher low formation or lower low and lower high formation)
-Predictive Pivot-Points (Using candle maths and higher-timeframe data, this will plot pivot zones up to support 5 and resistance 5 with midpoints for every section there is)
/Pullback Drawings:
-EMA Pullback (Added so that free users don't have to waste 1 indicator space)
-Bollinger Heatbands (Using the Bollinger Bands indicator, we have created a price following support and resistance heat-map that shows you the whereabouts of the dynamic support and resistance that is indicator based)
-EMA+HB (This combines the ema and the heatbands)
-Fib Retracements (This feature will automatically plot a fibonacci retracement based off predictive market data and our own optimal settings so that you don't need to change them)
/Pair Mark-Ups:
-Weekly Info (This will show you the previous lows and high of the weekly candle and using an ATR, we have added potential reversal zones in those areas and we have a midpoint too)
-Daily Info (Same as the weekly info but for the daily timeframe)
-4 Hr Info (Same as the weekly info but for the 4 hourly timeframe)
/Colour Schemes:
-Default (Strong green, dark purple, strong red)
-Blue and Orange
-Strawberry and Lime
-Apple and Mango
-Orange Passionfruit
-Rhubarb and Custard
-Black and White
-Forest Greens
-Galaxy
-No Colour Scheme (removes the preset colours so they are the same as your TradingView bar settings)
-Show ATR TP and SL levels (This will plot 4 lines, 3 lines are the take profit levels, and the 4th line is the stop loss line, since it is atr based it may fluctuate the distance between each line indicating possible liquidity)
/Dashboard Settings
-High (Will place the dashboard's Y position to follow the high of the price)
-Middle (Will place the dashboard's Y position to the difference of the lowest low and highest high)
-Forced Middle (Will place the dashboard's Y position to the difference of the lowest low further back and highest high further back)
-Low (Will place the dashboard's Y position to follow the low of the price)
-No Dashboard (Deletes the dashboard from the charts)
-Dashboard's X position (Input field, this will change the X value, the higher it is the further away it is from price and the lower it is the closer the dashboard is towards price)
/Dashboard W/R Goals:
-Adaptive (Randomly chooses a strategy follow, can be highly inaccurate, and when price hits tp 1 it will add a win and if it hits sl it will count as a loss)
-5 Pips to 5 Pips (This will change the calculator to only add values for this set condition and this won't be strategy based but instead signal based)
-5 Pips to 10 Pips (1:2 Risk Reward)
-10 Pips to 20 Pips (1:2 Risk Reward, Higher Stop and TP)
-10 Pips to 30 Pips (1:3 Risk Reward, Higher Stop and TP)
-20 Pips to 40 Pips (1:2 Risk Reward, Higher Stop and TP)
/Dashboard Add-ons:
-MTF Trends (This will add more text onto the dashboard and this will show you the trends of the higher timeframes)
-EMA (This will show you the EMA trends on the dashboard)
-VWMA (This will show you the VWMA trends on the dashboard)
-HMA (This will show you the HMA trends on the dashboard)
-Text Colour (This is a colour input and this allows you to change the colour of the dashboard to anything you like)
/Customisable Alerts:
-Buy Alerts (This will allow buy alerts to be sent through any TradingView notifications)
-Sell Alerts (This will allow sell alerts to be sent through any TradingView notifications)
-Range to Uptrend (May be buggy, this will send an alert if the colour goes from undecided to an uptrend colour (positive colour))
-Range to Downtrend (May be buggy, this will send an alert if the colour goes from undecided to a downtrend colour (negative colour))
-Previous Bullish Order Block (This will send an alert if a previous bullish order block has been printed to help with your analysis)
-Previous Bearish Order Block (This will send an alert if a previous bearish order block has been printed to help with your analysis)

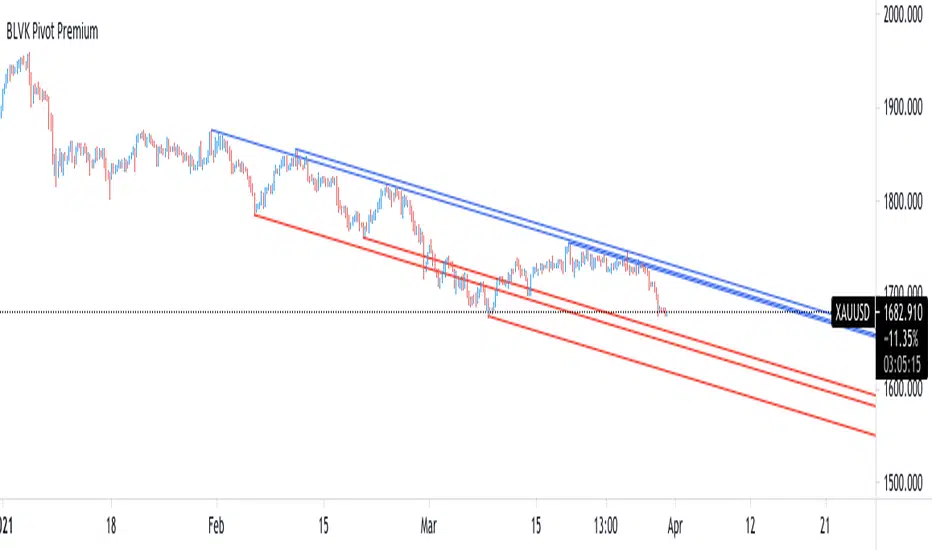
BLVK Pivot PremiumDisplays lines connecting past pivot high/low points with each line having the slope of a linear regression . This slope can also be controlled by the user with the 'Slope' setting. Each line can be used as a support or resistance by the user.
Settings
Length : Pivot length. Use higher values for having lines connected to more significant pivots points.
Lookback : Number of lines connecting a pivot high/low to display, with a total of lines equal to Lookback*2
Slope : Allows the user to multiply the linear regression slope by a number within -1 and 1
Limitations
The script has currently several real time behavior limitations. Lines are displayed retrospectively and will not update with the arrival of new bars. Readjusting the indicator to newer pivots will require the user to either hide/unhide the indicator or change its settings.
High Length or Lookback values might not return any lines if the location of a pivot point is outside the defined buffer size of the indicator (set as 5000 bars).
How To Use
The indicator can be used to get supports and resistances and is more so closer to a drawing tool due to its limitations. The lines not updating with the arrival of new bars have the advantage of providing fixed supports/resistances.
The Slope setting allows the user to control the angle and direction of the lines. Using a Slope of 1 will return lines with the same slope as the one of a linear regression fit from the farthest pivot point displayed by the indicator to the most recent bar.
Conclusion
We hope you like this indicator (drawing tool) and find it useful for drawing your support & resistances in a unique way!
MA Cross Ribbon + [RSI,StochRSI,VolOsc,RoC,Compare,Info Panel]
Draws all sorts of useful information directly onto the Chart
Moving Average Ribbon with configurable offsets
Allows you to easily visualize MA Crossovers
Easy to view in the Data Window
RSI Indicator (Overbought, Oversold, Healthy)
Stochastic RSI
Volume Oscillator (Bullish, Bearish, Healthy)
Rate of Change Indicator
Compare Symbol without adding a new scale (Symbol, Timeframe, Divider)
Moving the chart around won't ruin your comparison
Allows you to see the general sentiment of all your configured averages at a glance
100% Configurable
If there is anything you would like added please comment, It's very likely I will be adding more things to this.

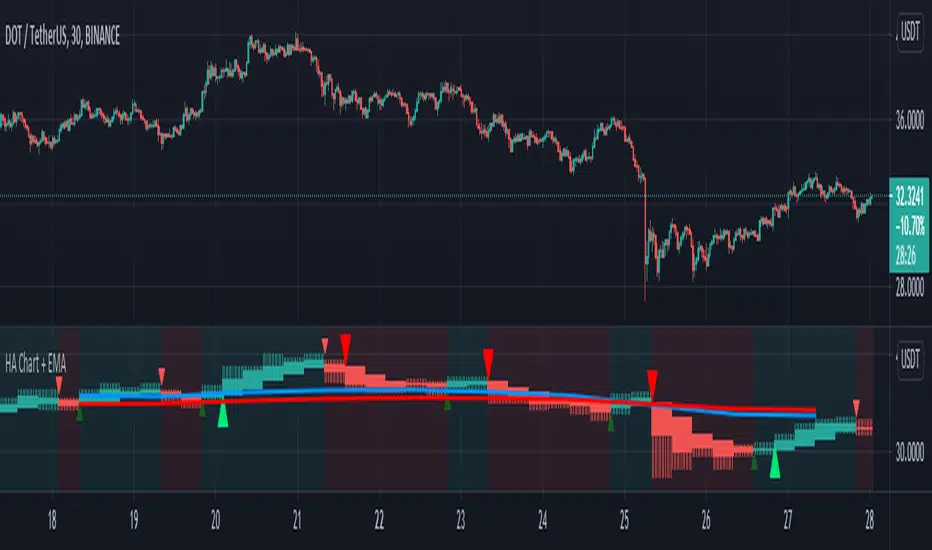
HA Chart with two EMA Trends and Signal Alert by GodtrixHi guys, how ya doing!
Benefits:
1) This tool is to add convenience of viewing HA chart at the same time with your main candle chart at different timeframe (resolution), so you save energy from switching between the candles and timeframe.
2) It comes with two seperate EMA:
a) 1day EMA trend lines set at length 10 & 20, this is the best setting ever for seeing long term trend.
-> Bull Trend - Blue line (10) above Red line (20) AND the same time price candle is above the Red line
-> Bear Trend - Red line (20) above Blue line (10) AND the same time price candle is below the Blue line
b) 2nd EMA trend lines for your own preference and conveniences. I use it at 2 hour timeframe, to help me decide for Entry/Exit orders, works great for me.
3) Provided with Singal Alert for Buy Sell Entry & Exit (This is not strategy, please study history and do your own calculation before following the Alert Signals)
There is two choices:
-> Normal Crossover - it simply alert you going from Red to Green or Green to Red candle
-> Strong Crossover with short Tail - This is a better version that checks on the candle size, tail size and body (open-close) size
If you want a complete Strategy, please go over to my script section, I've also published Strategy tool.
COINBASE:BTCUSD COINBASE:ETHUSD

Follow Line Trend SignalThis Script is a Trend Following system built over the concepts of normalising ATR over Bollinger Bands and Pivot points high low,
This Script Can be used over AnyTimeframe
and Can be treated as a stable alternative to Supertrend
Script has provisions for BUY and SELL Alerts
Enjoy!

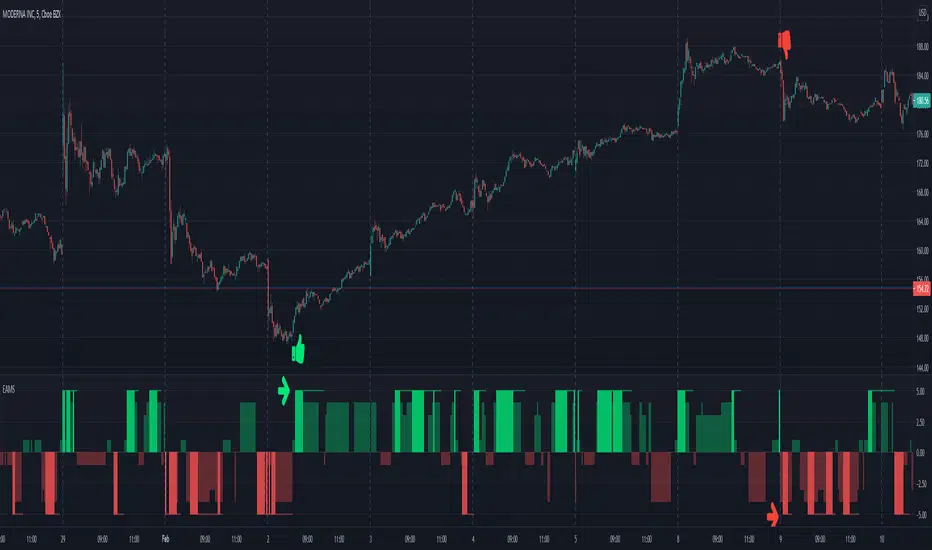
Electrified Aggressive Momentum SignalWhat this can be used for:
If you've already decided you want to trade a symbol, this can identify points of momentum alignment.
If a strong move has recently happened and you're looking for a change in momentum.
How it works:
This is a weighted combination of a Stochastic RSI and two modified SuperTrend (ATR Trailing Stop) indicators:
The Stochastic RSI signal is based upon aligned momentum and is negated at the overbought and oversold points.
The SuperTrend formula uses high and low values for calculation and both fast and slow can be adjusted for sensitivity.
Philosophy:
Signals have to be useful to humans. If a signal occurs to late, you've missed it. The intent of this indicator is to assist in timing a trade at very short time-frames. It assumes your conviction about a trade already exists, but you are trying to get an optimal entry.
Opposing momentum (weak signal) within an uptrend can be a sign that you should wait before entering. The frequency of a signal can indicate the strength of the trend. As the frequency of the aligned signal value decreases so does the reward vs risk.
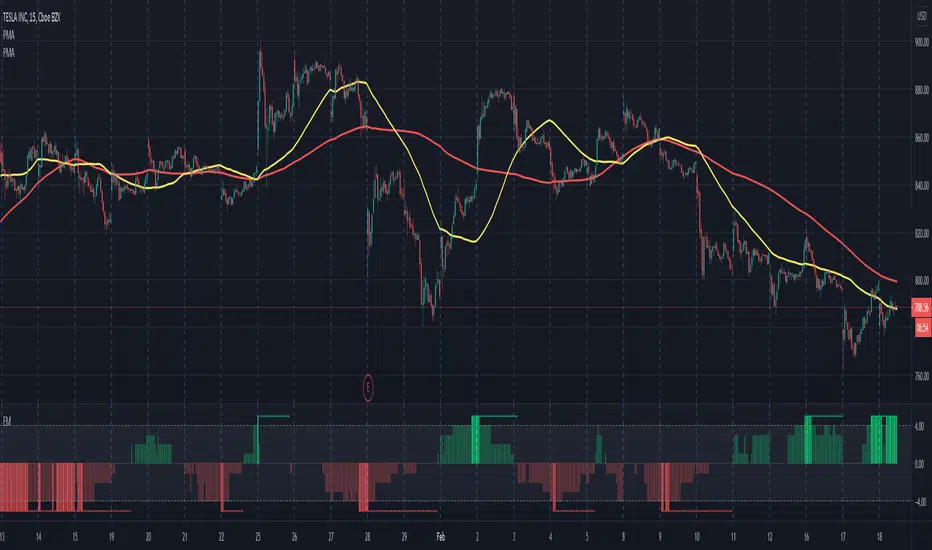
Electrified Momentum Signal (Prototype)This indicator uses an ensemble of different indicators to help in identifying significant changes in momentum.
It's time-frame is constant and is based up on the length of the configurable period. This allows for a consistent signal across multiple time-frames.
This is not a buy or sell signal but can be used for alerts to indicate a change in momentum that might be worth paying attention to.
If looking for an long entry point, a negative (red) value can signal "don't buy yet" or may simple mean "it's risky". In a similar way if looking for a short, a positive (green) value can signal "not now".
Note: "Electrified" does not mean this has anything to do with electric vehicles or the power grid. :P
Stochastic RSI+Applies signal values to significant changes in momentum and can be used in conjunction with other indicators and analysis to improve trade timing.
Both "Signal Up" and "Signal Down" can be used for alerts.
The magnitude of the signal is the difference between K and D.
(See the code for the logic and implementation.)
Signal Up occurs when momentum is within the band and moving upward.
Signal Down occurs when momentum is within the band and moving downward.
Interpretation Note:
The Stochastic RSI is known for false signals, so it should never be used as a pure buy or sell signal. It is useful as a warning or to help with trade timing.
A good example of this is: If you are bullish on a stock, and the signal is negative (signal down), then it may be wise to not buy until the recent change in momentum has dissipated.

Local Limit AlignmentCombines the trends of multiple local limits to provide a signal that represents how strongly they are aligned.
Each local limit has a value of either +1 or -1. The sum of all depths provides a signal.
The defaults are a minimum depth of 2 and a maximum of 4 resulting in upper and lower values between -3 and +3, and a total between -6 and +6.


[FTA] Double Responsive Price FilterThis is a very special indicator which uses a series of double filtering methods to filter out bad price data.
Each filter uses a very complex mathematical formula to obtain the data, based on the Wave Function, then applies initial signal filtering on the output.
The output of each filter is then compared to each other, and the output of this stage goes through another signal filtering process which is used in aviation industry (NASA) to track objects and keep them under radar!
The final output is then squeezed through a truncated bandpass filter and plotted as two colors.
This is to ensure a very quick and responsive entry and exit signal without any lagging, and also to ensure that the trader stays in the trade as long as profitable!
Buy when color is aqua.
Sell when color is fuchsia.

Pip collector ModThis modification of LazyBear's popular script called Pip collector features custom signal generation and information section displaying elapsed bar time useful for timing trades.

Ichimoku Kinko Hyo SignalsIchimoku Kinko Hyo Signals
This script show signals based on my understanding in Ichimoku Kinko Hyo.
/!\ Please do not follow signals blindly and always make your own analysis /!\
Buy : Han Ne lines are up, price is up, and also stochastic (K=30, D=10) is up
Strong Buy : Is a Sanyaku Kouten and can show a potential reverse in current tendance and Buy Signal conditions
Sell : Han Ne lines are down, price is down, and also stochastic (K=30, D=10) is down
Strong Sell : Is a Sanyaku Gyakuten and can show a potential reverse in current tendance and Sell Signal conditions
Exit : Show a potential time to take profit based on previous Sell, Strong Sell, Buy, or Strong Buy signal
