Supply and Demand Zones [BigBeluga]🔵 OVERVIEW
The Supply and Demand Zones indicator automatically identifies institutional order zones formed by high-volume price movements. It detects aggressive buying or selling events and marks the origin of these moves as demand or supply zones. Untested zones are plotted with thick solid borders, while tested zones become dashed, signaling reduced strength.
🔵 CONCEPTS
Supply Zones: Identified when 3 or more bearish candles form consecutively with above-average volume. The script then searches up to 5 bars back to find the last bullish candle and plots a supply zone from that candle’s low to its low plus ATR.
Demand Zones: Detected when 3 or more bullish candles appear with above-average volume. The script looks up to 5 bars back for a bearish candle and plots a demand zone from its high to its high minus ATR.
Volume Weighting: Each zone displays the cumulative bullish or bearish volume within the move leading to the zone.
Tested Zones: If price re-enters a zone and touches its boundary after being extended for 15 bars, the zone becomes dashed , indicating a potential weakening of that level.
Overlap Logic: Older overlapping zones are removed automatically to keep the chart clean and only show the most relevant supply/demand levels.
Zone Expiry: Zones are also deleted after they’re fully broken by price (i.e., price closes above supply or below demand).
🔵 FEATURES
Auto-detects supply and demand using volume and candle structure.
Extends valid zones to the right side of the chart.
Solid borders for fresh untested zones.
Dashed borders for tested zones (after 15 bars and contact).
Prevents overlapping zones of the same type.
Labels each zone with volume delta collected during zone formation.
Limits to 5 zones of each type for clarity.
Fully customizable supply and demand zone colors.
🔵 HOW TO USE
Use supply zones as potential resistance levels where sell-side pressure could emerge.
Use demand zones as potential support areas where buyers might step in again.
Pay attention to whether a zone is solid (untested) or dashed (tested).
Combine with other confluences like volume spikes, trend direction, or candlestick patterns.
Ideal for swing traders and scalpers identifying key reaction levels.
🔵 CONCLUSION
Supply and Demand Zones is a clean and logic-driven tool that visualizes critical liquidity zones formed by institutional moves. It tracks untested and tested levels, giving traders a visual edge to recognize where price might bounce or reverse due to historical order flow.
Sentiment

EMA Slope Angle V2 Auto Threshold# EMA Slope Angle Indicator
## Overview
The EMA Slope Angle Indicator visualizes the Exponential Moving Average (EMA) slope as an angle in degrees, providing traders with a clear, quantitative measure of trend strength and direction. The indicator features **automatic threshold calculation based on Gaussian distribution**, making it adaptive to any market and timeframe.
## Key Features
### 🎯 **Automatic Threshold Calculation (NEW!)**
- **Gaussian Distribution-Based**: Automatically calculates optimal thresholds from the 50% interquartile range (IQR) of historical angle data
- **Asset-Adaptive**: Thresholds adjust to each instrument's unique volatility and price characteristics
- **No Manual Tuning Required**: Simply enable "Use Auto Thresholds" and let the indicator optimize itself
### 📊 **Dynamic EMA Coloring**
- **Color Intensity**: EMA line color intensity reflects slope strength
- **Visual Feedback**:
- Green shades for uptrends (darker = stronger)
- Red shades for downtrends (darker = stronger)
- Gray for flat/neutral conditions
### 📈 **Regime Detection**
- **Three Regimes**: RISING, FALLING, and FLAT
- **Smart Classification**: Based on statistical distribution of angles
- **Non-Repainting**: All calculations use confirmed bars only
### 🔔 **Trend-Shift Signals**
- **Visual Arrows**: Automatic signals when transitioning from FLAT to RISING/FALLING
- **Configurable**: Enable/disable signals as needed
- **Reliable**: Only triggers on significant regime changes
### 📋 **KPI Dashboard**
- **Real-Time Metrics**: Current angle, regime, and last signal
- **Auto-Threshold Display**: Shows calculated thresholds when auto-mode is active
- **Statistics**: Optional angle distribution statistics
- **Clean Layout**: Top-right corner, non-intrusive
### 📊 **Angle Statistics (Optional)**
- **Distribution Analysis**: Histogram of angle ranges
- **Dynamic Buckets**: Automatically adjusts to data distribution when auto-mode is enabled
- **Percentage Breakdown**: See how often each angle range occurs
## Settings
### Main Settings
- **EMA Length**: Period for the Exponential Moving Average (default: 50)
- **Slope Lookback Bars**: Number of bars to calculate slope over (default: 5)
### Angle Settings
- **Use Auto Thresholds**: Enable automatic threshold calculation (recommended!)
- **Analysis Period**: Number of bars to analyze for distribution (default: 500)
- **Manual Thresholds**: Flat, Rising, and Falling triggers (used when auto-mode is off)
- **Max Angle for Color Saturation**: Maximum angle for color intensity scaling
### Display Options
- **Colors**: Customize uptrend, downtrend, and flat colors
- **Show Signals**: Enable/disable trend-shift arrows
- **Show Statistics**: Display angle distribution table
- **Show Dashboard**: Toggle KPI dashboard visibility
## How It Works
### Angle Calculation
The indicator calculates the angle between the current EMA value and the EMA value N bars ago:
```
Angle = arctan((EMA_now - EMA_then) / lookback) × 180° / π
```
### Auto-Threshold Calculation
When enabled, the indicator:
1. Analyzes historical angle data over the specified period
2. Calculates mean and standard deviation
3. Determines thresholds based on the 50% interquartile range (IQR):
- **Flat Threshold**: ±0.674σ (middle 50% of data)
- **Rising Trigger**: 75th percentile (mean + 0.674σ)
- **Falling Trigger**: 25th percentile (mean - 0.674σ)
### Regime Classification
- **FLAT**: Angle within ±Flat Threshold
- **RISING**: Angle ≥ Rising Trigger
- **FALLING**: Angle ≤ Falling Trigger
## Use Cases
### Trend Following
- Identify strong trends (high angle values)
- Spot trend reversals (regime changes)
- Filter trades based on trend strength
### Range Trading
- Detect flat/consolidation periods
- Avoid trading during choppy markets
- Enter when regime shifts from FLAT to RISING/FALLING
### Multi-Timeframe Analysis
- Apply to different timeframes for confirmation
- Use higher timeframe for trend direction
- Use lower timeframe for entry timing
## Tips for Best Results
1. **Enable Auto-Thresholds**: Let the indicator adapt to your instrument
2. **Adjust Analysis Period**: Use more bars for stable markets, fewer for volatile ones
3. **Combine with Price Action**: Use regime changes as confirmation, not standalone signals
4. **Multi-Timeframe**: Check higher timeframes for trend context
5. **Backtest First**: Test settings on historical data before live trading
## Technical Details
- **Non-Repainting**: All calculations use `barstate.isconfirmed`
- **Pine Script v6**: Latest version for optimal performance
- **Efficient**: Minimal computational overhead
- **Customizable**: Extensive settings for fine-tuning
## Version History
**v2.0** (Current)
- Added automatic threshold calculation based on Gaussian distribution
- Dynamic bucket adjustment for statistics
- Enhanced dashboard with auto-threshold display
- Improved regime detection using IQR method
**v1.0**
- Initial release with manual thresholds
- Basic EMA coloring
- Trend-shift signals
- KPI dashboard
## Support
For questions, suggestions, or bug reports, please leave a comment or contact the author.
---
**Disclaimer**: This indicator is for educational purposes only. Past performance does not guarantee future results. Always use proper risk management and never risk more than you can afford to lose.
**Keywords**: EMA, slope, angle, trend, automatic thresholds, Gaussian distribution, regime detection, non-repainting, adaptive

SCOTTGO - RSI Divergence IndicatorRSI Divergence Indicator
This indicator combines the Relative Strength Index (RSI) with an automatic divergence detection system.
It is designed to help traders spot potential trend changes by:
Color-Coded RSI: The main RSI line dynamically changes color (e.g., green/red) above and below a user-defined threshold (default 50) to highlight strong or weak momentum instantly.
Divergence Signals: It automatically identifies and plots four types of RSI divergences (Regular Bullish, Hidden Bullish, Regular Bearish, and Hidden Bearish) between the price and the oscillator.
Custom Alerts: Includes alerts for all divergence types so you can be notified when a new signal is found.
This tool helps visualize momentum shifts and potential reversals in the market.

Liquidity Sentiment Profile | LUPENIndicator Guide: Liquidity Sentiment Profile (LSP).
What is the LSP?
The Liquidity Sentiment Profile (LSP) is a "Next-Generation" oscillator designed to look beyond simple price action. While standard indicators (like RSI or MACD) primarily focus on where a candle closes, the LSP analyzes the micro-structure of the entire candle—specifically the relationship between the candle's Body, its Wicks (Shadows), and the Volume.
The Core Philosophy:
Wicks tell the truth: A long lower wick indicates that sellers pushed the price down, but buyers aggressively absorbed that liquidity and pushed it back up.
That is hidden bullish strength.
Volume validates intent: A price move with low volume is noise. A price move (or wick rejection) with high volume is a commitment by institutional players.
The LSP calculates a "Sentiment Score" between -100 and +100 based on these factors.
How to Read the Visuals
The Colors (Intensity)
color: Light Green - Bullish Acceleration. Buyers are in control, and momentum is increasing. This is the ideal time to be in a Long trade.
color: Dark Green - Bullish Deceleration. Buyers are still in control (price is likely rising), but the momentum is fading. This is a warning sign to tighten stop-losses or take profits.
color: Light Red - Bearish Acceleration. Sellers are dominating, and panic is increasing. This is the ideal time to be Short.
color: Dark Red - Bearish Deceleration. Sellers are still in control, but the downward pressure is exhausted. Be careful with new short positions.
The Lines & Fills
The Main Line: The actual LSP sentiment value.
The Yellow Signal Line: A smoothed average of the sentiment.
The Core Fill: The colored area between the Main Line and the Signal Line. When this area "glows", the trend is strong. When it dims (Dark), the trend is weak. Bearish Deceleration. Sellers are still in control, but the downward pressure is exhausted. Be careful with new short positions.
The Lines & Fills
The Main Line: The actual LSP sentiment value.
The Yellow Signal Line: A smoothed average of the sentiment.
The Core Fill: The colored area between the Main Line and the Signal Line. When this area "glows" (Neon), the trend is strong. When it dims (Dark), the trend is weak.
How to Use It (Trading Strategies)
Strategy A: The "Power Cross" (Trend Entry)
Use this for entering trends when the market wakes up.
Long Entry: Wait for the LSP line to cross ABOVE the Yellow Signal Line.
Confirmation: The fill color must turn Neon Green.
Short Entry: Wait for the LSP line to cross BELOW the Yellow Signal Line.
Confirmation: The fill color must turn Neon Red.
Strategy B: The "Absorption" Play (Reversals)
This is where the LSP shines. It detects when liquidity is being absorbed before price turns.
Bullish Absorption: The Price makes a Lower Low, but the LSP makes a Higher Low. This happens because the LSP detects the Volume on the Lower Wicks (buyers absorbing selling pressure). This is a high-probability reversal signal.
Bearish Absorption: The Price makes a Higher High, but the LSP makes a Lower High. The volume on the Upper Wicks suggests sellers are absorbing the buy orders.
Strategy C: The "Dimming" Exit (Risk Management)
Don't wait for the price to crash to exit a trade.
If you are in a Long trade (Neon Green) and the color instantly shifts to Dark Green, it means the "fuel" is running out. Consider taking partial profits or moving your Stop Loss to break even.
Standard oscillators (like RSI) often give false signals during strong trends (showing "Overbought" while price keeps going up). The LSP avoids this because it weights Volume and Wicks. If price goes up and volume increases, the LSP stays Neon Green, telling you the move is genuine, not just overextended.

Intraday Volume Pulse GSK-VIZAG-AP-INDIA📊 Intraday Volume Pulse — by GSK-VIZAG-AP-INDIA
Overview:
This indicator displays a simple and effective intraday volume summary in table format, starting from a user-defined session time. It provides an approximate breakdown of buy volume, sell volume, cumulative delta, and total volume — all updated in real-time.
🧠 Key Features
✅ Session Start Control
Choose the session start hour and minute (default is 09:15 for NSE).
🌐 Timezone Selector
View volume data in your preferred timezone: IST, GMT, EST, CST, etc.
📈 Buy/Sell Volume Estimation Logic
Buy Volume: When candle closes above open
Sell Volume: When candle closes below open
Equal: Volume split equally if Open == Close
🔄 Daily Auto-Reset
All volume metrics reset at the start of a new trading day.
🎨 Color-Coded Volume Insights
Buy Volume: Green shade if positive
Sell Volume: Red shade if positive
Cumulative Delta: Dynamic red/green based on net pressure
Total Volume: Neutral gray with emphasis text
🧾 Readable Number Formatting
Volumes are displayed in "K", "L", and "Cr" units for easier readability.
📌 Table Positioning
Choose from top/bottom corners to best fit your layout.
⚠️ Note
All data shown is approximate and based on candle structure — it does not reflect actual order book or tick-level data. This is a visual estimation tool to guide real-time intraday decisions.
✍️ Signature
GSK-VIZAG-AP-INDIA
Creator of practical TradingView tools focused on volume dynamics and trader psychology.

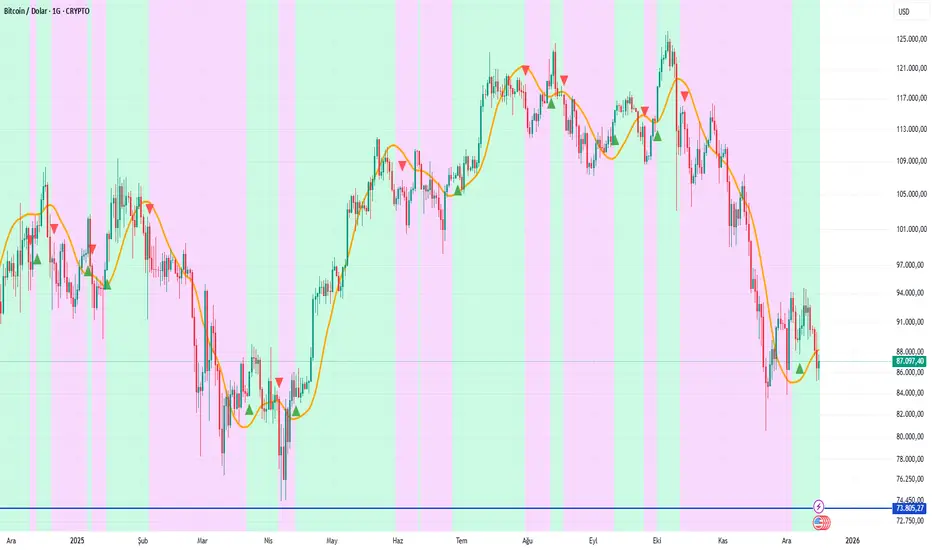
BTC - VDD Multiple (Approx)Overview & Philosophy
⚠️ Note: This indicator is optimized for the Daily (1D) Timeframe. Please switch your chart to 1D for accurate signal reading.
The BTC – VDD Multiple (Approx) is an advanced oscillator designed to identify market overheating and cycle tops by analyzing the velocity of value moving through the market.
In traditional On-Chain Analysis, Value Days Destroyed (VDD) is a premier metric for spotting macro tops. It multiplies the coin age (how long a coin was held) by the price at which it was moved. When old coins (HODLer money) move at high prices, VDD spikes, signaling massive profit-taking.
The Problem: Real "Coin Days Destroyed" (CDD) data is typically locked behind institutional paywalls or unavailable on standard TradingView plans.
The Solution: This script calculates a Deterministic Proxy. By analyzing the relationship between Exchange Volume, Price, and a Dormancy Constant, we can approximate the structure of the VDD Multiple without needing a premium data feed.
Methodology
The VDD Multiple works by comparing short-term market velocity against a long-term baseline.
1. The Proxy Calculation
Since we cannot directly access the age of coins on TradingView, we model the economic weight of the move:
Proxy Value = Exchange Volume * Price * Dormancy Factor
This creates a synthetic representation of "Value Throughput."
2. The Multiple
We compare the immediate heat of the market against the yearly trend:
• Short-Term MA (2 Days): Captures flash spikes and sudden liquidity exit events.
• Long-Term MA (365 Days): Represents the baseline "hum" of network activity.
VDD Multiple = Short Term MA / Long Term MA
How to Read the Chart
The indicator plots the Multiple as a line and uses background highlighting to signal extreme regimes.
🔴 The Red Zone (Overheated > 2.9)
Meaning: Current value transfer is ~3x higher than the yearly average.
Interpretation: Historically, sharp spikes into the Red Zone correlate with Local or Cycle Tops. This indicates that massive volume is changing hands at high prices—typically a sign of "Smart Money" distributing into "Dumb Money" FOMO.
Note: In strong bull runs, price can push higher even after a VDD spike, but the risk/reward ratio is extremely poor here.
🟢 The Green Zone (Undervalued < 0.75)
Meaning: Market activity is quiet and below the yearly baseline.
Interpretation: These are periods of apathy or accumulation. Historically, extended time spent in the Green Zone (the "flatline") has offered the best asymmetric buying opportunities.
🟠 The Orange Line (Neutral)
Meaning: The market is in transition or equilibrium.
Strategy & Context
This indicator is best used as a Macro Cycle Tool, not a day-trading signal.
• Exit Strategy: Look for "Clusters" of Red Spikes. A single spike often marks a local correction, but a cluster of intense spikes while price makes new highs (Divergence) is a strong Cycle Top warning.
• Entry Strategy: Historically the best entries occur when the indicator flattens out in the Green Zone for weeks or months. This suggests sellers are exhausted and the market has reached a floor.
Credits
This script is an approximation of the original VDD Multiple concept. Full credit for the underlying on-chain theory goes to the pioneers of this metric:
• Concept: The original Value Days Destroyed metric was popularized by Hans Hauge and Glassnode.
• The Multiple: The specific application of a Short/Long MA Multiple on VDD is widely attributed to analysts like TXMC and Bitbo.
This script adapts these concepts for the free TradingView environment using exchange volume proxies.
Settings
• Data Source: Defaults to BINANCE:BTCUSDT to capture high-volume liquidity.
• Short MA: Default is 2 Days to capture rapid velocity spikes.
• Long MA: Default is 365 Days to track the annual trend.
Disclaimer
This tool is an approximation based on exchange volume, not raw blockchain data. While exchange volume and on-chain volume are highly correlated during cycle extremes, they are not identical. This script is for educational and research purposes only. Past performance does not guarantee future results.
Tags
bitcoin, btc, onchain, vdd, cdd, valuation, cycle, top, bottom, Rob Maths

PFA_Futures-Spot Divergence IndicatorPFA Futures-Spot Divergence Indicator™
The PFA Futures-Spot Divergence Indicator™ is a proprietary analytical tool designed to provide traders with real-time insights into the pricing gap between futures contracts and their underlying spot indices. By measuring the premium or discount for key indices, the indicator highlights potential market sentiment, arbitrage opportunities, and short-term positioning pressure.
Unlike conventional indicators that focus on price trends alone, this tool emphasizes inter-market dynamics, showing how futures are behaving relative to the cash market. It calculates the differential for selected indices and visualizes it via:
Line plots: showing the live futures-spot gap
Color-coded zones: highlighting premium (positive) vs discount (negative)
Dashboard values: indicating the exact spread and relative intensity
Key Benefits:
Detect market overbought/oversold conditions due to excessive premium or discount
Identify potential arbitrage or rollover opportunities
Gauge market participant sentiment in real time
Complement trend, momentum, and volatility strategies
Use Cases:
NIFTY, BANKNIFTY, and other major Indian indices
Short-term trading and hedging strategies
Risk management and intraday market positioning
Disclaimer: The indicator is for analytical and educational purposes only. It does not provide buy/sell signals or guarantee future returns. Traders should apply independent judgment and proper risk management before taking positions.

HMA & RSI Delta Hybrid SignalsA lag-free trend follower combining Hull Moving Average (HMA) with RSI Momentum Delta to filter false signals and catch high-probability reversals.
# 🚀 HMA & RSI Delta Hybrid Signals
This indicator represents a hybrid approach to trend trading by combining the smoothness of the **Hull Moving Average (HMA)** with the explosive detection capabilities of **RSI Momentum Delta**.
Unlike standard indicators that rely solely on price crossovers, this tool confirms the trend direction with the *velocity* of the price change (Momentum Delta), reducing false signals in choppy markets.
### 🧠 How It Works?
**1. Trend Detection (HMA):**
The script uses the **Hull Moving Average**, known for being extremely fast and lag-free, to determine the overall market direction.
* **Orange Line:** Represents the HMA Trend. The slope determines if we are in an Uptrend or Downtrend.
**2. Momentum Confirmation (RSI Delta):**
Instead of looking at raw RSI levels (like 70 or 30), this algorithm calculates the **"Delta"** (Absolute change from the previous bar).
* It asks: *"Is the price moving in the trend direction with enough speed?"*
* If the RSI jumps significantly (determined by the `Delta Threshold`), it confirms a strong entry.
### 🎯 Signal Modes (Sensitivity)
You can choose between two modes depending on your trading style:
* **🛡️ Conservative Mode (Default):**
* Strict filtering.
* Requires the Trend to match the HMA direction AND the RSI Delta to exceed the specific threshold (e.g., 0.8).
* *Best for:* Avoiding false signals in sideways markets.
* **⚔️ Aggressive Mode:**
* Faster entries.
* Requires the Trend to match the HMA direction AND any positive momentum change in RSI.
* *Best for:* Scalping or catching the very beginning of a move.
### ✨ Key Features
* **Non-Repainting Signals:** Once a bar closes, the signal is fixed.
* **Non-Repeating:** It will not spam multiple "BUY" signals in a row; it waits for a trend change or reset.
* **Visual Trend:** Background color changes based on the HMA slope (Green for Bullish, Purple for Bearish).
* **Fully Customizable:** Adjust HMA length, RSI period, and Delta sensitivity.
---
**⚠️ DISCLAIMER:** This tool is for educational and analytical purposes only. Always manage your risk.
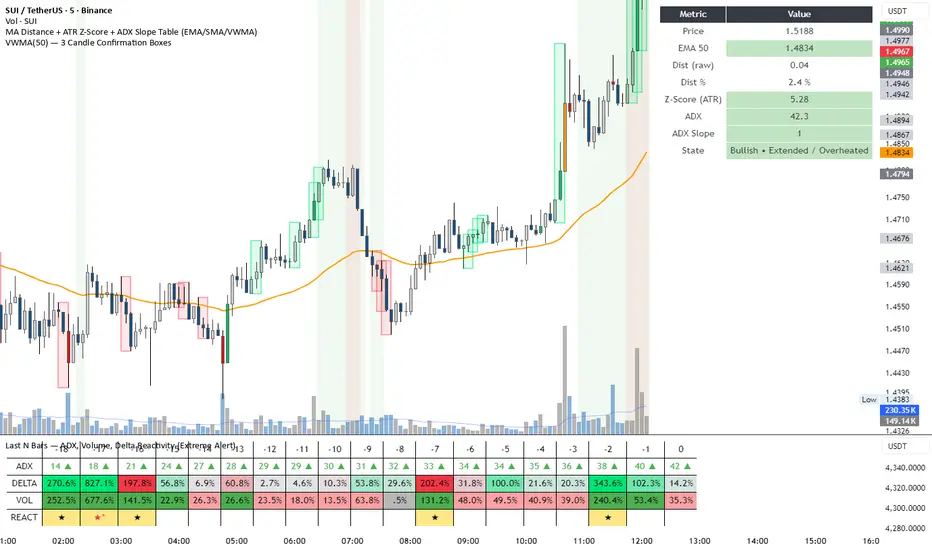
DeltaReact - Volume and Orderflow ReactivityThis indicator is designed to visualise institutional participation and directional pressure using a multi-timeframe blend of volume expansion, delta imbalance, and trend context.
Unlike traditional volume or momentum tools, it focuses on relative change rather than absolute values.
Core Concepts
The script measures:
Volume expansion relative to its own moving baseline
Delta strength derived from directional volume imbalance
Directional agreement between delta, volume, and trend state
Multi-timeframe structure, allowing lower-timeframe signals to be viewed in higher-timeframe context
What Makes This Different
Most volume-based indicators treat volume and delta independently. This tool:
Normalises both metrics into percentage-based strength
Applies contextual filters to reduce noise
Highlights structural shifts rather than raw spikes
Provides clear visual hierarchy for participation intensity
How to Use
Strong delta + volume expansion suggests active participation
Directional alignment improves confidence
Signals are designed for confluence, not standalone entries
Works across assets and sessions without instrument-specific tuning
Access & Availability
This script is published as invite-only to control distribution.
If you would like to request access or learn more about usage, please contact the author via TradingView direct message.
Important Notes
This indicator is not a trading strategy and does not provide buy or sell signals.
It is intended as a decision-support tool to be used alongside risk management and broader market analysis.
Option Chain Pro+ [Max Pain + PCR]
# 📊 Option Chain Pro+ - Complete Options Trading System
## 🎯 Overview
**Option Chain Pro+** is the most comprehensive options analysis indicator for Indian indices (NIFTY, BANKNIFTY, FINNIFTY, MIDCAP, SENSEX, BANKEX). This professional-grade tool combines real-time option chain data, Greeks calculation, Max Pain analysis, Put-Call Ratio (PCR), and intelligent trading signals - all in one powerful indicator.
Perfect for both **premium sellers** and **directional option buyers**, this indicator provides actionable trading signals with specific strike recommendations and entry prices.
---
## ✨ KEY FEATURES
### 📈 **Complete Option Chain Display**
- **Real-time option prices** for Calls and Puts across multiple strikes
- **All 5 Greeks**: Delta (Δ), Gamma (Γ), Theta (θ), Vega (ν), Rho (ρ)
- **Implied Volatility (IV)** for each strike
- **Put-Call Ratio (PCR)** column showing sentiment at each strike level
- **Configurable strikes** (5-15 strikes, default: 9)
- **Color-coded highlighting** for easy identification:
- 🟠 Orange: ATM (At-The-Money) strike
- 🔴 Red: Max Pain strike (💀MP)
- 🟢 Green: Recommended Call buy (🚀)
- 🟣 Magenta: Recommended Put buy (🔻)
### 💀 **Max Pain Analysis**
- **Automatic calculation** of Max Pain point (where option buyers lose most)
- **Visual highlighting** in option chain table
- **Chart level** plotting (red dashed line)
- **Trading signals** based on distance from Max Pain
- **Most effective** in expiry week (last 3-5 days)
### 📊 **Put-Call Ratio (PCR) Analysis**
- **Overall PCR**: Total Put premium / Total Call premium
- **Strike-wise PCR**: Individual PCR at each strike level
- **Color-coded signals**:
- 🔴 Red (PCR > 1.5): Bearish - Heavy put buying
- 🟠 Orange (PCR 0.7-1.5): Neutral - Balanced
- 🟢 Green (PCR < 0.7): Bullish - Heavy call buying
- **Support/Resistance identification** from PCR levels
### 🎯 **Intelligent Trading Signals**
#### **Greek-Based Analysis (7 Indicators)**
1. **DELTA**: Direction bias (Bullish/Bearish/Neutral)
2. **GAMMA**: Risk assessment (High/Moderate/Low)
3. **THETA**: Time decay speed (Fast/Moderate/Slow)
4. **VEGA**: Volatility environment (High/Moderate/Low)
5. **VIX**: Fear gauge (High/Moderate/Low fear)
6. **PCR**: Market sentiment (Bearish/Neutral/Bullish)
7. **MAX PAIN**: Price magnet effect (Below/At/Above)
#### **💰 Premium Selling Signals**
- **Automated recommendations** for credit strategies
- Signals: SELL PREMIUM / HEDGE/PROTECT / NEUTRAL STRATEGY
- Perfect for Iron Condors, Credit Spreads, and premium collection
#### **🚀 Option Buying Signals**
- **Specific strike recommendations** for directional trades
- **Entry prices** displayed in real-time
- **Risk/Reward assessment**: FAVORABLE / MODERATE / UNFAVORABLE
- **Visual highlighting** in option chain for recommended strikes
- Separate signals for Calls (🚀) and Puts (🔻)
### 📐 **Advanced Greeks Calculation**
- **Black-Scholes model** implementation in Pine Script
- **Real-time calculation** for all strikes
- **Accurate pricing** using current market data
- **Configurable risk-free rate** (default: 6.5%)
- **IV estimation** from India VIX with multiplier option
---
## 🔧 HOW IT WORKS
### **Data Collection**
1. Fetches real-time spot/futures price
2. Calculates ATM (At-The-Money) strike automatically
3. Retrieves option prices for configured number of strikes
4. Pulls India VIX for volatility estimation
### **Greeks Calculation**
- Implements Black-Scholes model for European options
- Calculates Delta, Gamma, Theta, Vega, Rho for each strike
- Uses 3 days to expiry (configurable via expiry date input)
- Adjusts for Indian market conventions
### **Max Pain Calculation**
- Simulates price settlement at each strike
- Calculates total option buyer losses (Calls + Puts)
- Identifies strike with maximum buyer loss
- Updates in real-time as prices change
### **PCR Analysis**
- Computes Put/Call premium ratio at each strike
- Aggregates overall PCR across all strikes
- Color-codes based on sentiment thresholds
- Identifies support/resistance from extreme PCR values
### **Signal Generation**
Combines multiple factors:
- Greek values (especially Delta, Gamma, Theta)
- VIX level (volatility environment)
- PCR sentiment (fear/greed gauge)
- Max Pain distance (price magnet)
- Generates BUY or SELL recommendations with specific strikes
---
## 🎨 VISUAL COMPONENTS
### **Main Option Chain Table (17 Columns)**
Left to Right:
1. **Call Greeks**: Rho, Gamma, Theta, Vega, Delta
2. **Call IV**: Implied Volatility
3. **Call Price**: Premium
4. **Strike**: Strike price with markers (*ATM, 💀MP, 🚀, 🔻)
5. **PCR**: Put-Call Ratio (color-coded)
6. **Put Price**: Premium
7. **Put IV**: Implied Volatility
8. **Put Greeks**: Delta, Vega, Theta, Gamma, Rho
**Footer**: ATM IV | Overall PCR | Max Pain | VIX | VWAP
### **Trading Signals Table (16 Rows)**
1. **Header**: Indicator | Value | Signal | Action
2. **7 Analysis Rows**: Delta, Gamma, Theta, Vega, VIX, PCR, Max Pain
3. **Sell Strategy**: Recommendation for premium selling
4. **Buy Opportunity**: Recommendation for directional buying
5. **Buy Details**: Specific strike + Entry price
6. **Risk/Reward**: Assessment of buy opportunity
### **Chart Elements**
- **Price plot**: Underlying price (white line)
- **ATM line**: Orange dashed horizontal line
- **Max Pain line**: Red dashed horizontal line
---
## ⚙️ SETTINGS & CUSTOMIZATION
### **Plot Settings**
- **Spot Symbol**: NIFTY, BANKNIFTY, MIDCAP, FINNIFTY, SENSEX, BANKEX
- **Ref Strike**: Manual strike reference (used when Auto Tracking = NONE)
- **Expiry Date**: Format YYYY-MM-DD (e.g., 2025-12-19)
- **Auto Tracking**: SPOT / FUTURES / NONE
- FUTURES (recommended): Uses futures price for ATM calculation
- SPOT: Uses spot index price
- NONE: Uses manual Ref Strike
- **Dashboard Location**: Position of option chain table (9 positions)
- **Signals Location**: Position of trading signals table (9 positions)
### **Display Settings**
- **Number of Strikes**: 5-15 (default: 9)
- More strikes = Better Max Pain accuracy
- Fewer strikes = Faster loading
- **Color Scheme**: Dark / Light
- **Show Trading Signals**: Toggle signals table ON/OFF
- **Show Symbols (Debug)**: Display option symbols instead of prices
### **Strike Difference**
Configure strike intervals for each index:
- NIFTY: 50 (default)
- BANKNIFTY: 100 (default)
- MIDCAP: 25 (default)
- FINNIFTY: 50 (default)
- SENSEX: 100 (default)
- BANKEX: 100 (default)
### **Advanced Settings**
- **Risk Free Rate**: 6.5% (default) - Used in Greeks calculation
- **IV Multiplier**: 1.0 (default) - Adjust VIX-based IV estimation
### **Buy Strategy**
- **Buy Strike Distance (OTM)**: 1-5 strikes (default: 2)
- 1 = Closer to ATM (higher probability, lower leverage)
- 2 = Balanced (recommended)
- 3-5 = Further OTM (lower probability, higher leverage)
---
## 📚 TRADING STRATEGIES SUPPORTED
### **1. Premium Selling Strategies**
**When to use**: High Theta + Low VIX + High IV Rank
- Iron Condors
- Credit Spreads (Bull/Bear)
- Naked Put selling (cash-secured)
- Ratio spreads
**Signals to watch**:
- SELL STRATEGY = "SELL PREMIUM"
- Theta > -15 (fast decay)
- VIX > 15 (high premiums)
- Gamma < 0.002 (low risk)
### **2. Directional Buying**
**When to use**: Low VIX + High Gamma + Strong trend
- ATM/OTM Call buying (bullish)
- ATM/OTM Put buying (bearish)
- Debit spreads
**Signals to watch**:
- BUY OPPORTUNITY = "🚀 BUY CALL" or "🔻 BUY PUT"
- RISK/REWARD = "FAVORABLE"
- VIX < 13 (cheap options)
- Clear directional bias from Delta
### **3. Max Pain Trading (Expiry Week)**
**When to use**: Last 3 days before expiry
- Price gravitates toward Max Pain
- Fade extremes, buy toward Max Pain
**Example**:
- Max Pain: 26000
- Current: 25850 (below)
- Action: Buy 25900 CE, target 26000
### **4. PCR Contrarian**
**When to use**: Extreme PCR readings
- PCR > 1.5: Excessive fear → Sell Puts
- PCR < 0.7: Excessive greed → Sell Calls
### **5. Support/Resistance from PCR**
**When to use**: Identify key levels
- High PCR at strike = Strong support (Put wall)
- Low PCR at strike = Strong resistance (Call wall)
---
## 💡 HOW TO USE
### **Step 1: Setup**
1. Add indicator to NIFTY/BANKNIFTY chart
2. Set expiry date (Thursday for weekly, last Thursday for monthly)
3. Choose number of strikes (9 recommended)
4. Select Auto Tracking = FUTURES
5. Position tables (Option Chain: top_right, Signals: bottom_right)
### **Step 2: Analyze Greeks**
Check the **Trading Signals Table**:
- **Delta**: Market direction bias
- **Gamma**: Risk of sudden moves
- **Theta**: Speed of time decay
- **Vega**: Volatility environment
- **VIX**: Overall fear/greed
- **PCR**: Put/Call sentiment
- **Max Pain**: Price magnet
### **Step 3: Identify Opportunities**
**For Premium Selling**:
- Check "💰 SELL STRATEGY" row
- If "SELL PREMIUM" → Look for credit spread setups
- High Theta + Low Gamma = Ideal for selling
**For Option Buying**:
- Check "🎯 BUY OPPORTUNITY" row
- If "🚀 BUY CALL" or "🔻 BUY PUT" appears
- Note the recommended STRIKE and PRICE
- Check RISK/REWARD assessment
- FAVORABLE = Full position size
- MODERATE = Half position size
- UNFAVORABLE = Wait
### **Step 4: Execute**
1. Locate highlighted strike in option chain (🚀 green or 🔻 magenta)
2. Verify price matches recommendation
3. Execute trade with proper position sizing
4. Set stop loss: 50% of premium paid for buyers
5. Target: 100-150% profit (2-2.5x)
### **Step 5: Monitor**
- **Max Pain line**: Price tends to gravitate here near expiry
- **PCR values**: Watch for shifts in sentiment
- **Greeks changes**: Delta/Gamma shifts indicate trend changes
- **VIX spikes**: Exit short premium positions if VIX > 20
---
## 🎓 INTERPRETATION GUIDE
### **Delta Signals**
- **> 0.6**: Bullish bias → Sell Puts / Buy Calls
- **0.4-0.6**: Neutral → Iron Condor / Range strategies
- **< 0.4**: Bearish bias → Sell Calls / Buy Puts
### **Gamma Signals**
- **> 0.002**: High risk → Avoid selling, spreads only
- **0.001-0.002**: Moderate risk → Use defined risk strategies
- **< 0.001**: Low risk → Safe to sell premium
### **Theta Signals**
- **|θ| > 20**: Fast decay → Aggressive premium selling
- **|θ| 10-20**: Moderate decay → Credit spreads
- **|θ| < 10**: Slow decay → Buy options (cheaper)
### **Vega Signals**
- **> 12**: High volatility → Sell volatility (straddles/strangles)
- **8-12**: Moderate → Neutral strategies
- **< 8**: Low volatility → Buy options (underpriced)
### **VIX Signals**
- **> 15**: High fear → Sell premium (expensive options)
- **12-15**: Moderate → Neutral
- **< 12**: Low fear → Buy protection / Long options
### **PCR Signals**
- **> 1.5**: Bearish (Put heavy) → Contrarian: Sell Puts
- **0.7-1.5**: Neutral (Balanced) → Range strategies
- **< 0.7**: Bullish (Call heavy) → Contrarian: Sell Calls
### **Max Pain Signals**
- **Below Max Pain**: Upside bias → Buy Calls / Sell Puts
- **At Max Pain**: Consolidation → Iron Condor
- **Above Max Pain**: Downside bias → Buy Puts / Sell Calls
---
## 📊 EXAMPLE SCENARIOS
### **Scenario 1: Premium Selling Setup**
```
Greeks Analysis:
- Delta: 0.52 (Neutral)
- Gamma: 0.0010 (Low Risk)
- Theta: -18 (Fast Decay)
- Vega: 13.5 (High Vol)
- VIX: 16.5 (High Fear)
- PCR: 1.4 (Neutral)
Signal: SELL PREMIUM ✅
Action: Sell Iron Condor
Setup: Sell 26050 CE + 25850 PE, Buy wings
```
### **Scenario 2: Bullish Buy Setup**
```
Greeks Analysis:
- Delta: 0.58 (Bullish)
- Gamma: 0.0018 (High - Big moves expected)
- Theta: -12 (Moderate)
- Vega: 8.5 (Moderate)
- VIX: 11.2 (Low - Cheap options)
- PCR: 1.6 (Bearish - Contrarian opportunity)
- Max Pain: 26000, Current: 25850
Signal: 🚀 BUY CALL
Strike: 26050 CE
Price: 12.50
Risk/Reward: FAVORABLE ✅
Action: Buy 26050 CE at ₹12.50
Target: ₹25-30 (2x)
Stop: ₹6 (50% loss)
```
### **Scenario 3: Max Pain Trade**
```
Max Pain: 26000
Current Price: 25850 (150 points below)
Days to Expiry: 2
PCR: 1.2 (Neutral)
Signal: BELOW MAX PAIN → Upside Likely
Action: Buy 25900 CE
Reason: Price likely to move toward Max Pain
Target: 26000 (Max Pain level)
```
---
## ⚠️ IMPORTANT NOTES
### **Data Limitations**
- Uses **simplified Greeks** calculation (assumes 3 DTE by default)
- Option prices may have slight delays (TradingView data refresh)
- Max Pain calculation is **approximation** based on current premiums
- Not all option symbols may be available on TradingView
### **Best Practices**
1. **Verify prices** on your broker platform before trading
2. **Use during market hours** (9:15 AM - 3:30 PM IST) for accurate data
3. **Most effective** 3-5 days before expiry
4. **Combine with price action** and trend analysis
5. **Risk management**: Never risk more than 2% per trade
### **Optimization Tips**
- **Increase strikes** to 9-11 for better Max Pain accuracy
- **Use FUTURES** tracking for liquid indices (NIFTY, BANKNIFTY)
- **Enable debug mode** initially to verify symbols are correct
- **Adjust IV Multiplier** if VIX seems over/underestimated
---
## 🔄 UPDATES & SUPPORT
### **Version 1.0 Features**
✅ Complete option chain display (17 columns)
✅ All 5 Greeks calculation
✅ Max Pain analysis
✅ Put-Call Ratio (PCR) - Overall + Strike-wise
✅ Trading signals (Buy + Sell)
✅ Specific strike recommendations
✅ Risk/Reward assessment
✅ Support for 6 Indian indices
✅ Configurable strikes (5-15)
✅ Dark/Light color schemes
✅ Auto ATM tracking
### **Planned Updates**
🔜 OI (Open Interest) data integration
🔜 Historical Max Pain tracking
🔜 PCR trends and momentum
🔜 Custom alerts for signals
🔜 Multi-expiry analysis
🔜 Volatility smile/skew display
---
## 📖 EDUCATIONAL RESOURCES
### **Understanding Greeks**
- **Delta**: Rate of change in option price vs underlying (0-1 for calls, -1-0 for puts)
- **Gamma**: Rate of change of Delta (highest at ATM)
- **Theta**: Time decay per day (always negative for buyers)
- **Vega**: Sensitivity to volatility changes
- **Rho**: Sensitivity to interest rate changes (less important for short-term)
### **Max Pain Theory**
Max Pain suggests that market makers manipulate prices toward the strike where option buyers lose the most money. While controversial, it has statistical validity in expiry week when:
1. Volume is high
2. Market makers hedge positions
3. Pin risk causes clustering at certain strikes
### **PCR as Sentiment Indicator**
- PCR > 1: More put buying than call buying (bearish)
- PCR < 1: More call buying than put buying (bullish)
- **Contrarian use**: Extreme readings often precede reversals
- **Confirmation use**: With trend for continuation trades
---
## 🎯 WHO IS THIS FOR?
### ✅ **Perfect For:**
- Options traders (all experience levels)
- Premium sellers (credit strategies)
- Directional option buyers
- Intraday option traders
- Swing traders in options
- Risk managers
- Market makers
- Professional traders
### ✅ **Use Cases:**
- Daily options trading on NIFTY/BANKNIFTY
- Weekly expiry strategies
- Monthly expiry positioning
- Volatility trading
- Hedging portfolios
- Greeks-based strategies
- Statistical arbitrage
---
## ⚖️ DISCLAIMER
**This indicator is for educational and informational purposes only.**
- NOT financial advice or recommendation to buy/sell
- Past performance does not guarantee future results
- Options trading involves substantial risk of loss
- Greeks calculations are theoretical models
- Max Pain is not guaranteed to be reached
- Always verify data with your broker
- Use proper risk management and position sizing
- Consult a financial advisor before trading
**The author is not responsible for any trading losses.**
---
## 📞 SUPPORT
For questions, issues, or feature requests:
- Comment below this indicator
- Check TradingView documentation for Pine Script basics
- Review NSE option chain for symbol verification
---
## 🏆 WHY CHOOSE THIS INDICATOR?
### **Comprehensive**
- Most complete options analysis tool on TradingView
- Combines Greeks + Max Pain + PCR + Signals in one
### **Professional**
- Used by professional traders
- Based on proven Black-Scholes model
- Real-time calculations
### **Actionable**
- Specific strike recommendations
- Entry prices displayed
- Clear Buy/Sell signals
- Risk/Reward assessment
### **Customizable**
- Multiple indices supported
- Configurable strikes
- Adjustable parameters
- Flexible positioning
### **Visual**
- Color-coded for easy reading
- Highlighted opportunities
- Chart levels for reference
- Professional table layouts
---
## 🚀 GET STARTED
1. **Add to chart**: Click "Add to favorites" ⭐
2. **Apply to NIFTY or BANKNIFTY** chart
3. **Set expiry date** in settings
4. **Configure strikes** (9 recommended)
5. **Start trading** with professional insights!
---
**Happy Trading! 📊💰**
*If you find this indicator useful, please like, comment, and share!*
*Your feedback helps improve future versions.*
---
**Tags**: #options #greeks #nifty #banknifty #maxpain #pcr #delta #gamma #theta #vega #optionchain #india #nse #trading #signals

Call-Put Cross Strike Match [Pro]📊 Call-Put Cross Strike Match - Professional Options Trading Indicator
Advanced NSE Options Analysis with AI-Powered Trading Signals & Dynamic Display
🎯 Overview
The Call-Put Cross Strike Match is an institutional-grade options analysis tool designed exclusively for NSE NIFTY and BANKNIFTY traders. Built on Pine Script v6, this indicator combines sophisticated cross-strike matching algorithms with intelligent trading signal generation to identify optimal options trading opportunities in real-time.
What makes it unique:
Analyzes 25 call-put combinations simultaneously
Generates actionable BUY/SELL signals using professional strategies
Fully customizable display with 9 table positions and 6 size options
Simplified setup with semi-automatic ATM detection
Clean, clutter-free interface with only essential information
Perfect for intraday scalpers, premium sellers, and positional options traders.
✨ Key Features
1. 🔍 Advanced Cross-Strike Matching Algorithm
The indicator calculates price differences for all 25 combinations (5 call strikes × 5 put strikes) and identifies the best matches based on put-call parity.
How it works:
Compares each call option price with every put option price
Calculates absolute difference: |Call - Put |
Ranks all 25 combinations from lowest to highest difference
Highlights top 3 or top 5 matches with visual checkmarks
Visual indicators:
✓✓ (Double check) = Best match (lowest price difference)
✓ (Single check) = Good matches (top 3 or top 5)
Empty cells = No match (significant price difference)
Why this matters:
When Call ≈ Put at same strike, it indicates fair pricing and synthetic position opportunities. The indicator automatically finds these opportunities across different strike combinations.
2. 🎯 Intelligent Trading Signals (Last Column)
The indicator generates professional trading recommendations based on Call-Put price difference analysis:
Signal Types:
BUY CE - Long call opportunity (bullish)
SELL CE - Short call opportunity (premium selling)
BUY PE - Long put opportunity (bearish/hedge)
SELL PE - Short put opportunity (premium selling)
BULL - Moderate bullish bias
BEAR - Moderate bearish bias
ATM - Neutral market (near parity)
NEUTRAL - No clear bias
Color-Coded for Quick Decisions:
🟩 Green = Long opportunities (BUY CE, BULL)
🟥 Red = Short call opportunities (SELL CE)
🟧 Orange = Long put opportunities (BUY PE)
🟫 Maroon = Short put opportunities (SELL PE)
⬛ Gray = Neutral zones (ATM, NEUTRAL)
3. 🤖 Three Professional Signal Modes
SMART Mode (Recommended) 🎯
Context-aware institutional strategy that considers strike position relative to spot price.
Signal Logic:
text
OTM Call Expensive (C-P > threshold, Strike > Spot):
→ SELL CE (Premium selling opportunity)
ITM Call Underpriced (C-P > threshold, Strike < Spot):
→ BUY CE (Synthetic long opportunity)
OTM Put Expensive (C-P < -threshold, Strike < Spot):
→ SELL PE (Premium selling opportunity)
ITM Put Underpriced (C-P < -threshold, Strike > Spot):
→ BUY PE (Protection or synthetic short)
Near Parity (|C-P| < threshold/4):
→ ATM (Neutral market, straddle/strangle zone)
Moderate Imbalance:
→ BULL or BEAR (Directional bias without extreme pricing)
Best for: Professional traders, option writers, synthetic position builders
MOMENTUM Mode 📈
Trend-following strategy that rides market momentum.
Signal Logic:
text
Calls Expensive (C-P > threshold):
→ BUY CE (Follow bullish momentum)
Puts Expensive (C-P < -threshold):
→ BUY PE (Follow bearish momentum)
Near Parity:
→ NEUTRAL (No clear trend)
Best for: Intraday scalpers, directional traders, swing traders
MEAN REVERSION Mode 🔄
Counter-trend strategy focused on premium selling.
Signal Logic:
text
Calls Overpriced (C-P > threshold):
→ SELL CE (Collect inflated premium)
Puts Overpriced (C-P < -threshold):
→ SELL PE (Collect inflated premium)
Near Parity:
→ ATM (Fair value, no edge)
Best for: Option writers, theta decay strategies, credit spread traders
4. 🎨 Fully Customizable Display
Dynamic Table Positioning (9 Options):
Top: left, center, right
Middle: left, center, right
Bottom: left, center, right
Choose position based on your chart layout and other indicators.
Dynamic Table Sizing (6 Options):
Auto - Adapts to content
Tiny - Minimal space (for cluttered charts)
Small - Default, best balance
Normal - Medium size (1080p monitors)
Large - Big text (4K monitors)
Huge - Maximum size (presentations)
Text scales intelligently:
Headers, data, and checkmarks adjust proportionally
Checkmarks remain visible even in tiny mode
Info row stays readable at all sizes
5. ⚙️ Simplified Input System
Auto Mode (Recommended):
Enter just 5 strikes once at market open - used for both calls and puts.
Example for NIFTY at 25,900:
text
Strike 1: 25850 (ATM - 100)
Strike 2: 25900 (ATM - 50)
Strike 3: 25950 (ATM)
Strike 4: 26000 (ATM + 50)
Strike 5: 26050 (ATM + 100)
Manual Mode (Advanced):
Enter separate call and put strikes for cross-strike arbitrage analysis.
Why this matters:
50% fewer inputs compared to traditional indicators
One-time setup at market open
Rarely needs updating (only if market moves 100+ points)
6. 🎛️ Semi-Automatic ATM Detection
The indicator automatically:
Detects current NIFTY/BANKNIFTY spot price
Calculates ATM strike (rounded to nearest 50 or 100)
Marks ATM strikes with *ATM in the table
Displays ATM and spot price in info box
No manual recalculation needed!
7. 📊 Clean Information Display
Main Table (Top/Middle/Bottom):
CE \ PE matrix showing all strike combinations
Checkmarks (✓✓ and ✓) highlighting best matches
SIGNAL column with color-coded trading recommendations
Best Match footer showing optimal combination
Info row displaying symbol, signal mode, and spot price
Info Box (Bottom Left):
Symbol (NIFTY/BANKNIFTY)
Signal Mode (Smart/Momentum/Mean Reversion)
Current Spot Price
Detected ATM Strike
Best Matched Call Strike
Best Matched Put Strike
Match Difference
C-P value for best match
📋 Quick Setup Guide (3 Steps)
Step 1: Add Indicator
Open NIFTY or BANKNIFTY chart on TradingView
Add "Call-Put Cross Strike Match " from indicators
Step 2: Configure Basic Settings
text
Symbol Detection: Auto (reads from chart)
Expiry Date: 251219 (format: YYMMDD for 19-Dec-2025)
Strike Mode: Auto
Strike Interval: 50 (for NIFTY) or 100 (for BANKNIFTY)
Step 3: Enter Strikes
At market open (9:15 AM), check current price and enter 5 strikes:
text
Example: NIFTY at 25,937
Strike 1: 25850 (ATM - 100)
Strike 2: 25900 (ATM - 50)
Strike 3: 25950 (ATM) ← Rounded to nearest 50
Strike 4: 26000 (ATM + 50)
Strike 5: 26050 (ATM + 100)
That's it! The indicator handles everything else automatically.
💡 Real-World Use Cases
1. 📉 Premium Selling (Mean Reversion Mode)
Scenario: Looking for overpriced options to write
How to use:
Set Signal Mode to "Mean Reversion"
Set Threshold: 30 (NIFTY) or 75 (BANKNIFTY)
Look for SELL CE or SELL PE signals with ✓ or ✓✓
Sell naked options or credit spreads at those strikes
Target 30-50% profit or 3-5 days theta decay
Perfect for: Credit spreads, iron condors, covered calls, naked puts
2. 📈 Directional Trading (Momentum Mode)
Scenario: Scalping intraday moves
How to use:
Set Signal Mode to "Momentum"
Set Threshold: 15 (aggressive) or 25 (conservative)
BUY CE signal + ✓✓ = Long call entry
Enter with tight stop (20% of premium)
Target 30-50% gain within 1-2 hours
Perfect for: Intraday scalping, swing trading, trend following
3. 🔄 Synthetic Positions (Smart Mode)
Scenario: Building synthetic long/short with defined risk
How to use:
Set Signal Mode to "Smart"
Look for BUY CE at ITM strike + SELL PE at OTM strike
Both should have ✓ indicator (good parity)
Creates synthetic long position
Lower capital than buying futures
Perfect for: Professional traders, arbitrage, capital efficiency
4. ⚖️ ATM Strategy Optimization (Smart Mode)
Scenario: Finding optimal strikes for straddle/strangle
How to use:
Identify strike marked *ATM
Check if signal shows ATM (balanced market)
If BULL/BEAR → Market has directional bias, adjust accordingly
✓✓ indicates best matched strike for neutral strategies
Perfect for: Volatility trading, earnings plays, event trading
5. 🛡️ Hedging Optimization (Smart Mode)
Scenario: Protecting long equity positions
How to use:
Look for BUY PE signals (protection signals)
Avoid strikes with SELL PE (expensive hedges)
✓✓ shows best value for hedge entry
Optimize hedge timing and strike selection
Perfect for: Portfolio hedging, risk management, protective puts
⚙️ Settings Guide
Symbol Settings
Symbol Detection: Auto (recommended) or Manual
Manual Symbol: NIFTY or BANKNIFTY
Expiry Date: Format YYMMDD (e.g., 251219 = 19-Dec-2025)
Update every Thursday after 3:30 PM for next week's expiry
Strike Settings
Strike Mode: Auto (recommended) or Manual
Strike Interval:
50 for NIFTY
100 for BANKNIFTY
Trading Signals
Signal Mode: Smart / Momentum / Mean Reversion
Smart: Professional institutional strategy (default)
Momentum: Trend-following for scalpers
Mean Reversion: Premium selling for writers
Signal Threshold: Sensitivity in points
NIFTY Recommendations:
Conservative: 30-40 points (fewer, higher quality signals)
Balanced: 20-25 points (default)
Aggressive: 10-15 points (more signals, more noise)
BANKNIFTY Recommendations:
Conservative: 75-100 points
Balanced: 50-60 points (default)
Aggressive: 30-40 points
Algorithm Settings
Matching Mode:
Top 3: Shows 3 best matches (cleaner display)
Top 5: Shows 5 best matches (more opportunities)
Display Settings
Show Matching Table: Enable/disable main table
Table Position: Choose from 9 positions
top_right (default) - Doesn't block price action
middle_right - Centered vertical view
bottom_right - If top is crowded
Table Size: Choose from 6 sizes
small (default) - Best for most users
normal - For 1080p/4K monitors
tiny - If you have many indicators
📊 Understanding The Table
Table Layout Example:
text
CE \ PE | 25950 | 25900 | 25850 | 26000 | 26050 | SIGNAL
---------|-------|-------|-------|-------|-------|--------
25850 | | | | | | SELL PE
25900*ATM| | ✓ | | | | ATM
25950 | ✓✓ | | | | | BULL
26000 | | | | ✓ | | BUY CE
26050 | | | | | | SELL CE
---------|-------|-------|-------|-------|-------|--------
Best Match: 25950 / 25950 (0.25)
Info: NIFTY | Smart | Spot:25881.9
Reading the Table:
Rows (Left): Call option strike prices
Columns (Top): Put option strike prices
Cells: Checkmarks where Call ≈ Put
✓✓: Best match (minimum price difference)
✓: Good matches (top 3 or 5)
Empty: Prices too different (no match)
*ATM: Automatically detected at-the-money strike
SIGNAL Column: Actionable trading recommendation for each call strike
Info Box Metrics:
Symbol: Currently analyzed index
Signal Mode: Active strategy
Spot: Current underlying price
ATM: Calculated at-the-money strike
Best Call: Matched call strike
Best Put: Matched put strike
Match Diff: Price difference (lower = better)
C-P (Best): Call minus Put for best match
📈 Best Practices
Strike Selection & Maintenance
At Market Open (9:15 AM):
Check current price (e.g., NIFTY at 25,937)
Round to nearest interval (25,950 for 50 interval)
Enter 5 strikes: -100, -50, 0, +50, +100 from ATM
Update Frequency:
Usually no update needed entire day
Update only if market moves 100+ points from initial ATM
Typically 0-2 updates per trading session
Signal Interpretation by Confidence Level
High Confidence (✓✓ + Signal):
Best match indicator present
Strongest signal quality
Highest probability setup
Medium Confidence (✓ + Signal):
Good match present
Reliable signal
Acceptable risk/reward
Low Confidence (Signal without ✓):
No match indicator
Strike far from parity
Requires additional confirmation
Risk Management Rules
Never trade signals blindly. Always:
✅ Confirm with price action and support/resistance
✅ Check overall market trend (NIFTY/BANKNIFTY direction)
✅ Consider time decay (theta) for your position
✅ Monitor IV changes (implied volatility)
✅ Use proper position sizing (1-2% risk per trade)
✅ Set stop losses (20-30% of premium for longs)
✅ Have profit targets (30-50% for scalps)
Timeframe Selection
Intraday Trading:
Use 5-minute or 15-minute chart
Momentum or Smart mode
Lower threshold (aggressive)
Quick entries and exits
Positional Trading:
Use hourly or daily chart
Smart or Mean Reversion mode
Higher threshold (conservative)
Swing trade positions
Combining with Other Tools
Recommended complements:
Support/resistance levels (horizontal lines)
Trend indicators (EMA 20/50, SuperTrend)
Volume analysis (confirm breakouts)
India VIX (volatility context)
Option chain data (open interest)
🎓 Strategy Examples
Strategy 1: Professional Premium Selling
text
Mode: Mean Reversion
Threshold: 30 (NIFTY) / 75 (BANKNIFTY)
Timeframe: Daily
Rules:
1. Wait for SELL CE or SELL PE signal
2. Verify strike has ✓ or ✓✓ (good parity)
3. Check if OTM (Strike away from spot)
4. Sell option or create credit spread
5. Target: 30-50% profit or 3-5 days theta
6. Stop: If signal changes to BUY
Position: Naked short or credit spreads
Risk: Define with spreads or capital allocation
Strategy 2: Intraday Momentum Scalping
text
Mode: Momentum
Threshold: 15 (aggressive)
Timeframe: 5-minute
Rules:
1. Wait for BUY CE signal + ✓✓
2. Enter long call immediately
3. Stop loss: 20% of premium paid
4. Target 1: 30% gain (partial exit)
5. Target 2: 50% gain (full exit)
6. Exit if signal changes or 2 hours pass
Position: Long calls or long puts only
Risk: 1-2% of capital per trade
Strategy 3: Synthetic Long Position
text
Mode: Smart
Threshold: 25 (NIFTY) / 60 (BANKNIFTY)
Timeframe: Hourly
Rules:
1. Identify BUY CE signal at ITM strike
2. Identify SELL PE signal at OTM strike
3. Both should have ✓ indicator
4. Buy ITM call + Sell OTM put = Synthetic Long
5. Lower capital than futures
6. Defined risk (width of strikes)
Position: Call debit + Put credit
Risk: Net debit paid (defined risk)
Strategy 4: ATM Straddle Entry
text
Mode: Smart
Threshold: 20 (default)
Timeframe: Daily
Rules:
1. Find strike marked *ATM
2. Check signal shows "ATM" (neutral)
3. Verify ✓✓ at that strike
4. Sell ATM call + Sell ATM put
5. Collect maximum premium
6. Exit at 30% profit or before expiry
Position: Short straddle or iron condor
Risk: Use defined risk (iron condor recommended)
🔔 Important Notes
Data Accuracy
Indicator uses TradingView's NSE options data feed
Always verify prices independently before trading
Ensure market is open (9:15 AM - 3:30 PM IST)
Check for "-" in cells indicating missing data
Expiry Management
Update expiry date every week on Thursday post-closing
Format: YYMMDD (6 digits)
Weekly expiry: Every Thursday
Monthly expiry: Last Thursday of month
Strike Format
NIFTY: Multiples of 50 (25850, 25900, 25950...)
BANKNIFTY: Multiples of 100 (51800, 51900, 52000...)
Wrong strikes = No data in table
Performance Optimization
Indicator updates every bar close
No lag or performance issues
Works on all timeframes (1m to 1D)
Maximum 5 calls + 5 puts = 10 security calls (within limits)
⚠️ Disclaimer
Trading options involves substantial risk of loss and is not suitable for all investors. This indicator is provided for educational and informational purposes only. It does not constitute financial advice, investment advice, or trading advice.
Important disclaimers:
Options can expire worthless, resulting in 100% loss
Past performance of signals is not indicative of future results
Accuracy depends on TradingView's NSE data feed
Signals are mathematical analysis, not predictions
You are solely responsible for your trading decisions
The developer is not liable for any trading losses incurred while using this indicator.
Before trading, ensure you understand:
Options Greeks (Delta, Gamma, Theta, Vega, Rho)
Implied volatility and its impact
Time decay and expiration risks
Assignment risk for short positions
Liquidity and slippage considerations
Margin requirements and capital needs
Always:
Use proper risk management (1-2% per trade)
Trade with capital you can afford to lose
Paper trade before live trading
Consult with a licensed financial advisor
Start with small position sizes
Never risk more than you can afford to lose
📊 Technical Specifications
Platform: TradingView Pine Script v6
Exchanges: NSE (National Stock Exchange of India)
Instruments: NIFTY, BANKNIFTY options
Timeframes: All (1m, 5m, 15m, 1h, 1D)
Strikes Analyzed: 5 calls × 5 puts = 25 combinations
Security Calls: 10 (5 calls + 5 puts)
Table Positions: 9 (all corners and centers)
Table Sizes: 6 (auto to huge)
Signal Modes: 3 (Smart, Momentum, Mean Reversion)
Performance: Optimized, minimal lag
🎯 Who Should Use This?
✅ Perfect For:
Options Traders: Intraday and positional
Premium Sellers: Option writers and theta strategists
Arbitrage Traders: Synthetic position builders
Straddle/Strangle Traders: ATM strategy traders
Professional Traders: Institutional-grade analysis
Volatility Traders: IV imbalance exploiters
Scalpers: Quick intraday moves
❌ Not Suitable For:
Stock options traders (NSE index-specific)
Equity-only traders (requires options knowledge)
International markets (NSE format only)
Complete beginners (requires basic options understanding)
💬 FAQ
Q: Why manual strike entry? Why not fully automatic?
A: Pine Script's type system limits fully automatic strike generation from live data. However, setup takes just 30 seconds once at market open, and the indicator handles all analysis automatically throughout the day.
Q: How often should I update strikes?
A: Rarely! Only when market moves 100+ points from initial ATM. Usually 0-2 times per day, even in volatile markets.
Q: Which Signal Mode is best?
A: Smart mode (default) for professional trading. Use Momentum for intraday scalping, Mean Reversion for premium selling.
Q: Can I use this for stock options?
A: No. The indicator is designed specifically for NSE index options (NIFTY and BANKNIFTY) with NSE format.
Q: Does it work on mobile?
A: Yes, but table display is optimized for desktop/tablet screens. Use "tiny" or "small" size on mobile.
Q: What if I see "-" in cells?
A: Check expiry format (YYMMDD), verify strikes match NSE strikes, and ensure market is open.
Q: What's the difference between ✓✓ and ✓?
A: ✓✓ = Best match (lowest price difference), highest quality. ✓ = Good matches (top 3-5), reliable quality.
Q: Can I backtest this indicator?
A: The indicator shows live analysis. For backtesting options strategies, you'll need historical options data and separate backtesting tools.
Q: What does the info box show?
A: Bottom-left box shows key metrics: symbol, signal mode, spot price, ATM strike, best matched strikes, match difference, and C-P value.
Q: Why no chart plotting?
A: v1.0 focuses on clean table display with maximum information density. Chart plotting may be added in future versions based on user feedback.
🙏 Credits
Developed by a professional options trader for the Indian trading community. Inspired by institutional trading desks and market makers who use call-put parity for daily trading decisions.
Found This Helpful?
⭐ Rate 5 stars if it improved your trading
💬 Comment with your strategy results
🔔 Follow for updates and new indicators
📢 Share with fellow options traders
Feature Requests
Continuous improvement based on trader feedback. Suggest features in comments!
Planned Features (v2.0):
Multi-expiry comparison
Greeks display (Delta, Theta, Vega)
Historical signal performance stats
Custom signal formulas
Export to CSV functionality
🏷️ Tags for Search
#Options #OptionsTrading #NIFTY #BANKNIFTY #NSE #India #OptionChain #CallPut #PutCallParity #Straddle #Strangle #ATM #TradingSignals #OptionsStrategy #PremiumSelling #OptionsScanner #Derivatives #IntradayTrading #VolatilityTrading #Arbitrage #SyntheticPosition #OptionsGreeks #OptionsSelling #OptionsWriting #IndianStockMarket #NSEOptions #OptionsAnalysis #TechnicalAnalysis #AlgoTrading #QuantTrading #ProfessionalTrading #TradingIndicator #PineScript #TradingView
📝 Version History
v1.0 (Current - Dec 2025)
Pine Script v6 implementation
Cross-strike matching (5×5 matrix, 25 combinations)
Three signal modes (Smart, Momentum, Mean Reversion)
Trading signal generation with color coding
Dynamic table positioning (9 positions)
Dynamic table sizing (6 sizes)
Intelligent text scaling
Semi-automatic ATM detection
Auto symbol detection
Simplified input system (50% fewer inputs in Auto mode)
Clean information display
Info box with key metrics
NSE NIFTY & BANKNIFTY support
Start trading smarter with institutional-grade options analysis! 📈💰🚀
Disclaimer: Options trading is subject to market risk. Please read all scheme-related documents carefully before investing.

Percentage Change Multi-Symbol Screener with Sorting featureThis indicator displays percentage price change (% change over previous candle) for up to 40 user-defined symbols in a dynamic table format. Each symbol can be customized through inputs, allowing users to monitor multiple instruments from a single chart.
A key feature of this script is Automatic Sorting . The table continuously updates in real time and rearranges symbols in ascending or descending order based on their % change values, making it easy to quickly identify relative performance across symbols.
The table refreshes automatically as market data updates, providing a clear and organized view without requiring manual interaction.
This script is intended as a market monitoring and visualization tool.
All examples, charts, scripts, indicators, or market discussions are strictly for demonstration, learning, and analytical purposes. No warranties or guarantees are made regarding accuracy, completeness, or future performance.
Feel free to share suggestions over improvements or report any issues you may encounter.

Hitjo Swing IndicatorTL;DR – READ THIS FIRST
This is a TWO-INDICATOR SYSTEM. Both indicators must be used together.
Hitjo Zones TF = WHERE you are allowed to trade
Hitjo Swing Trend = WHEN you are allowed to trade
Rules:
Only take BUY signals from Hitjo Swing Trend inside DEMAND zones from Hitjo Zones TF
Only take SELL signals from Hitjo Swing Trend inside SUPPLY zones from Hitjo Zones TF
Ignore signals when structure and timing do not align
Recommended setup: 1H chart with 4H or Daily zones.
Hitjo Swing Trading System
(Hitjo Zones TF + Hitjo Swing Trend)
This TradingView system combines higher-timeframe Supply & Demand zones with momentum-based swing entries to create a clean, rule-based swing trading framework.
It is designed for traders who want fewer but higher-quality trades, clear market structure, objective entry timing, and reduced overtrading.
Required Indicators
Hitjo Zones TF (Structure)
Automatically draws Supply & Demand zones using a selectable higher timeframe.
Displays SUPPLY and DEMAND labels when price enters key zones.
Defines where trades are allowed.
Do not trade based on zones alone.
Hitjo Swing Trend (Timing)
Displays BUY and SELL labels using EMA structure, momentum, and higher-timeframe trend.
Plots ATR-based stop loss and target levels.
Defines when to enter trades.
Do not take BUY or SELL signals outside zones.
Core Concept
Hitjo Zones TF tells you WHERE to trade.
Hitjo Swing Trend tells you WHEN to trade.
If both are not aligned, there is no trade.
Trading Rules
Long Trades
Take a BUY only when all conditions are true:
Price is inside or just above a DEMAND zone from Hitjo Zones TF
Higher-timeframe trend is bullish
A BUY label appears from Hitjo Swing Trend
There is room to target without immediately hitting resistance
Short Trades
Take a SELL only when all conditions are true:
Price is inside or just below a SUPPLY zone from Hitjo Zones TF
Higher-timeframe trend is bearish
A SELL label appears from Hitjo Swing Trend
There is room to target without immediately hitting support
Common Mistakes to Avoid
Buying just because DEMAND appears
Selling just because SUPPLY appears
Taking BUY or SELL signals in the middle of the chart
Counter-trend trading
Forcing trades on every signal
Stops and Targets
Hitjo Swing Trend plots:
Stop Loss using ATR (red)
Target using ATR (green)
These are visual guides only, not broker orders.
Recommended Setup
Chart timeframe: 1H
Zone timeframe (Hitjo Zones TF): 4H or Daily
Fast / Slow EMA: 8 / 21
ATR Stop / Target: 1.5 / 3.0
Remember This
DEMAND does not mean BUY
SUPPLY does not mean SELL
DEMAND + BUY = Long
SUPPLY + SELL = Short
Disclaimer
This system does not predict tops or bottoms and does not guarantee profits.
It is designed to help traders wait for alignment, reduce low-quality trades, and trade with structure.
Always manage risk appropriately.
TradingView Search Keywords
Supply Demand
Swing Trading
EMA Strategy
Multi Timeframe
Trend Following
Support Resistance
Momentum Trading
ATR Stop Loss
Crypto Trading
Stock Trading

Hitjo Zones TFTL;DR – READ THIS FIRST
This is a TWO-INDICATOR SYSTEM. Both indicators must be used together.
Hitjo Zones TF = WHERE you are allowed to trade
Hitjo Swing Trend = WHEN you are allowed to trade
Rules:
Only take BUY signals from Hitjo Swing Trend inside DEMAND zones from Hitjo Zones TF
Only take SELL signals from Hitjo Swing Trend inside SUPPLY zones from Hitjo Zones TF
Ignore signals when structure and timing do not align
Recommended setup: 1H chart with 4H or Daily zones.
Hitjo Swing Trading System
(Hitjo Zones TF + Hitjo Swing Trend)
This TradingView system combines higher-timeframe Supply & Demand zones with momentum-based swing entries to create a clean, rule-based swing trading framework.
It is designed for traders who want fewer but higher-quality trades, clear market structure, objective entry timing, and reduced overtrading.
Required Indicators
Hitjo Zones TF (Structure)
Automatically draws Supply & Demand zones using a selectable higher timeframe.
Displays SUPPLY and DEMAND labels when price enters key zones.
Defines where trades are allowed.
Do not trade based on zones alone.
Hitjo Swing Trend (Timing)
Displays BUY and SELL labels using EMA structure, momentum, and higher-timeframe trend.
Plots ATR-based stop loss and target levels.
Defines when to enter trades.
Do not take BUY or SELL signals outside zones.
Core Concept
Hitjo Zones TF tells you WHERE to trade.
Hitjo Swing Trend tells you WHEN to trade.
If both are not aligned, there is no trade.
Trading Rules
Long Trades
Take a BUY only when all conditions are true:
Price is inside or just above a DEMAND zone from Hitjo Zones TF
Higher-timeframe trend is bullish
A BUY label appears from Hitjo Swing Trend
There is room to target without immediately hitting resistance
Short Trades
Take a SELL only when all conditions are true:
Price is inside or just below a SUPPLY zone from Hitjo Zones TF
Higher-timeframe trend is bearish
A SELL label appears from Hitjo Swing Trend
There is room to target without immediately hitting support
Common Mistakes to Avoid
Buying just because DEMAND appears
Selling just because SUPPLY appears
Taking BUY or SELL signals in the middle of the chart
Counter-trend trading
Forcing trades on every signal
Stops and Targets
Hitjo Swing Trend plots:
Stop Loss using ATR (red)
Target using ATR (green)
These are visual guides only, not broker orders.
Recommended Setup
Chart timeframe: 1H
Zone timeframe (Hitjo Zones TF): 4H or Daily
Fast / Slow EMA: 8 / 21
ATR Stop / Target: 1.5 / 3.0
Remember This
DEMAND does not mean BUY
SUPPLY does not mean SELL
DEMAND + BUY = Long
SUPPLY + SELL = Short
Disclaimer
This system does not predict tops or bottoms and does not guarantee profits.
It is designed to help traders wait for alignment, reduce low-quality trades, and trade with structure.
Always manage risk appropriately.
TradingView Search Keywords
Supply Demand
Swing Trading
EMA Strategy
Multi Timeframe
Trend Following
Support Resistance
Momentum Trading
ATR Stop Loss
Crypto Trading
Stock Trading

Kriptano short sniperKriptano short sniper
An indicator for finding SHORT entry points after sharp price movements in the cryptocurrency market.
Features:
Pump Detector: Automatically detects price spikes on 15m, 30m, and 1h intervals with customizable thresholds.
Resistance Levels: Dynamic lines on 7 timeframes (5m-1W) with automatic deletion after a breakout.
Volume Profile: Volume distribution by price levels with a sentiment profile (bullish/bearish zones). Can help identify pump reversal points.
Kriptano short sniper
Индикатор для поиска точек входа в SHORT после резких ценовых движений на криптовалютном рынке.
Возможности:
Детектор пампа: автоматическое выявление скачков цены на интервалах 15m, 30m, 1h с настраиваемыми порогами
Уровни сопротивления: динамические линии с 7 таймфреймов (5m-1W) с автоудалением после пробития
Volume Profile: распределение объема по ценовым уровням с профилем настроений (бычьи/медвежьи зоны). Может помочь в определении точки разворота пампа.

True Three Soldiers Method (TTSM) - Breakout ConfirmationIndicator Overview
True Three Soldiers Method (TTSM) - Made in China is a quantifiable evolution beyond traditional candlestick pattern recognition. It replaces subjective visual analysis with an objective, data-driven momentum system featuring smart breakout confirmation.
Core Innovation: Beyond Traditional Pattern Recognition
Traditional three-soldier patterns merely check for three consecutive bullish/bearish candles. TTSM goes much deeper:
Dual Signal System: It identifies both single-candle and three-candle momentum signals, providing earlier warnings of potential trend changes.
Quantifiable Strength Metrics: Each signal must meet customizable thresholds for both absolute price movement (percentage change) and relative efficiency (close-to-open distance relative to total range).
Breakout Confirmation Logic: The real innovation lies in the "True Signal" mechanism. Preliminary signals are tracked, and only when price breaks above the highest high of recent bullish signals (or below the lowest low of recent bearish signals) does it trigger a confirmed entry signal. This eliminates false breakouts and ensures you're trading with confirmed momentum.
Absolute Strength: Quantifies momentum via percentage price change.
Relative Strength: Measures candlestick efficiency (close-to-open vs. total range).
True Signal Validation: A "True" entry signal triggers only after price confirms momentum by breaking above/below a cluster of recent preliminary signals, filtering out false moves.
Dual-Layer Signal System
Key Features
🔴 Amber Signals (Preparation): Single-candle or three-candle patterns that meet strength criteria. These indicate potential momentum building and can be used for preparation or light positioning.
🟢 Green Signals (True Breakout): Triggered only when price breaks above/below the recent signal cluster extremes. These represent confirmed momentum and are ideal for main entries.
🎚 Fully Customizable: Every parameter—absolute/relative strength thresholds, lookback periods, and average calculations—can be adjusted to match your trading style and market conditions.
📊 Clear Visual Feedback: Color-coded labels and reference lines make signal identification instant and intuitive.
Parameter Customization Guide
All parameters are organized in intuitive groups:
Strength Thresholds: Adjust absolute (%) and relative (%) strength requirements for both long and short signals.
First Signal Thresholds: Special thresholds for when a signal is the first in the lookback period.
Lookback & Averages: Control how many bars are considered for signal tracking and moving averages.
Strategic Application
Preparation Signals: Use amber signals to prepare for potential moves, set alerts, or enter with smaller positions.
True Signals: Green/red "True" signals indicate confirmed momentum—ideal for main entries with proper risk management.
Combination Strategy: Pair TTSM with trend indicators (like Supertrend) for higher probability trades—only take True Signals in the direction of the main trend.

Previous Time Based Dealing Ranges [Pro +] | cephxsPrevious Time Based Dealing Ranges 🧪
Visualize previous and current higher timeframe dealing ranges with dual-box OHLC representation, extending reference lines, and HTF candle displays.
OVERVIEW
This indicator displays time-based dealing ranges from higher timeframes directly on your chart. It shows the complete price action structure of previous (or current/forming) periods using a dual-box system: one box for the full High-Low range and another for the Open-Close body. Reference lines extend from key levels to help identify potential support, resistance, and mean reversion zones.
Perfect for traders who use ICT concepts, market structure analysis, or any methodology that relies on understanding where price has been relative to previous dealing ranges.
KEY FEATURES
Dual-Box Range Visualization: Each range displays two boxes - the full H-L range (outer) and the O-C body (inner) - giving immediate visual context of candle structure
Multiple Timeframes: Support for 4H, 6H, 1D, 1W, 1M, and 3M ranges
Previous/Current Mode: View completed ranges (Previous) or the forming range (Current) with real-time updates
Auto Mode: Automatically selects the appropriate range based on your chart timeframe
Reference Lines: Extending lines from High, Mid, Low (or Quadrants: H/75/M/25/L) with trade-into detection
HTF Candle Display: Visual HTF candles positioned to the right of price for context
6H Session Support: Session-aware ranges for Asia, London, NY AM, and NY PM with labeled names
Open Line: Vertical line marking the range's opening price/time
Imbalance Detection: Fair Value Gaps and Volume Imbalances highlighted on HTF candles
MODE OPTIONS
Previous/Current: Previous shows the last completed range. Current shows the forming range with dynamic H/L/C updates
Auto/Manual: Auto selects range by chart TF. Manual lets you choose specific ranges
Extend Box (Current): In Current mode, extends the box's right edge as price develops
AUTO MODE TIMEFRAME LOGIC
Chart < 15m → 6H Range
Chart 15m-1H → 1D Range
Chart 1H-6H → 1W Range
Chart 6H-1D → 1M Range
Chart > 1D → 3M Range
INPUTS
Mode
Mode: Previous/Current - Choose completed or forming range
Auto/Manual: Auto selects range by chart TF, Manual lets you choose
Extend Box (Current): Extends box right edge with price (Current mode only)
Previous Ranges
Range 1: Enable/disable, select timeframe (4H/6H/1D/1W/1M/3M), max display count
Range 2: Second range layer for multi-timeframe analysis
Reference Lines
Line Mode: Levels (H/M/L) or Quadrants (H/75/M/25/L)
Line Style: Solid, dashed, or dotted
Line Thickness: 1-4 pixels
Show Labels: Toggle reference line labels
Label Offset: Distance of labels from current price (1-20 bars)
HTF Candle Levels: Show mini H/M/L lines on HTF candles
Open Line: Vertical line at range open with customizable style
Range Boxes & Colors
Show Range Boxes: Toggle box visibility (lines remain visible)
Per-Range Colors: Customize box and line colors for each timeframe (4H, 6H, 1D, 1W, 1M, 3M)
HTF Candle Styling
Show HTF Candles: Toggle HTF candle display
Body/Border/Wick Colors: Customize bull and bear candle appearance
Padding/Buffer/Width: Control candle spacing and size
Labels
HTF Label: Show timeframe label above/below candles
Remaining Time: Countdown timer to candle close
Label Position: Top, Bottom, or Both
Label Alignment: Align across timeframes or follow individual candles
Imbalance
Fair Value Gap: Highlight FVGs on HTF candles
Volume Imbalance: Highlight VIs on HTF candles
HOW TO USE
Add the indicator to your chart
Choose Previous or Current mode based on your analysis preference
Use Auto mode for intelligent range selection, or Manual to select specific timeframes
Reference lines extend from range levels - watch for price reactions at H/M/L
In Current mode, observe how the range develops with real-time updates
Use the HTF candles on the right for quick multi-timeframe context
REFERENCE LINE LABELS
Labels follow this format:
Previous mode: pD-H (previous Daily High), pW-M (previous Weekly Mid), p6H-London-L (previous 6H London Low)
Current mode: D-H (Daily High), W-M (Weekly Mid), 6H-Asia-L (6H Asia Low)
6H SESSION NAMES
Asia: 18:00-00:00 ET
London: 00:00-06:00 ET
NYAM: 06:00-12:00 ET
NYPM: 12:00-18:00 ET
RECOMMENDED TIMEFRAMES
1-5 minute charts: 6H or 1D ranges
15-60 minute charts: 1D or 1W ranges
4H charts: 1W or 1M ranges
Daily charts: 1M or 3M ranges
Or simply use Auto mode to let the indicator choose the optimal range.
TIPS
The Mid (M) level often acts as equilibrium - watch for mean reversion plays
High and Low levels are more often than not, key to reversals
In Current mode, watch how price interacts with the forming range boundaries
Combine with your existing analysis for confluence
DISCLAIMER
This indicator is for educational and informational purposes only.
Past performance does not guarantee future results.
Always use proper risk management and never risk more than you can afford to lose.
Trading involves substantial risk of loss and is not suitable for all investors.
CREDITS
Original Base HTF candle Plotting Logic by fadizeidan. Put on Steroids by cephxs & fstarcapital.
CHANGELOG
Pro + v1.0: Added Previous/Current mode, 4H range, dual-box visualization, reference lines with trade-into detection, session-aware 6H labels, open line, Auto mode with intelligent TF selection

Put Call Relative StrengthPut–Call Relative Strength (PE/CE RS)
Description
Put–Call Relative Strength compares the premium movement of a Put Option (PE) against a Call Option (CE) to detect bearish pressure in the market.
It uses the ratio:
RS = PE / CE – 1
If Puts gain strength faster than Calls, RS turns positive — indicating bearish dominance.
A moving average line helps you understand trend strength and filter noise.
This is an ideal tool for traders wanting a clear, fast view of downside momentum and Put-led trend shifts.
How to Use
1️⃣ Select PE and CE Symbols
In settings → manually enter:
Put Option (PE)
Call Option (CE)
Same strike + same expiry recommended.
2️⃣ Interpret RS
RS > 0 (Green) → Puts stronger → Bearish bias
RS < 0 (Red) → Calls stronger → Bullish bias
3️⃣ Use RS MA to Confirm Trend
RS MA rising (Green) → Bearish strength increasing
RS MA falling (Red) → Bearish strength weakening
RS MA sideways (Gray) → Indecision / range
4️⃣ Best Use Cases
Intraday short setups
PE scalping
Confirmation for breakdowns
Identifying Put-led strength surges
Best for 1m–10m timeframes

Call Put Relative Strength Call–Put Relative Strength compares the premium movement of a selected Call Option (CE) against a selected Put Option (PE) to reveal the underlying market’s bullish strength.
It calculates a clean ratio:
RS = CE / PE – 1
When Calls are gaining strength faster than Puts, the RS turns positive — signaling bullish momentum.
A smoothing moving average adds clarity and filters intraday noise.
This is a powerful tool for intraday traders who want to quickly identify whether buyers or sellers are dominating the market.
How to Use
1) Select CE and PE Symbols
Open indicator settings → manually enter:
Call Option (CE)
Put Option (PE)
Use same strike + same expiry.
2) Interpret RS
RS > 0 (Green) → Calls stronger → Bullish bias
RS < 0 (Red) → Puts stronger → Bearish bias
3) Use RS MA for Trend Confirmation
RS MA rising (Green) → Strength increasing
RS MA falling (Red) → Strength weakening
RS MA flat (Gray) → Market neutral
4) Best Use Cases
Intraday trend confirmation
Scalping CE trades
Avoiding false long entries
Tracking CE/PE rotation strength
Works best on 1m–10m charts

Universe PACut through the noise: The "Universe PA" Strategy
You don't need to get lost in thousands of complex terms like Order Flow, PO3, or Judas Swing. This indicator is based on the purest and most effective form of Price Action: Simplicity.
The Core Philosophy: While many traders focus on old history, the real opportunity lies in the last valid break (BOS). We call this the "Magic Line". The key is the Supply/Demand zone that caused that specific break.
Key Features:
Magic Line (BOS): Automatically marks the level where structure is broken.
Auto Supply & Demand Zones: Identifies the origin of the move (Order Block) that caused the break and draws a zone.
Smart Clean: Keeps your chart clean by automatically removing old/invalid zones, focusing only on the latest opportunity.
Entry Signals: Detects Pinbar (P) and Engulfing (E) patterns to help you time your entry perfectly within the zones.
How to Use:
Identify the "Magic Line" break and the Zone on higher timeframes (e.g., H4).
Wait for price to return (retest) to the Zone.
Look for "P" or "E" signals inside the zone for confirmation.
Simplicity pays.

NIFTY RENKO OPTION CE/PENIFTY RENKO OPTION CE/PE ek non-repainting intraday Renko-based option direction indicator hai jo price action + money flow ko combine karke CE / PE buy signals generate karta hai.

Confluence Signal Intelligence Indicators (CSI Indicators)CSI - Confluence Signal Intelligence is a dual-oscillator analysis tool that combines two specialized indicators in a single pane. It provides visibility into cycle exhaustion and statistical deviation conditions to help identify potential turning points.
The Two Oscillators
CEI - Cycle Exhaustion Index (Upper Section)
CEI measures where price sits within its recent cycle range and detects momentum depletion states. It identifies moments when a move has stretched beyond typical levels, which historically have preceded mean-reversion.
Normalized range from -1.0 to +1.0
Configurable exhaustion thresholds
Reversal signals (REV) when extreme zones begin turning
Cycle wave overlay showing peak/trough phases
Stepped confluence indicator between sections
PRG - PDF Reversal Gauge (Lower Section)
PRG applies statistical transforms across multiple timeframes to measure deviation from price norms. It combines readings from primary and secondary periods to create a confluence assessment.
Multi-period analysis for timing and confirmation
Strong Confluence (SC) signals at statistical extremes
Confluence scoring when multiple periods align
Deviation bars showing distance from mean
Signal Types
CEI Signals:
REV - Reversal signal when exhaustion zone begins turning
Triangle markers - Entry into exhaustion zones
X markers - Extreme exhaustion levels
PRG Signals:
SC - Strong Confluence signal when threshold met
Triangle markers - Standard reversal signals
Diamond markers - Multi-period confluence alignment
Visual Design
The pane is divided into two distinct sections with a separator line:
Upper Section (CEI) - Cycle analysis with area fill and confluence stepping
Lower Section (PRG) - Statistical gauge with deviation bars
Color Coding - Gold for strong confluence, Green/Red for direction, Gray for neutral
Zone Backgrounds - Shaded areas marking overbought/oversold regions
Information Table - Real-time values, zones, confluence scores, and signals for both oscillators
Configuration
CEI Settings:
Cycle period and exhaustion lookback
Signal smoothing and sensitivity
Upper/lower exhaustion thresholds
Extreme level definition
PRG Settings:
Primary and secondary periods
Smoothing and extreme threshold
Confluence sensitivity
Strong confluence threshold
Multi-period confluence toggle
Layout Settings:
Adjustable vertical positioning
Independent scale factors for each oscillator
Separator position control
Alert Conditions
CEI Alerts - Bull/Bear reversals, extreme exhaustion levels
PRG Alerts - Strong confluence buy/sell, standard reversals
Combined Alerts - Both oscillators signaling together, strong combined confluence
Companion Indicator
CSI - Confluence Signal Intelligence is the main chart overlay that generates BUY/SELL signals with confidence classifications (HIGH/MEDIUM/LOW). This oscillator pane is designed to work alongside it, showing the cycle and statistical dynamics that contribute to signal generation.
When using both together:
Main CSI provides analytical signals directly on the price chart
This pane reveals the underlying CEI and PRG oscillator states
Aligned readings across both indicate stronger confluence
Reading the Pane
For potential long setups:
CEI in lower exhaustion zone (OS) and rising
PRG in oversold territory and turning up
REV or SC labels appearing
Both oscillators showing elevated confluence scores
For potential short setups:
CEI in upper exhaustion zone (OB) and falling
PRG in overbought territory and turning down
REV or SC labels appearing
Both oscillators showing elevated confluence scores
The oscillators may not signal on the exact same bar. When readings cluster within a few bars, this suggests developing conditions that warrant attention.
Risk Disclosure
This indicator measures technical conditions—not future price direction. Confluence scores represent analytical assessments based on statistical deviation and cycle position, not guarantees of market movement. All trading involves substantial risk of loss. Use this tool alongside your own analysis and proper risk management. No indicator can predict future price movements with certainty.
---
## AUTHOR'S INSTRUCTIONS:
```
To request access to CSI - Confluence Signal Intelligence , please send a private message or visit frontieralgo.com/tradingview.
For best results, use alongside the main CSI overlay on the price chart.

Confluence Signal Intelligence (CSI)CSI - Confluence Signal Intelligence is a professional-grade analytical overlay that evaluates market conditions across multiple dimensions simultaneously. Rather than relying on a single indicator, CSI synthesizes multiple evidence factors and classification models into unified BUY/SELL signals with confidence classifications.
What It Does
CSI identifies potential reversal zones by detecting when multiple independent analytical components align in the same direction. Each signal displays a confidence classification:
HIGH - Strong multi-factor alignment (Gold labels)
MEDIUM - Moderate factor alignment
LOW - Limited factor alignment
Important : The confidence level measures analytical consensus—not a prediction of trade outcome. A HIGH reading means multiple components agree on directional bias at that moment, not that the trade will be profitable.
Multi-Factor Analysis
The classification system evaluates conditions across several categories:
Statistical Extremes - Normalized price transforms that identify stretched conditions
Momentum Indicators - Multiple oscillators confirming oversold/overbought states
Cycle Analysis - Gauges measuring exhaustion and potential turning points
Trend Alignment - Multi-timeframe directional agreement
Market Structure - Break of Structure events and swing point analysis
Pattern Classification - Models comparing current conditions to historical setups
Volume Analysis - Confirming directional moves with participation
Divergence Detection - Price/momentum disagreements across multiple oscillators
Classification Components
CSI incorporates multiple classification models (KNN, gradient boosting approximation, perceptron) that analyze current market conditions against historical patterns. These models contribute to the overall confidence assessment by identifying setups with characteristics similar to past formations.
Smart Money Concepts
The indicator includes institutional trading concepts:
Break of Structure (BOS) - Markers when price violates significant swing points
Order Blocks - Potential support/resistance zones based on price structure
Fair Value Gaps (FVG) - Price imbalances that may act as future reference points
Regime Detection - Background coloring distinguishing trending vs. ranging conditions
Key Features
Non-Repainting Mode - Optional bar-close confirmation prevents signal changes on the current bar
Adaptive Thresholds - Automatically adjusts sensitivity based on market volatility
Signal Filtering - Option to hide LOW confidence signals to reduce noise
Configurable Cooldown - Minimum bars between signals to prevent overtrading
Comprehensive Dashboard - Real-time display of key metrics and states
Trend EMAs - 20/50/200 period moving averages for context
Extensive Alerts - Conditions for signals, structure breaks, divergences, and more
Intended Use
CSI is designed as a decision-support tool for traders conducting their own analysis. It identifies moments of technical alignment that may warrant further investigation—it does not guarantee profitable outcomes. Market results depend on numerous variables beyond any single analytical tool.
The indicator works across all markets and timeframes.
Companion Indicator
CSI - Confluence Signal Intelligence is published separately and displays the underlying oscillators in their own pane:
CEI (Cycle Exhaustion Index) - Cycle position and momentum depletion measurement
PRG (PDF Reversal Gauge) - Statistical deviation scoring
When used together, the main CSI overlay provides signals on the chart while the oscillator pane offers visibility into the cycle and reversal dynamics contributing to those signals.
Risk Disclosure
This indicator is an analytical tool—not financial advice. Past performance does not guarantee future results. All trading involves substantial risk of loss. Confidence levels reflect internal model agreement only and should be considered alongside broader market context, your own analysis, and sound risk management practices. No indicator can predict future price movements with certainty.
---
## AUTHOR'S INSTRUCTIONS:
```
To request access to CSI - Confluence Signal Intelligence, please visit frontieralgo.com/tradingview or send a private message.
