Only longs when Macd line is above Bollinger Band and shorts when Macd line is above Bollinger Band, this will avoid many problems. thumbs up!!!
- Climate volume detection - Relative volume value in bar - Automatic zone generation (possibility of configuration) - Additional features ¡¡¡Thumbs up¡¡¡
This script detects an event created by Oliver Velez, basically it is a wide-range candle, its range is noticeably larger than the previous candles, this event indicates a possible continuation of the movement, or the beginning of an extended movement. The candle has to be of good body, as a rule it can be taken that the body must be more than 70%. The stop goes...
This RSI has a very clear idea about when to buy and sell. It plots buy and sell signals. It is an expert system. Yes, of course, it can make some errors. You should have used stop-loss
This strategy allow the user to move the EMA which control the Buy&Sell Strategy and show the EMA ribbon that can be found in the Template area. Buy showing the ribbon and letting the user to adjust the EMA signaling the B&S strat the user can create an elaborated strategy for buyPoint and sellPoint. The 35EMA Cross is choosen by default but I recommend to move...
This is a Buy And Sell Strategy I haven't seen anywhere so i share mine. Used on Bitcoin - daily chart - the strategy generate sell and buy indicator on crossover and crossunder the 150 simple moving average.
This gives to you buy-sell signal with MACD's histogram trends. Use "Fast and Slow length" and "Trend of Histogram Number" inputs to take less or more signal. "Trend of Histogram Number" : This means how many histogram bars the trend continues before trading.
This gives to you buy-sell signal with MACD histogram value. Use "Fast and Slow length" and "Buy or Sell Histogram Value" inputs to take less or more signal.
This strategy is just for training, its purpose is just learning code in pine script. Don't make buy or sell decision with this strategy. Turkish/Turkce Bu strateji sadece pine script'te kodlamanın nasıl yapildigini ogrenmek icindir. Bu stratejiye dayanarak, kesinlikle al-sat islemleri yapmayin. How it works? When RSI and Stoch are in oversold area and if...
Mayer Multiple developed by Trace Mayer gives the ratio of price to 200 daily moving average. Buy when it's white sell when it's orange. Is intended for use on day chart only. This is an extension of the Mayer Multiple developed by Trace Mayer. Normally you only have 2 thresholds signaling buying or selling (blue and yellow). However, I added 2 more...
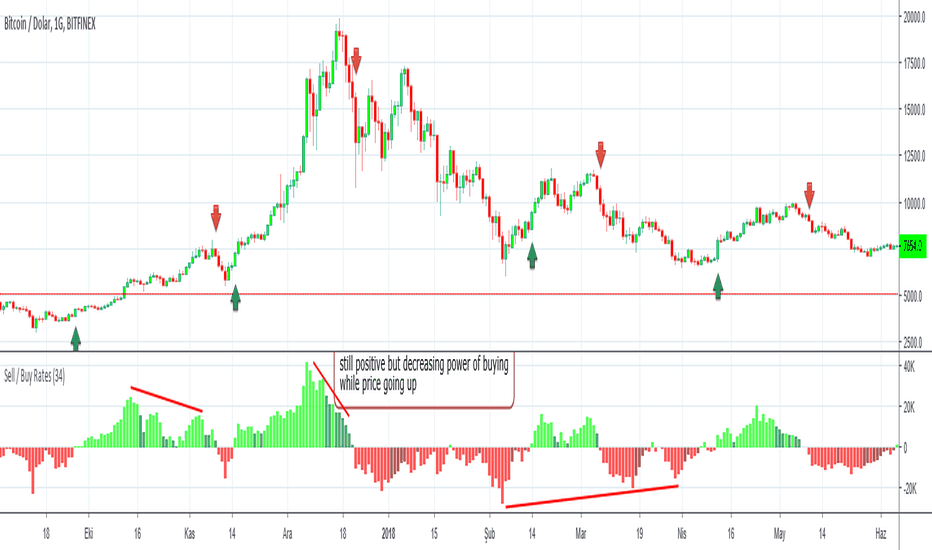
This script finds sell / buy rates and adds its linear regression to the chart. its aim is finding buying and selling power, then you can try to find trend reversals. Also you can find divergences, it's very important signal for trend reversal. Linear regression is a basic and commonly used type of predictive analysis. if you choose lower periods then it will be...
Combo of many useful indicators which includes fib lines, time and money channels and divergence buy sell signals Credits for source code: Scarf, Lazybear, 100kiwi
Combo of many useful indicators modified to suit dark theme, contains 1)Regular and Hidden Divergence Buy and Sell signals by scarf 2)Time and Money channels by Lazybear 3)Fibonacci Bollinger Bands by Rashad 4) Linear Regression Curve by ucsgears Thanks for all the creators for the source codes!
Combo of many useful indicators modified to suit dark theme, contains 1)Regular and Hidden Divergence Buy and Sell signals by scarf 2)Time and Money channels by Lazybear 3)Fibonacci Bollinger Bands by Rashad 4)Linear Regression Curve by ucsgears Thanks for all the creators for the source codes!
Combo of many useful indicators, contains 1)Regular and Hidden Divergence Buy and Sell signals by scarf 2)Time and Money channels by Lazybear 3)Fibonacci Bollinger Bands by Rashad 4)Linear Regression Curve by ucsgears Thanks for all the creators for the source codes!
//@version=2 //By Tantamount //Channel Commodity Index (CCI) with overbought and oversold alert features! Highly configurable indicator that includes a Topography map feature, used to detect & show minute threshold crosses. //CCI is a momentum based technical trading tool used to help determine when an asset is reaching an overbought or oversold condition and is...
Hello traders! This indicator was originally developed by Daniel Fernandez (Currency Trader magazine, 2011). It is based on the two well-known indicators by Dr. Alexander Elder - Bulls Power and Bears Power. Signals 1) Long when Bull and Total lines indicate 100 (it happens rarely) 2) Short when Bear and Total lines indicate 100 (it happens rarely) 3) Bull...


![35EMA Cross BuyAndSell Strategy + RIBBON [d3nv3r] BTCUSD: 35EMA Cross BuyAndSell Strategy + RIBBON [d3nv3r]](https://s3.tradingview.com/t/TTFj18YS_mid.png)
![150MA Cross BuyAndSell Strategy [d3nv3r] BTCUSD: 150MA Cross BuyAndSell Strategy [d3nv3r]](https://s3.tradingview.com/n/Nn2bCfC7_mid.png)


![Mayer Multiple Optimal Multi-Color Histogram [aamonkey] BLX: Mayer Multiple Optimal Multi-Color Histogram [aamonkey]](https://s3.tradingview.com/x/XJR8R4XR_mid.png)


