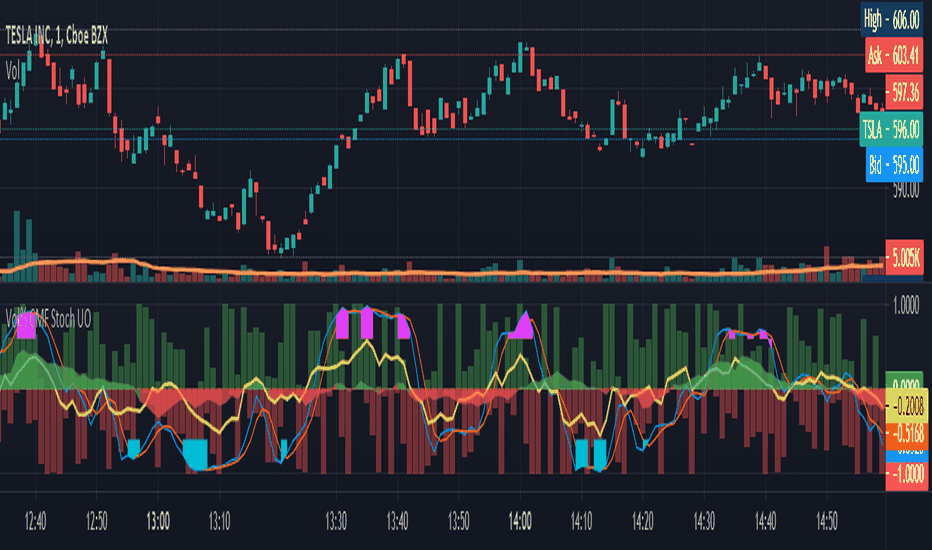
First of all the biggest thanks to @tista and @KivancOzbilgic for publishing their open source public indicators Bayesian BBSMA + nQQE Oscillator. And a mighty round of applause for @MarkBench for once again being my superhero pinescript guy that puts these awesome combination Ideas and ES stradegies in my head together. Now let me go ahead and explain what we...
Plots % Buy / Sell Volume , Chaikin Money Flow , Stochastic Oscillator, and Ultimate Oscillator on same axis, bound -1 to 1. Show Volume Percentage, displaying buying as green and positive, selling as red and negative. Showing the CMF, with green / red fill for positive / negative values. Modified Stochastic Oscillator, converting bounds to -1 and 1, moving...
Showing the CMF, with green / red fill for positive / negative values, overlaid with Volume Percentage, displaying buying as green and positive, selling as red and negative.
Shading the area of positive CMF with green and negative with red.
This signal combines a portion of Chris Moody's 2014 SlingShot and my 2017 MTF Indicators. Both of our prior scripts over indicated Buy and Sell Points. This signal indicates a buy or sell point much less than our prior scripts did but with absolute precision. I would say it is 100% accurate, but that is because I am yet to find a timeframe and symbol where the...
Escaping of Rate from Average By Mustafa OZVER This code shows a location of a rate or price (or etc.) from the average, rated by the standard deviation. To show that, calculates the ema and standard deviation of our data then calculates the distance between ema and the current data by the standard deviation. In summary, we can say that this value is the current...
This is a Moving Average based indicator that is inspired by the MACD indicator. The indicator is intended to indicate trend reversals, and works best in hourly charts (1h-2h-3h-4h). The Seri Indicator is easy to interpret, which was one of the design goals. If the Fast Moving Average (Green Line) crosses ABOVE the Slow Moving Average (Red Line), it indicates a...
Firstly I'd like to state that this script's ATR buy/sell source is from the public script library here: Additionally with the buy/sell signals from the original script, two more buy/sell conditions were added to give more entries/scaling in or out options. On top of that, two SMA lines were added, a 1 day moving average and a 5 day moving average. This script...
This strategy trial is let you to giving sell and buy orders with ATR (average true range) and an coefficent for them. it is my first strategy work, needs to be upgraded. USE IT WITH YOUR OWN RISK. IT IS NOT EVEN GUARANTEED TO WORK.
This indicator is elaborated following the 3 window strategy described by Elder. The fast, slow averages and MACD histogram are taken from a time frame 5 times higher than the active time frame and indicate bullish / bearish trends as well as divergences (bottom) of the hostogram with the price.
Based on logic from many top contributors here, the script utilizes LazyBear's WaveTrend Oscillator Indicator along with custom code to plot a few key components for daily trading; Boundaries for entry and exit points which are based on a 6-day trend in OPEN/HIGH and OPEN/LOW prices. Daily HIGH and LOW points to establish a good view of stock's movements ...
Clear indication of market up and down trend so that you can stick to Buy or Sell strategy based on RSI.
"KINSKI Buy-Sell Signal" is an Average True Range (ATR) based trailing stop indicator. In this version, you can change the ATR calculation method using the settings. The default method is hlc3. The HLC stands for High, Low, Close and the /3 divides the result by 3 to give you the average. The indicator calculates the buy and sell signals using HLC3, Simple...
Every script follow a pattern in their price cycle. This can be defined by division of price cycle. Division line will act as pivot point.Above this bar this any price movement is indication of bullish trend while below this line any price movement is indication of bearish trend. This Nik price signal will give great result in combination of magicsignal which is...
The objective is only to evaluate different configurations of the indicator "Follow Line MTF Any MM Average". The strategy does not have position management, it's very basic, this indicator should be used to see trend, range zones, evaluate the best areas to enter the market, use higher time frames to confirm a direction can be useful. I do not recommend using...
The original version uses SMA, in this new version you can choose any type of MA and time frame. - RMA,SMA,EMA,WMA,VWMA,SMMA,KMA,TMA,HullMA,DEMA,TEMA,CTI - 1 min, 3 min, 5 min, 15 min, 30 min, 45min, 1h, 2h, 3h, 4h, 1d, 1w, 1M - Alerts Combine multiple time frames, this will come in handy ¡¡¡¡ Success in your trade ¡¡¡¡
The objective is only to evaluate different configurations, I do not recommend using only this indicator to trade, because you can lose all your money if you do not know what you are doing. I hope you find it useful. Successes
The FollowLine indicator is a trend following indicator. The blue/red lines are activated when the price closes above the upper Bollinger band or below the lower one. Once the trigger of the trend direction is made, the FollowLine will be placed at High or Low (depending of the trend). An ATR filter can be selected to place the line at a more distance level than...


