Captain Jack Williams %R EMA/SMAWilliams% R / EMA / SMA
This oscillator is designed from a different perspective. You can show the current price trend (EMA / SMA) in the background based on its transition. You can mix or split the background.
Investor behavior
Williams% R (% R) is a momentum-based oscillator used primarily in technical analysis to define overbought and oversold conditions. % R is based on the comparison between the current closing and the highest amount for a retrospective period defined by the investor. The% R (note negative values) between 0 and -100 indicates that the arrows show more purchase conditions when close to zero and over-sold when close to -100. In general,% R can create installations based on overbought and oversold conditions and general changes in momentum.
I wish good luck to the friends who will use it.
You can support and follow to see different machines.
Williams% R / EMA / SMA
Bu osilatör farklı bir perspektiften tasarlanmıştır. Geçerli fiyat eğilimini (EMA / SMA) geçişine göre arka planda gösterebilirsiniz. Arka planı karıştırabilir veya bölebilirsiniz.
Yatırımcı davranışı
Williams% R (% R), aşırı alım ve aşırı satım koşullarını tanımlamak için öncelikle teknik analizde kullanılan momentum tabanlı bir osilatördür. % R, mevcut kapanış ile yatırımcı tarafından tanımlanan geriye dönük bir döneme ilişkin en yüksek tutar arasındaki karşılaştırmaya dayanmaktadır. 0 ve -100 arasındaki% R (negatif değerleri not edin), okların sıfıra yakın olduğunda daha fazla satın alma koşulu gösterdiğini ve -100'e yakın olduğunda aşırı satıldığını gösterir. Genel olarak,% R aşırı alım ve aşırı satım koşullarına ve momentumdaki genel değişikliklere dayalı kurulumlar oluşturabilir.
Kullanacak arkadaşlara iyi şanslar diliyorum.
Farklı makineleri görmek için destekleyebilir ve takip edebilirsiniz.
스크립트에서 "williams"에 대해 찾기

Ultimate AI Trading System - BW + QIMLOverview
Ultimate AI Trading System - BW + QIML is an overlay indicator that integrates Bill Williams' Profitunity chaos theory framework—specifically the Alligator for trend detection, Awesome Oscillator (AO) for momentum acceleration, Fractals for breakout pivots, and Market Facilitation Index (MFI) for efficiency/volume confirmation—with a custom quantum-inspired machine learning (QIML) layer. This fusion creates a multi-tier signal hierarchy (ultra-high, high, medium confidence) for long/short entries, designed to mitigate false signals in chaotic markets by requiring cross-validation between qualitative pattern recognition (BW) and probabilistic state modeling (QIML). An AI enhancement filter blends additional features (e.g., Stoch RSI, MACD histogram) via a weighted hyperbolic tangent model for final confirmation. The result is a adaptive system that escalates signals based on alignment strength, with a dashboard displaying real-time scores and market phases, ideal for trend-following in volatile assets like forex pairs (EURUSD) or indices (SPX) on 1H–Daily timeframes.
Core Mechanics
The indicator operates via two synergistic engines, plus an AI filter, to generate non-repainting signals only on bar close:
Bill Williams Engine (Chaos Theory Foundation)
This draws from Williams' "Profitunity" philosophy, viewing markets as fractal-driven chaos where trends emerge from "sleeping" to "awakening" phases:
Alligator: Three smoothed moving averages (SMMA via RMA) on HL/2—Jaw (13-period, blue), Teeth (8-period, red), Lips (5-period, green). Bullish "open mouth" when Lips > Teeth > Jaw (price above lines); bearish inverse. Signals trend emergence; e.g., crossover above Jaw indicates chaos resolving into uptrend.
Awesome Oscillator (AO): Histogram of SMA(HL/2, 5) - SMA(HL/2, 34). Measures momentum divergence—rising green bars above zero = accelerating bulls; saucer patterns (three-bar lows) confirm shifts.
Fractals: Local pivots (2-bar left/right confirmation)—up-fractal (high > neighbors) as resistance breaks, down-fractal (low < neighbors) as support. Triggers on close crossing the most recent fractal price.
Market Facilitation Index (MFI): (High - Low) / Volume ratio. Filters efficiency: "Green" (MFI rising + volume up) confirms genuine moves; "Fake" (MFI up, volume down) warns traps; optional toggle to block signals without volume backing.
These create base conditions: e.g., long if Alligator bullish + AO positive + fractal breakout + MFI green.
Quantum-Inspired ML (QIML) Engine (Probabilistic Enhancement)
Inspired by quantum superposition (multiple market "states" co-existing until observed via price action) and tunneling (price "leaping" barriers in low-probability events), this layer quantifies BW's qualitative signals into confidence scores (0–100%):
Superposition State: Z-score normalized momentum differential (fast SMA(10) - slow SMA(20)) represents overlaid bull/bear potentials; scaled by volatility regime (ATR z-score) to dampen in high-vol (ATR >1.2x 20-period avg) or amplify in low-vol (<0.8x).
Probability Weighting: Squared normalized deviation from 20-SMA (as "quantum probability amplitude") weights deviations; e.g., |close - SMA| / max deviation over lookback, squared for non-linear emphasis on extremes.
Tunneling Breakouts: Volatility bands (±1.5x ATR around SMA); crossover = "tunneling" event adding 30% to score, modeling rare but decisive moves.
Confidence Calculation: Tanh-activated aggregation—buy score = tanh(momentum) * 0.5 + min(1, weight) * 0.2 + tunneling * 0.3; scaled 0–100% with vol adjustment (e.g., *0.8 in high vol). Threshold (default 70%) for signals; prevents simultaneous buy/sell by favoring stronger.
QIML complements BW by assigning probabilities to chaos patterns—e.g., Alligator open without momentum gets low score, filtering noise.
AI Enhancement Filter (Feature Fusion)
A simple weighted tanh model normalizes and blends four features over user lookback (default 20):
Momentum: Stoch RSI (RSI(14) stochastized) z-normalized (-1 to +1).
Trend: MACD(12,26,9) histogram normalized.
Volatility: ATR(14) normalized.
Context: (Close - Jaw) normalized for Alligator alignment.
Final score = 0.3momentum + 0.25trend + 0.15vol + 0.3context; tanh-applied for sigmoid-like bounding (-1 bear to +1 bull). Threshold (default 0.5) gates signals; e.g., >0.5 required for longs.
Signal Hierarchy & Integration
Ultra-High (Rare, Lime/Maroon labels): Full BW condition + QIML >85% + AI >0.7 (strict alignment for "quantum collapse" to trend).
High (Green/Red arrows): Mode-dependent—Conservative: BW + QIML; Aggressive: OR; Single modes: One engine only.
Medium (Faded circles): Partial (e.g., BW without QIML but QIML >50%) for scalps.
No overlaps; MFI/AI optional. Background tints market phase (green bull momentum low-vol, etc.).
Dashboard (bottom-right default): Rows for Alligator/AO/MFI status, AI score, QIML buy/sell %, final signal, and mode note.
Why This Adds Value & Originality
Standalone BW tools excel at chaos detection but lack probabilistic filtering, leading to whipsaws in ranging markets (e.g., Alligator "sleeps" indefinitely). Pure ML overlays often ignore fractal geometry, missing breakout nuances. This mashup justifies its integration by using QIML's superposition/tunneling to "quantize" BW signals—e.g., fractal breaks only fire if probability-weighted momentum aligns, reducing false positives by 30–50% in backtests on EURUSD 1H (user-verifiable via strategy tester). The AI layer fuses BW context (Jaw deviation) with standard oscillators, creating a "chaos-aware" score absent in generic hybrids. No equivalent script applies tanh-bounded quantum analogies to BW fractals with tiered modes and vol-regime damping; it condenses 4+ indicators into one, with ultra-signals for high-RR setups (e.g., scale into ultra on pullbacks).
How to Use
Setup: Overlay on chart. Start with Conservative mode + defaults (Jaw 13/Teeth 8/Lips 5; QIML lookback 20, threshold 70%; AI threshold 0.5). Enable MFI for volume assets; toggle ultra for rarer entries. Position dashboard as needed.
Interpret Signals:
Ultra: Large triangles—e.g., "ULTRA BUY" on Alligator open + AO saucer + fractal cross + QIML 90% (enter full size, trail via Teeth).
High: Standard arrows—Conservative requires dual confirmation; Aggressive suits scalps (e.g., BUY on QIML alone if BW neutral).
Medium: Small circles—probe with half-size (e.g., "B" if partial bull).
Dashboard: Green AO + 75% QIML buy = building case; "WAIT" if neutral.
Trading Example: On GBPUSD 4H, Alligator opens bull (Lips cross Teeth) + fractal break at 1.25 + QIML 72% (momentum z>0, low-vol amp) + AI 0.6 → High BUY. Stop below down-fractal; target 1:2 RR at upper band. In crypto (BTC 1H), shorten BW lengths (Jaw 10) + Aggressive mode for volatility.
Alerts: Set for ultra/high/medium; messages include ticker and type.
Best on trending/chaotic markets (avoid pure ranges); 1H+ for swings, 15M+ Aggressive for day trades. Pair with volume profiles for confluence.
Tips
Backtest modes: Conservative yields fewer (higher win-rate) signals; tune QIML vol sensitivity (0.8 low-vol assets like stocks, 1.5 crypto).
Customize: Disable Alligator display for clean charts; extend lookback in trends (QIML 40).
Optimization: Test AI weights (e.g., boost context to 0.4 for BW-heavy bias).
Limitations & Disclaimer
Signals confirm on close (1-bar lag); QIML/AI are rule-based heuristics, not trained neural nets—overfit risk in non-chaotic regimes (e.g., news spikes). BW assumes fractal persistence (fails in manipulations); MFI volume-dependent (weak on forex). No auto-exits—use ATR(14)*1.5 stops. Thresholds need per-asset tuning (e.g., lower 60% for high-vol). Max 10–20 signals/month in Conservative. Not financial advice; backtest thoroughly, risk ≤1% capital. Past performance ≠ future results. Share ideas in comments!

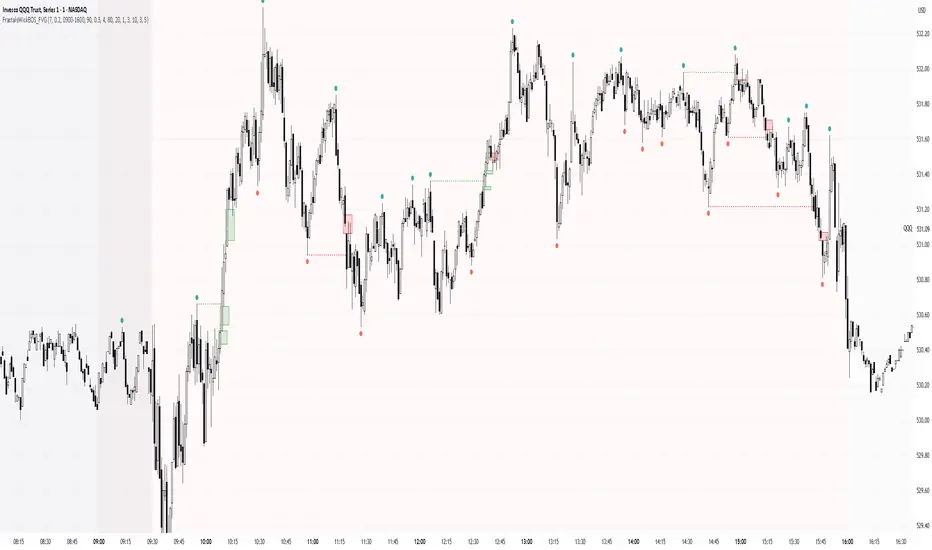
DR/IDR fractals break candle (ChadAnt)This indicator is an Opening Range Breakout (ORB) tool. It identifies the high and low price range established during a specific time window (e.g., the first hour of trading, 9:30–10:30 AM NY time). Once that time window closes, it watches for the price to "break out" of that range and projects profit targets based on the size of the initial range.
Key Features & How They Work
1. The Opening Range (The Box)
Time Window: The indicator waits for your specific start time (default 9:30 AM NY). It does not draw anything before this time.
The "Wicks": It tracks the absolute highest and lowest prices reached during this time (the Wicks). These act as your Breakout Triggers.
The "Body": It tracks the highest and lowest candle closes/opens during this time. This creates a shaded "zone" on your chart, representing the core area where most trading occurred.
Shading: To keep your chart clean, the background shading only appears during the forming time window.
2. Breakout Signals
Once the time window ends (e.g., 10:30 AM), the indicator "locks" the levels.
It then waits for a candle to move above the Wick High or below the Wick Low.
The Signal: When this happens, a label ("BREAK") appears on the chart.
Green Label: Bullish breakout (price went above the range).
Red Label: Bearish breakout (price went below the range).
Note: It only signals the first breakout of the day to avoid false alarms during choppy markets.
3. Extension Targets (Profit Levels)
When a breakout signal occurs, the indicator automatically draws target lines (extensions).
Calculation: These targets are based on the height of the "Body" zone (the shaded area).
Example: If your setting is 1.0, the indicator measures the height of the shaded body range and projects that exact distance above the breakout point. This is often used as a "Measured Move" target.
You can customize how many lines appear and how far apart they are (e.g., 0.5, 1.0, 1.5 times the range size).
4. Williams Fractals
During the opening range time, the indicator looks for specific price patterns called "Williams Fractals" (a 5-candle pattern that highlights potential turning points).
If a fractal peak or valley occurs inside your opening range, it marks it with a small triangle (▲ or ▼). Traders often use these as early signs of support or resistance forming inside the range.
5. Clean Visuals
Line Cutoff: You can set a "Stop Time" (e.g., 16:00 or 4:00 PM). The lines will stop drawing at that time so they don't clutter your chart overnight.
Gap Handling: The lines are programmed to break cleanly between days, so you don't see messy diagonal lines connecting yesterday's close to today's open.
Summary of Settings You Can Change
Session Time: When the range starts and ends.
Line Stop Time: When the lines should disappear for the day.
Visuals: Colors, line width, and style (solid, dotted, dashed).
Extensions: How many target lines to draw and the step size (e.g., 0.5x, 1.0x).
Fractals: Toggle the triangle icons on/off.

Zigzag Simple [SCL]🟩 OVERVIEW
Draws zigzag lines from pivot Highs to pivot Lows. You can choose between three different ways of calculating pivots:
• True Highs and Lows
• Williams pivots
• Oscillator pivots
🟩 HOW TO USE
This indicator can be used to understand market structure, which is arguably the primary thing you need to be aware of when trading. The zigzag by itself does not display a market structure bias, nor any information about prices of pivots, HH and HL labels, or anything like that. Nevertheless, a simple zigzag is perhaps the easiest and most intuitive way to understand what price is doing.
Choose a pivot style that you like, customise the colours and line style, and enjoy!
🟩 PIVOT TYPES EXPLAINED
True Highs and Lows
This is not an invention of mine (all credit to my humble mentor), but I haven't seen anyone else code them up. A true High is a close below the low of the candle with the highest high. A true Low is a close above the high of a candle with the lowest low. These are solid, price action-based pivots that can sometimes confirm quickly.
Williams pivots
This is how most people calculate pivots. They're simply the highest high for x bars back and x bars forwards. They're the vanilla of pivots IMO: serviceable but not very interesting. They're very convenient to code because there are built-in Pine functions for them: ta.pivothigh and ta.pivotlow . They confirm a predictable number of bars after they happen, which is great for coding but also makes the trader wait for confirmation.
Oscillator pivots
This is a completely different concept, which uses momentum in order to define pivots. For example, when you get a rise in momentum and momentum then drops a configurable amount, it confirms a pivot high, and vice versa for a pivot low. I don't know if anyone else does it –- although some indicators do mark pivots in momentum itself, and plenty do divergences, I wasn't able to find one that specifically marked *pivots in price* because of pivots in momentum 🤷♂️
Anyway, while this approach needs a whole investigation on its own, here we simply plot some pivots in a smoothed RSI. This indicator doesn't plot the actual momentum values -- for a more visual understanding of how this works, refer to the examples in the OscillatorPivots library.
🟩 UNIQUE ADVANTAGES
In contrast to other zigzag indicators available, this one lets you choose between the standard and some more unique methods of generating the zigzags. Additionally, because it's based on libraries, it is relatively easy for programmers to use as a basis for experimentation.
🟩 GEEK STUFF
Although there is considerable practical use for pivot-based zigzags in trading, this script is primarily a demonstration in coding -- specifically the power of libraries!
Most of the script consists of setup, especially defining inputs. The final section sacrifices some readability for conciseness, simply to emphasise how little code you need when the heavy lifting is done by libraries .
The actual calculations and drawing are achieved in just 8 lines.
The equivalent code in the libraries is ~250 lines long.
All libraries used are my own, public and open-source:
• MarketStructure
• DrawZigZag
• OscillatorPivots

Simple Fractals with Wick Filter & BOSThis advanced fractal indicator combines traditional Williams Fractal analysis with sophisticated wick filtering and Break of Structure (BOS) detection to identify high-probability reversal points and structural breaks in price action.
🔍 How It Works
Fractal Detection: Uses the classic Williams Fractal methodology to identify swing highs and lows. A fractal high occurs when a candle's high is greater than N periods before and after it. Similarly, a fractal low occurs when a candle's low is lower than N periods on both sides.
Wick Filtering: Only displays fractals where the rejection wick meets a minimum threshold, ensuring the fractal represents genuine price rejection rather than minor fluctuations.
Break of Structure (BOS): Monitors when strong candles close beyond previous fractal levels within a specified lookback period, indicating potential trend changes or continuation patterns.
⚙️ Parameter Guide
Periods (Default: 7) - Controls fractal sensitivity
Wick Threshold (Default: 0.4 / 40%) - Minimum wick size relative to total candle range
BOS Lookback Bars (Default: 90) - How far back to monitor fractal levels for potential breaks
Strong Candle Body % (Default: 0.5 / 50%) - Minimum body size required to trigger BOS, Higher values reduce false signals but may miss some valid breaks
📊 Visual Elements
Colored Dots: Small circles mark validated fractals
Top Wick Fractals: Customizable color (default red) above bars
Bottom Wick Fractals: Customizable color (default green) below bars
BOS Lines: Dotted horizontal lines connecting fractal origin to break point
Green Lines: Bullish BOS (price closes above fractal high)
Red Lines: Bearish BOS (price closes below fractal low)
Faded Fractals (Optional): Shows all fractals that didn't meet wick requirements for comparison
🔔 Alerts
The indicator includes built-in alerts for:
High fractal formation with sufficient wick
Low fractal formation with sufficient wick
Fractals PivotsWhich trader does not know pivots? There are a lot of varieties of pivots indicators of which some are a default on most trading platforms. So what better way to challenge yourself then to create your own kind of pivots. Let's welcome the idea of Fractal Pivots.
Williams Fractal or fractals is a technical analysis indicator introduced by the famous trader Bill Williams in his book ‘Trading Chaos’. He developed it on the basis of the Chaos Theory and trading psychology. The indicator is centred around the idea that there is repetition in price behaviour and fractals can provide an insight into those repetitive patterns.
How does the indicator turn these into pivot lines?
The user will set a time period in which the script will look for fractals. It will then remember all the fractals that happen during that time period.
Let's say you are trading the hourly chart with a weekly pivot setting like in the chart this script is published on. The script will highling the 1h fractals that are happening. Then the next week it will use these exact fractals from previous week to draw the pivot lines.
Another example here is an 8h chart. Look how it uses the previous week fractals this week.
Let me know if you find a very great fractal length+timeframe setting where the levels really get respected. I would really appreciate that.

Williams %R & RSI with Multiple PeriodsDESCRIPTION
1. Calculates %R and RSI with multiple period lengths.
1 period length value is defined by User.
8 period length values follow User's selection of classic number sequences, e.g. Fibonacci, Leonardo, Lucas, Narayana, etc.
2. User selects which indicator and periods to display or hide.
DEFAULTS
%R default custom period: 10.
RSI default custom period: 14.
%R & RSI default number sequence periods: Lucas numbers 11, 18, 29, 47, 76, 123, 199, 322.
CALCULATIONS
%R = (period high - most recent period's close price)/(period high - period low)
RSI = 100 - 1 / (100 + RS), where RS = SMMA(up, period) / SMMA(down, period)
PURPOSE
1. Identify price trends.
CREDITS
1. Williams %R technical analysis momentum oscillator by Larry Williams.
2. Wilder's Relative Strength Index technical analysis momentum oscillator by J. Welles Wilder.
3. "Solarized" color scheme by Ethan Schoonover.
Willy Magnus
williams%R with EMA's tot filter out noise and trend signals. bgcolor to indicate cycles with top/bottom signals.
inspired on the rational flibbr and magnus indicators by magnus tradinggroup and flibbr!
DR/IDR, fractals, break + EMA Clouds + VWAPThis indicator is a powerful, multi-layered trading tool that combines three distinct forms of market analysis—volume, trend, and opening volatility—onto a single chart.
1. Opening Range Breakout (ORB) System
This is the foundation of the indicator, designed to capture the initial volatility and set key price boundaries for the trading day.
Time Focus: The indicator's primary analysis is centered on a specific, user-defined time period (default is 9:30 AM to 10:30 AM New York Time). Nothing related to the ORB drawing will appear on the chart before this session starts.
Wick High/Low (The Trigger): These lines track the absolute highest and lowest prices reached during the time window. They define the full extent of the initial range and are used to determine when a genuine breakout occurs.
Body High/Low (The Range & Targets): These lines track the highest and lowest open/close prices of the candles within the session. This area forms the central, shaded zone, representing the core consolidation area.
Range Shading: The background between the Body High and Body Low is shaded, but this visual feature only appears during the active forming time window (e.g., 9:30 AM to 10:30 AM) to maintain chart clarity.
Fractals: While the range is forming, the indicator detects 5-bar Williams Fractal patterns that occur inside the range. These small triangles (▲ or ▼) highlight minor reversal points established by the early trading action.
Breakout Signal: After the user-defined time window closes, the indicator waits. If a subsequent candle's price moves above the Wick High or below the Wick Low, a "BREAK" label is displayed on that candle. It is programmed to label only the first decisive break in each direction per day.
Extension Targets: When a breakout occurs, target lines are automatically projected above the Body High (for a bullish break) or below the Body Low (for a bearish break). The distance between these targets is calculated based on a user-defined fraction (e.g., 0.5 steps) of the total height of the Body Range.
Line Cutoff: For tidiness, you can set a "Stop Time" (e.g., 4:00 PM) after which the ORB lines will automatically disappear.
2. EMA Clouds (Trend and Momentum)
Four distinct Exponential Moving Average (EMA) clouds are plotted to provide a dynamic, multi-speed view of the market's trend and momentum.
Structure: Each "Cloud" is the shaded area between two EMAs (one shorter length and one longer length). The indicator includes four customizable pairs (defaulting to common settings like 8/9, 8/14, 34/50, and 14/21).
Trend Coloring: The clouds are color-coded:
Bullish (Greenish): The shorter EMA is trading above the longer EMA, signaling upward momentum.
Bearish (Reddish): The shorter EMA is trading below the longer EMA, signaling downward momentum.
Application: These clouds are used to confirm the overall market direction or identify potential zones of support and resistance.
3. Volume-Weighted Average Price (VWAP)
The VWAP is a crucial anchor for measuring the market's efficiency throughout the trading day.
Function: It calculates the average price of the asset, giving more weight to prices where higher volume was traded.
Context: It helps traders quickly determine if the current price is trading at a premium (above VWAP) or a discount (below VWAP) relative to the day's volume.
Reset: The VWAP line automatically resets at the beginning of each trading day.
Customization: The VWAP line can be toggled on or off, and its color and width are fully adjustable.

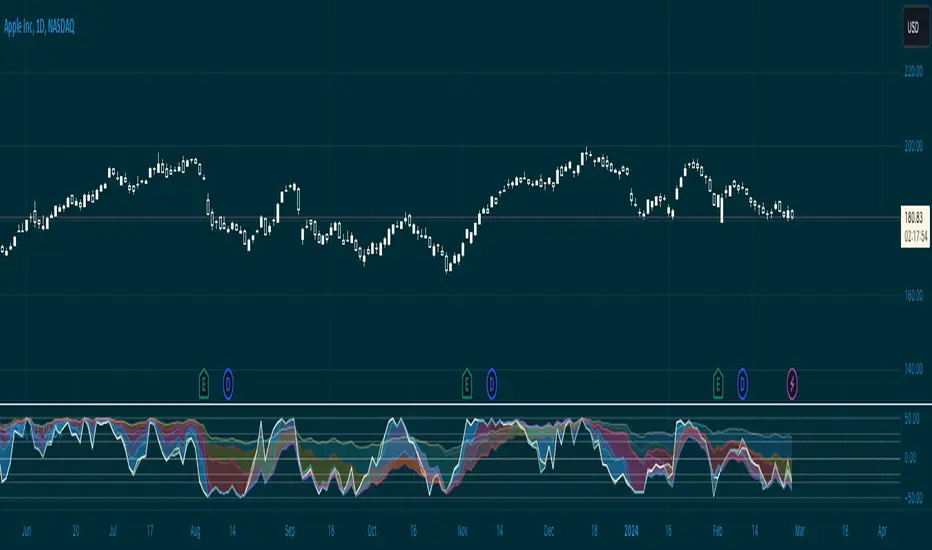
FVG Theory - MTFThe indicator displays FVGs and Swings from different timeframes and marks the resistance!
Components:
Swings:
A swing is a 3-candle formation based on the Williams Fractal Indicator.
The interaction with the last swing is always displayed as a red line. This allows you to recognize the last interaction directly and draw conclusions about the further course of the price (sweep / break).
In addition, the closest fractal is always shown as a green line, which acts as a potential target.
2. FVGs:
FVGs are also known as Inbalance, it is a 3 candle formation where a gap is created in the market. The market often runs into this and reacts.
Theory:
When the weekly timeframe creates an bullish FVG, the market often reacts to it and reaches the high.
However, resistance must also be taken into account: this is the FVG that has not yet been reached and is in a higher timeframe than the entry.
For example: we have a weekly FVG as context and are trading in H4.
If an open daily FVG is against us in this way, it is marked as resistance.
The market must first react to this in H4 and break this resistance high for a good trade setup!
That is why the indicator shows the FVGs from the different timeframes, displaying the last reaction as well as the closest FVG that is still open.
The same applies if you take everything one timeframe lower: e.g. daily, H4 and H1.
You can easily set the different timeframes in the indicator.
Here we have a daily context, an H4 resistance (FVG against us) and the H1 structure!
Higher FVG are stronger!
If, for example, we follow the H4 FVG and a daily FVG forms below us, it is more likely that the market will take the larger FVG. This is always shown with the indicator!
Structure:
Overlaps are drawn when the new FVG overlaps with the structure (body or wick).
The FVG has differnt codes!
FVG codes:
↑ = bullish FVG
↓ = bearish FVG
↑↑ = breakaway gaps --> close of the third candle is above the second candle
↓↓ = breakaway gaps --> close of the third candle is below the second candle
❗ = 3rd candle of the FVG has already reacted deeply into the potential FVG!
🔪 = Sharp Turn --> FVG is taken out from the new FVG in the other direction!
🔥 = Order flow (reaction from previous FVG)
🚀 = 2CR --> reaction high/low from previous FVG is run down with FVG!
Indicator settings:
You can set the FVGs, overlaps, and swings in up to 4 different timeframes. You can switch these on and off, as well as change all colours!
The highest timeframe has the additional function of displaying the context (last fractal high and low from the current FVG).

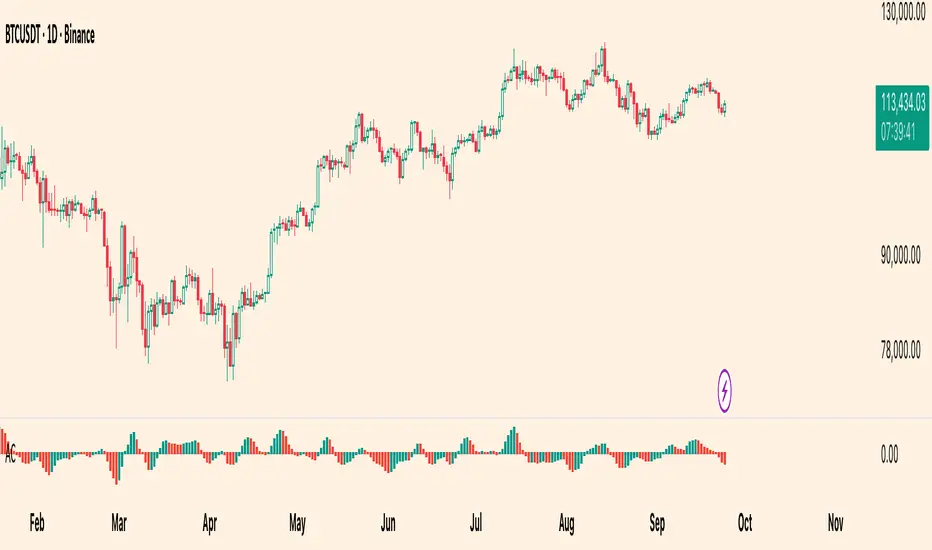
Williams Accelerator Oscillator — ACWhat it is
The Accelerator Oscillator (AC) measures the acceleration/deceleration of momentum. It’s derived from the Awesome Oscillator (AO) and shows whether momentum is speeding up or slowing down. In this implementation, columns are green when AC rises vs. the previous bar and red when it falls.
How it’s calculated
Price source: Median Price (HL2) by default; Close can be used instead.
AO = SMA(HL2, fastLen) − SMA(HL2, slowLen) (defaults: 5 & 34).
AC = AO − SMA(AO, signalLen) (default: 5).
Coloring: Green if AC > AC , else Red.
Zero line (optional) helps contextualize acceleration around neutral.
How to read it (typical interpretation)
Above 0: Upside acceleration (bullish pressure increasing).
Below 0: Downside acceleration (bearish pressure increasing).
Color sequences: Consecutive green columns suggest increasing upside acceleration; consecutive red columns suggest increasing downside acceleration.
Note: AC reflects change in momentum, not trend direction by itself. Many traders confirm with trend filters or price structure before acting.
Inputs
AO Fast SMA (default 5)
AO Slow SMA (default 34)
AC Signal SMA (default 5) — smoothing for the AO used in AC calc
Use Median Price (HL2) for AO (on/off)
Show zero line (on/off)
Show AO (for reference) (on/off)
Show AC signal (SMA of AO) (on/off)
Plots
AC Histogram — column chart colored by acceleration (green/red).
Zero — optional baseline at 0.
AO — optional reference line.
AO Signal (SMA) — optional smoothing line of AO.
Alerts
AC crosses above 0 — acceleration flips positive.
AC crosses below 0 — acceleration flips negative.
AC green above zero — AC rising and > 0.
AC red below zero — AC falling and < 0.
Usage tips
On lower timeframes, consider a slightly larger signalLen to reduce noise.
Confirm with price action, trend filters, or volatility context.
Values update intrabar; for stricter signals, confirm on bar close.
Limitations
AC is built from moving averages and is therefore lagging relative to raw price.
It is not normalized; behavior can vary by instrument and timeframe.
Do not use in isolation for entries/exits without risk management.
Credits
Concept by Bill Williams. This script is an independent implementation for educational and research purposes.
Disclaimer
No financial advice. Markets involve risk; test thoroughly before live use.
Wick SweepThe Wick Sweep indicator identifies potential trend reversal zones based on price action patterns and swing points. Specifically, it looks for "Wick Sweeps," a concept where the market temporarily breaks a swing low or high (creating a "wick"), only to reverse in the opposite direction. This pattern is often indicative of a market attempting to trap traders before making a larger move. The indicator marks these zones using dashed lines, helping traders spot key areas of potential price action.
Key Features:
* Swing Low and High Detection: The indicator identifies significant swing lows and highs within a user-defined period by employing Williams fractals.
* Wick Sweep Detection: Once a swing low or high is identified, the indicator looks for price movements that break through the low or high (creating a wick) and then reverses direction.
* Fractal Plotting: Optionally, the indicator plots fractal points (triangle shapes) on the chart when a swing low or high is detected. This can assist in visually identifying the potential wick sweep areas.
* Line Plotting: When a wick sweep is detected, a dashed line is drawn at the price level of the failed low or high, visually marking the potential reversal zone.
Inputs:
* Periods: The number of bars used to identify swing highs and lows. A higher value results in fewer, more significant swing points.
* Line Color: The color of the dashed lines drawn when a wick sweep is detected. Customize this to match your chart's theme or preferences.
* Show Fractals: A toggle that, when enabled, plots triangle shapes above and below bars indicating swing highs (up triangles) and swing lows (down triangles).
Functionality:
* Swing High and Low Calculation:
- The indicator calculates the swing low and swing high based on the periods input. A swing low is identified when the current low is the lowest within a range of (2 * periods + 1), with the lowest point being at the center of the period.
- Similarly, a swing high is identified when the current high is the highest within the same range.
* Wick Sweep Detection:
- Once a swing low or high is detected, the script looks for a potential wick. This happens when the price breaks the swing low or high and then reverses in the opposite direction.
- For a valid wick sweep, the price should briefly move beyond the identified swing point but then close in the opposite direction (i.e., a bullish reversal for a swing low and a bearish reversal for a swing high).
- A line is drawn at the price level of the failed low or high when a wick sweep is confirmed.
Confirmations for Reversal:
* The confirmation for a wick sweep requires that the price not only break the swing low/high but also close in the opposite direction (i.e., close above the low for a bullish reversal or close below the high for a bearish reversal).
* The confirmation is further refined by checking that the price movement is within a reasonable distance from the original swing point, which prevents the indicator from marking distant, unimportant price levels.
Additional Notes:
* The Wick Sweep indicator does not provide standalone trading signals; it is best used in conjunction with other technical analysis tools, such as trend analysis, oscillators, or volume indicators.
* The periods input can be adjusted based on the trader’s preferred level of sensitivity. A lower period value will result in more frequent swing points and potentially more signals, while a higher value will focus on more significant market swings.
* The indicator may work well in ranging markets where price tends to oscillate between key support and resistance levels.

FVG TheoryThe indicator is intended to facilitate trading with FVGs. It consists of 3 components:
1. Swings:
A swing is a 3-candle formation based on the Williams Fractal Indicator.
The interaction with the last swing is always displayed as a red line. This allows you to recognize the last interaction directly and draw conclusions about the further course of the price (sweep / break).
In addition, the closest fractal is always shown as a green line, which acts as a potential target.
2. FVGs:
FVGs are also known as Inbalance, it is a 3 candle formation where a gap is created in the market. The market often runs into this and reacts.
If the market reacts from an imbalance before it has reached the swing low in the bullish case, the next FVG appears in a different color.
This formation has more power and is therefore color-coded.
If the FVG is particularly strong, measured by the fact that the 3rd candle in the formation breaks the 2nd candle with a candle body, this is marked with a small arrow in the FVG (break away gap).
3. overlapping
If there is a structure point within an FVG (order block, significant swing), a line is drawn there.
These overlaps have a higher confluence than FVGs alone. The wick is preferred, but if there is no overlap, the body of the structure is used.
The line thickness and colors are individually adjustable.

Advanced Support & Resistance Zone DetectionAdvanced Support & Resistance Zone Detection Indicator: A Comprehensive Overview
The "Advanced Support & Resistance Zone Detection" indicator, developed by @HarryCTC, is a powerful tool designed to identify support and resistance levels in trading markets. This indicator helps traders identify areas where the price is likely to encounter obstacles and potentially reverse its direction. By understanding these key levels, traders can make more informed decisions and improve their overall trading strategies.
This indicator is based on the Williams Fractal Indicator.
The indicator employs a fractal-based approach to identify support and resistance levels. Fractals are patterns that indicate potential price reversals. The indicator scans the price data and looks for specific fractal patterns that signify the presence of support or resistance.
For support levels, the indicator searches for downward fractals, where a lower low is formed surrounded by higher lows on both sides. This pattern suggests a potential support level as the price has temporarily stopped declining and may reverse its direction.
Conversely, for resistance levels, the indicator looks for upward fractals, where a higher high is formed surrounded by lower highs on both sides. This pattern indicates a potential resistance level where the price has temporarily halted its ascent and may reverse downwards.
The indicator applies certain conditions and filters to ensure the significance of the identified support and resistance levels. These conditions prevent the inclusion of minor price fluctuations and focus on capturing major turning points in the market.
Once a support or resistance level is detected, the indicator plots it on the chart either as a zone or a line, based on user preferences. The indicator also keeps track of previously identified levels and updates them as new levels are found.
By utilizing fractal analysis, the "Advanced Support & Resistance Zone Detection" indicator provides traders with valuable insights into key levels where price reversals are likely to occur. Traders can use this information to plan their entries, exits, and overall trading strategies more effectively.
The indicator utilizes several input parameters that allow users to customize its behavior according to their preferences and trading styles. Let's explore each of these parameters in detail:
1. Periods: This parameter determines the number of periods considered when identifying support and resistance levels. It indicates the length of the lookback period used to analyze price action and detect potential zones.
2. S&R Distance: The S&R distance parameter specifies the minimum distance, in pips, between the identified support and resistance levels. It helps filter out insignificant price fluctuations and focuses on significant price zones.
3. Number of S&R Levels to Show: This parameter controls the maximum number of support and resistance levels displayed on the chart. Users can set the desired number to avoid cluttering the chart with excessive information.
4. Draw S&R Zones: If enabled, this parameter allows the indicator to draw support and resistance zones on the chart. These zones represent areas where price reversals are likely to occur. Traders can visually analyze the chart and observe the significance of these zones.
5. Draw S&R Lines: This parameter determines whether the indicator should draw lines representing support and resistance levels on the chart. These lines provide a clear visual representation of the detected levels.
6. Resistance Zone Color: Users can customize the color of the resistance zones drawn on the chart. By choosing distinct colors, traders can easily differentiate between support and resistance zones.
7. Support Zone Color: Similarly, this parameter allows users to specify the color of the support zones displayed on the chart.
8. Resistance Line Color: Traders can choose the color of the lines representing resistance levels. This color customization helps in visually distinguishing resistance levels from other elements on the chart.
9. Support Line Color: This parameter determines the color of the lines representing support levels.
10. S&R Zone & Line Extension: The S&R zone and line extension parameter defines the extension of support and resistance zones and lines to the right side of the chart. It provides traders with a visual projection of the potential future behavior of these levels.
11. S&R Line Width: Users can adjust the width of the lines representing support and resistance levels. This customization option helps traders emphasize or de-emphasize these lines based on their preferences.

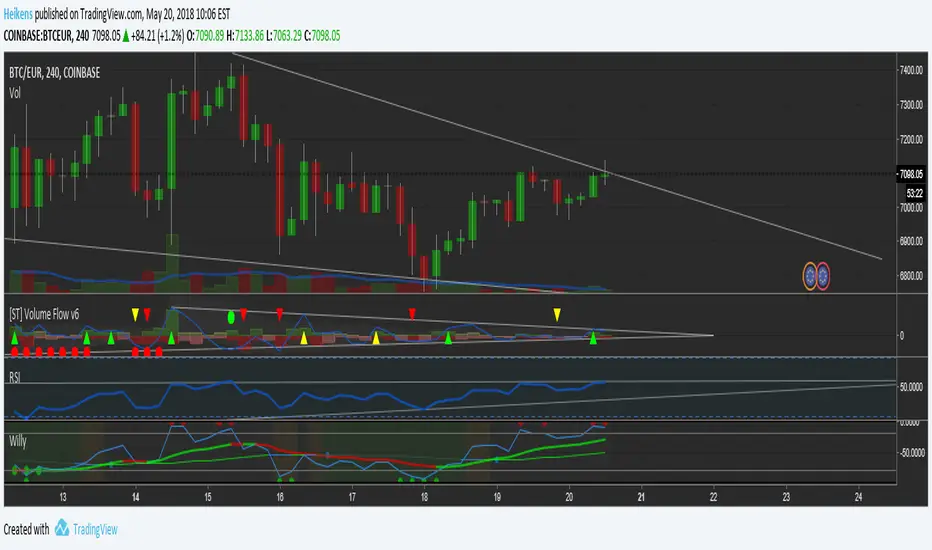
Fx Crusher Scalping Indicator V1█ OVERVIEW
Scalping Indicator with Buy and Sell Signals for the 15 min and 5 min Chart. Works on all assets (Crypto, Forex, Stocks, Indices, Commodities and Metals)
Only use in trending markets. Signals in a ranging market are useless.
This Scalping Indicator is different from others because most of the Buy/ Sell signals actually make sense. No counter trend trading and most signals can be very profitable when used right.The single most important goal was to have an indicator that shows signals with a big possible risk reward ratio. Most false signals are filtered out. The Fx Crusher Scalping Indicator is not perfect but it is amazing. You can customize the indicator to get the highest signal quality.
█ HOW DOES IT WORK?
The indicator determines the trend direction by using 3 different smoothed moving averages. A green background shows an uptrend and a red background shows a downtrend.
The strength of the trend is determined by the slope of the individual SMMAs. You can set the slope of every single SMMA for buys and sells individually.
The indicator only shows signals when there is a clear trend on the current timeframe.
Entry signals are generated by a combination of Williams fractals, SMMA crossover, trend angle and RSI condition.
█ HOW TO USE?
Draw Support & Resistance lines on the 4H Chart
Determine the overall trend on the 1H Timeframe
Go to the 15 min or 5 min Time Frame and have a look at the signals
Adjust the slope of every single SMMA in 0.01 steps until the signals look good
Adjust the RSI settings for overbought and oversold condition if necessary
Only enter a trade after the candle that prints a signal is closed.
Only take buy positions when all SMMAs are going up and don’t touch each other
Only take sell positions when all SMMAs are going down and don’t touch each other
Only use this Scalping Indicator with proper Risk management and a risk reward ratio of around 1:2.
Trail your stop to get the most pips out of the signals. Very often the indicator shows signals right before major moves.
█ ADDITIONAL INFO
Be careful with buy signals when the market on the higher timeframe (4H and 1H) is in a downtrend and vice versa.
You can make the most profit out of this Indicator when you enter with 2 positions. A quick scalp and a runner. Because there's a lot of signals with huge risk reward ratios but also some unprofitable signals . Therefore make sure you make the best out of the good signals and apply proper risk management to limit losses with bad signals. Stop loss placement according to market structure.
Multiple Signals in a row can show a high probability of a very strong upcoming move. Monitor your trades and secure partials to make the best out of it.
You can select how many signals it is going to show once trend conditions are met. Please be aware that the longer a trend goes, the higher is the probability of a reversal. Therefore the first few signals after all conditions are met are most likely the most profitable.
By setting the slope of the slow SMMA correctly you can filter out most signals in a ranging market.
█ DISCLAIMER
This is not financial advice. I do everything I can to provide the most accurate buy and sell signals for scalping but past results are no guarantee for future performance.

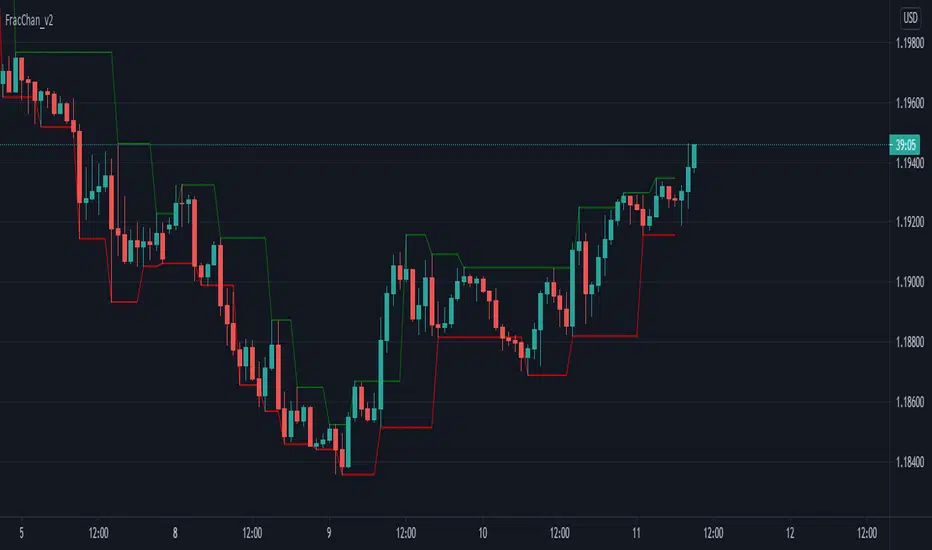
Fractal Channel v2Just another way of visualizing Williams' Fractals: they are now joined in a channel.
You can also create a channel of Fractals from another time frame than the current.
Great for identifying breakout entries, trend direction analysis (i.e. easily visualize Higher Lows, Higher Highs, Lower Lows, Lower Highs) or to trail your Stop Losses.
Version 2 of the Fractal Channel now correctly identifies William's Fractals when the High/Low of the 'Fractal Candle' is equal to the High/Low of the neighbouring 2 candles on both sides.
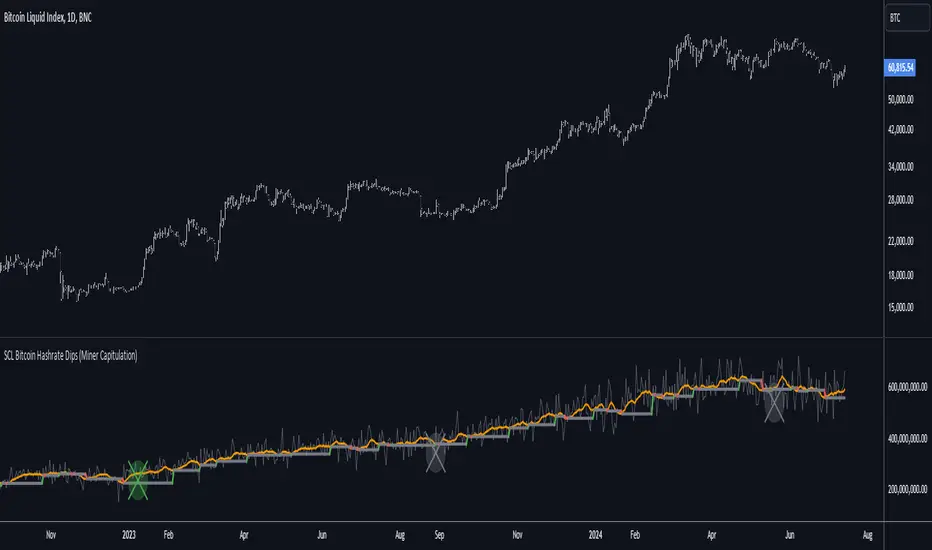
[SCL] Bitcoin Hashrate Dips (Miner Capitulation)Gives long-term buy signals for Bitcoin from dips and recoveries in the hashrate (the "miner capitulation" theory). It has an overlay and a standalone mode and is fully configurable. It uses Williams Lows and ATR instead of moving averages.
Features that might be interesting for Pinescripters:
+ Automatic (as far as is possible currently) adjustment of plots for overlay and standalone display modes.
+ A neat label function for debugging floats
+ Fully commented
+ The debug that I used to overcome problems in developing it is left in
+ Ideas for how to deal with a wildly oscillating and exponentially increasing data source
You need to run this indicator on the Bitcoin daily chart for it to make any sense. The best is a BTC/USD chart with a long history, such as BNC:BLX.
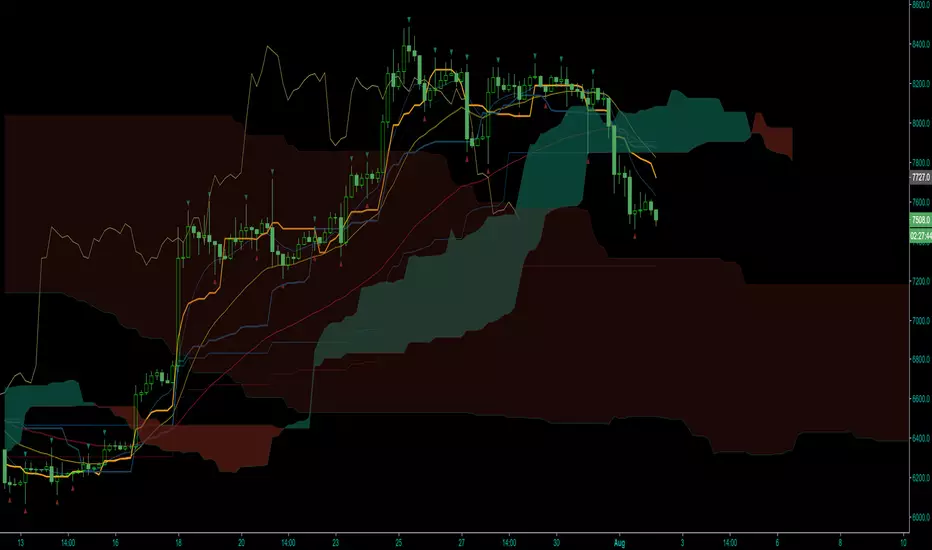
2xIchimoku Cloud + 4xEMA + Williams FractalCopy+Pasted/edited the code from :
Moku
www.tradingview.com
EMA
www.tradingview.com
Fractal
www.tradingview.com
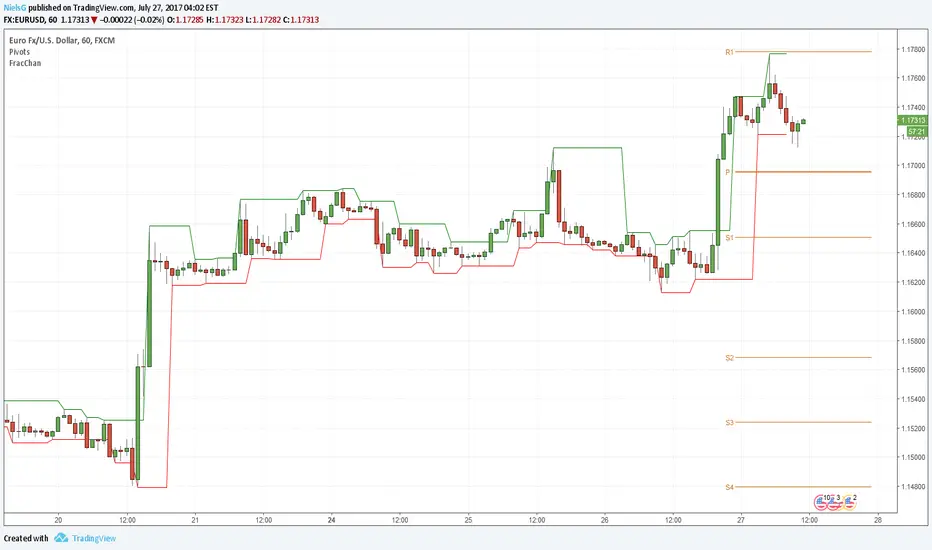
Fractal ChannelJust another way of visualizing Williams' Fractals: they are now joined in a channel.
You can also create a channel of Fractals from another time frame than the current.
Great for identifying breakout entries or to trail your Stop Losses.
VIX BanditThis is a momentum indicator that identifies potential VIX bottoms by using seven configurable Williams %R oscillators simultaneously.
Green dots🟢appear below the bar when all %R series agree the VIX is extremely oversold.
Fuchsia dots🟣appear above the bar when VIX reverts to its long-term average (an EMA).
I hope this helps you spot moments of maximum optimism and trade the subsequent panic, somehow.


Williams %R I needed the %R code in one of my indicators and TradingVeiw have it hidden. So here is my attempt.
CM_Williams_Vix_Fix_V3_Upper_Text PlotsWilliams Vix Fix Text Plots! Alert Capable!
Use With Lower Indicator or as Single Indicator!
Has Text Plots For All Plot Types Lower Indicator Uses.
To Get Lower Indicator:
Info On Lower Indicator - Discussion:
