Strategy Bill Williams. Awesome Oscillator (AO) This indicator is based on Bill Williams` recommendations from his book
"New Trading Dimensions". We recommend this book to you as most useful reading.
The wisdom, technical expertise, and skillful teaching style of Williams make
it a truly revolutionary-level source. A must-have new book for stock and
commodity traders.
The 1st 2 chapters are somewhat of ramble where the author describes the
"metaphysics" of trading. Still some good ideas are offered. The book references
chaos theory, and leaves it up to the reader to believe whether "supercomputers"
were used in formulating the various trading methods (the author wants to come across
as an applied mathemetician, but he sure looks like a stock trader). There isn't any
obvious connection with Chaos Theory - despite of the weak link between the title and
content, the trading methodologies do work. Most readers think the author's systems to
be a perfect filter and trigger for a short term trading system. He states a goal of
10%/month, but when these filters & axioms are correctly combined with a good momentum
system, much more is a probable result.
There's better written & more informative books out there for less money, but this author
does have the "Holy Grail" of stock trading. A set of filters, axioms, and methods which are
the "missing link" for any trading system which is based upon conventional indicators.
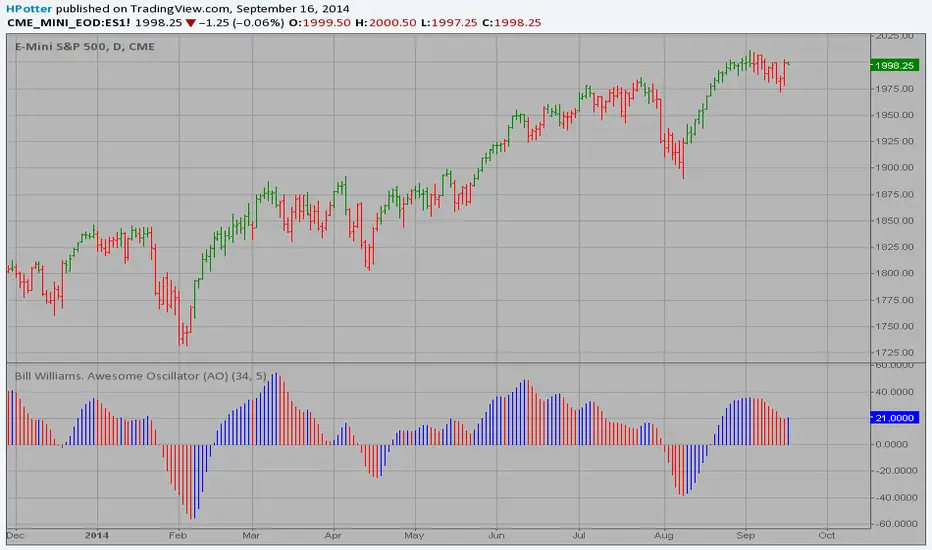
This indicator plots the oscillator as a histogram where periods fit for buying are marked
as blue, and periods fit for selling as red. If the current value of AC (Awesome Oscillator)
is over the previous, the period is deemed fit for buying and the indicator is marked blue.
If the AC values is not over the previous, the period is deemed fir for selling and the indicator
is marked red.
스크립트에서 "williams"에 대해 찾기
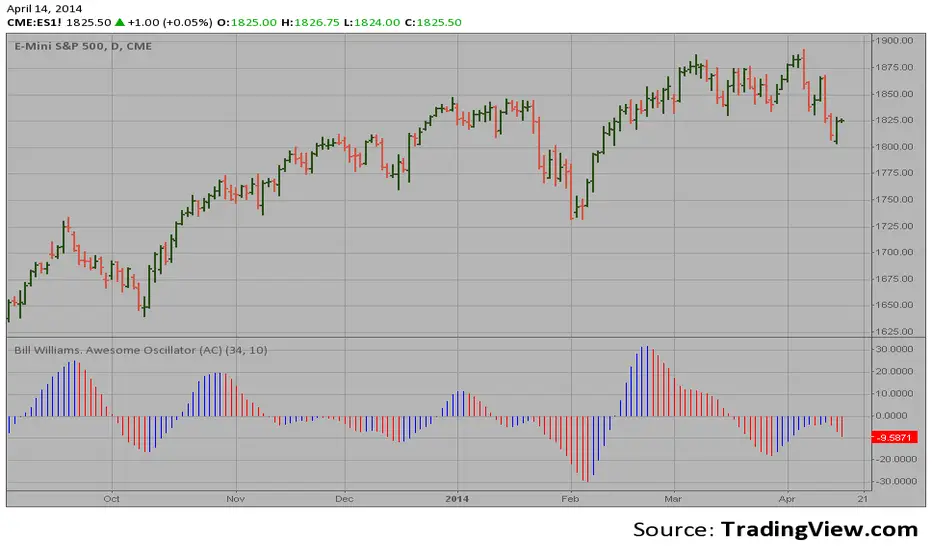
Bill Williams. Awesome Oscillator (AC)Hi
Let me introduce my Bill Williams. Awesome Oscillator (AC) script.
This indicator plots the oscillator as a histogram where blue denotes
periods suited for buying and red . for selling. If the current value
of AO (Awesome Oscillator) is above previous, the period is considered
suited for buying and the period is marked blue. If the AO value is not
above previous, the period is considered suited for selling and the
indicator marks it as red.
Larry Williams POIV A/D [tradeviZion]Larry Williams' POIV A/D - Release Notes v1.0
=================================================
Release Date: 01 April 2025
OVERVIEW
--------
The Larry Williams POIV A/D (Price, Open Interest, Volume Accumulation/Distribution) indicator implements Williams' original formula while adding advanced divergence detection capabilities. This powerful tool combines price movement, open interest, and volume data to identify potential trend reversals and continuations.
FEATURES
--------
- Implements Larry Williams' original POIV A/D formula
- Divergence detection system:
* Regular divergences for trend reversal signals
* Hidden divergences for trend continuation signals
- Fast Mode option for earlier pivot detection
- Customizable sensitivity for divergence filtering
- Dynamic color visualization based on indicator direction
- Adjustable smoothing to reduce noise
- Automatic fallback to OBV when Open Interest is unavailable
FORMULA
-------
POIV A/D = CumulativeSum(Open Interest * (Close - Close ) / (True High - True Low)) + OBV
Where:
- Open Interest: Current period's open interest
- Close - Close : Price change from previous period
- True High - True Low: True Range
- OBV: On Balance Volume
DIVERGENCE TYPES
---------------
1. Regular Divergences (Reversal Signals):
- Bullish: Price makes lower lows while indicator makes higher lows
- Bearish: Price makes higher highs while indicator makes lower highs
2. Hidden Divergences (Continuation Signals):
- Bullish: Price makes higher lows while indicator makes lower lows
- Bearish: Price makes lower highs while indicator makes higher highs
REQUIREMENTS
-----------
- Works best with futures and other instruments that provide Open Interest data
- Automatically adapts to work with any instrument by using OBV when OI is unavailable
USAGE GUIDE
-----------
1. Apply the indicator to any chart
2. Configure settings:
- Adjust sensitivity for divergence detection
- Enable/disable Fast Mode for earlier signals
- Customize visual settings as needed
3. Look for divergence signals:
- Regular divergences for potential trend reversals
- Hidden divergences for trend continuation opportunities
4. Use the alerts system for automated divergence detection
KNOWN LIMITATIONS
----------------
- Requires Open Interest data for full functionality
- Fast Mode may generate more signals but with lower reliability
ACKNOWLEDGEMENTS
---------------
This indicator is based on Larry Williams' work on Open Interest analysis. The implementation includes additional features for divergence detection while maintaining the integrity of the original formula.

CFB-Adaptive, Williams %R w/ Dynamic Zones [Loxx]CFB-Adaptive, Williams %R w/ Dynamic Zones is a Jurik-Composite-Fractal-Behavior-Adaptive Williams % Range indicator with Dynamic Zones. These additions to the WPR calculation reduce noise and return a signal that is more viable than WPR alone.
What is Williams %R?
Williams %R , also known as the Williams Percent Range, is a type of momentum indicator that moves between 0 and -100 and measures overbought and oversold levels. The Williams %R may be used to find entry and exit points in the market. The indicator is very similar to the Stochastic oscillator and is used in the same way. It was developed by Larry Williams and it compares a stock’s closing price to the high-low range over a specific period, typically 14 days or periods.
What is Composite Fractal Behavior ( CFB )?
All around you mechanisms adjust themselves to their environment. From simple thermostats that react to air temperature to computer chips in modern cars that respond to changes in engine temperature, r.p.m.'s, torque, and throttle position. It was only a matter of time before fast desktop computers applied the mathematics of self-adjustment to systems that trade the financial markets.
Unlike basic systems with fixed formulas, an adaptive system adjusts its own equations. For example, start with a basic channel breakout system that uses the highest closing price of the last N bars as a threshold for detecting breakouts on the up side. An adaptive and improved version of this system would adjust N according to market conditions, such as momentum, price volatility or acceleration.
Since many systems are based directly or indirectly on cycles, another useful measure of market condition is the periodic length of a price chart's dominant cycle, (DC), that cycle with the greatest influence on price action.
The utility of this new DC measure was noted by author Murray Ruggiero in the January '96 issue of Futures Magazine. In it. Mr. Ruggiero used it to adaptive adjust the value of N in a channel breakout system. He then simulated trading 15 years of D-Mark futures in order to compare its performance to a similar system that had a fixed optimal value of N. The adaptive version produced 20% more profit!
This DC index utilized the popular MESA algorithm (a formulation by John Ehlers adapted from Burg's maximum entropy algorithm, MEM). Unfortunately, the DC approach is problematic when the market has no real dominant cycle momentum, because the mathematics will produce a value whether or not one actually exists! Therefore, we developed a proprietary indicator that does not presuppose the presence of market cycles. It's called CFB (Composite Fractal Behavior) and it works well whether or not the market is cyclic.
CFB examines price action for a particular fractal pattern, categorizes them by size, and then outputs a composite fractal size index. This index is smooth, timely and accurate
Essentially, CFB reveals the length of the market's trending action time frame. Long trending activity produces a large CFB index and short choppy action produces a small index value. Investors have found many applications for CFB which involve scaling other existing technical indicators adaptively, on a bar-to-bar basis.
What is Jurik Volty used in the Juirk Filter?
One of the lesser known qualities of Juirk smoothing is that the Jurik smoothing process is adaptive. "Jurik Volty" (a sort of market volatility ) is what makes Jurik smoothing adaptive. The Jurik Volty calculation can be used as both a standalone indicator and to smooth other indicators that you wish to make adaptive.
What is the Jurik Moving Average?
Have you noticed how moving averages add some lag (delay) to your signals? ... especially when price gaps up or down in a big move, and you are waiting for your moving average to catch up? Wait no more! JMA eliminates this problem forever and gives you the best of both worlds: low lag and smooth lines.
Ideally, you would like a filtered signal to be both smooth and lag-free. Lag causes delays in your trades, and increasing lag in your indicators typically result in lower profits. In other words, late comers get what's left on the table after the feast has already begun.
What are Dynamic Zones?
As explained in "Stocks & Commodities V15:7 (306-310): Dynamic Zones by Leo Zamansky, Ph .D., and David Stendahl"
Most indicators use a fixed zone for buy and sell signals. Here’ s a concept based on zones that are responsive to past levels of the indicator.
One approach to active investing employs the use of oscillators to exploit tradable market trends. This investing style follows a very simple form of logic: Enter the market only when an oscillator has moved far above or below traditional trading lev- els. However, these oscillator- driven systems lack the ability to evolve with the market because they use fixed buy and sell zones. Traders typically use one set of buy and sell zones for a bull market and substantially different zones for a bear market. And therein lies the problem.
Once traders begin introducing their market opinions into trading equations, by changing the zones, they negate the system’s mechanical nature. The objective is to have a system automatically define its own buy and sell zones and thereby profitably trade in any market — bull or bear. Dynamic zones offer a solution to the problem of fixed buy and sell zones for any oscillator-driven system.
An indicator’s extreme levels can be quantified using statistical methods. These extreme levels are calculated for a certain period and serve as the buy and sell zones for a trading system. The repetition of this statistical process for every value of the indicator creates values that become the dynamic zones. The zones are calculated in such a way that the probability of the indicator value rising above, or falling below, the dynamic zones is equal to a given probability input set by the trader.
To better understand dynamic zones, let's first describe them mathematically and then explain their use. The dynamic zones definition:
Find V such that:
For dynamic zone buy: P{X <= V}=P1
For dynamic zone sell: P{X >= V}=P2
where P1 and P2 are the probabilities set by the trader, X is the value of the indicator for the selected period and V represents the value of the dynamic zone.
The probability input P1 and P2 can be adjusted by the trader to encompass as much or as little data as the trader would like. The smaller the probability, the fewer data values above and below the dynamic zones. This translates into a wider range between the buy and sell zones. If a 10% probability is used for P1 and P2, only those data values that make up the top 10% and bottom 10% for an indicator are used in the construction of the zones. Of the values, 80% will fall between the two extreme levels. Because dynamic zone levels are penetrated so infrequently, when this happens, traders know that the market has truly moved into overbought or oversold territory.
Calculating the Dynamic Zones
The algorithm for the dynamic zones is a series of steps. First, decide the value of the lookback period t. Next, decide the value of the probability Pbuy for buy zone and value of the probability Psell for the sell zone.
For i=1, to the last lookback period, build the distribution f(x) of the price during the lookback period i. Then find the value Vi1 such that the probability of the price less than or equal to Vi1 during the lookback period i is equal to Pbuy. Find the value Vi2 such that the probability of the price greater or equal to Vi2 during the lookback period i is equal to Psell. The sequence of Vi1 for all periods gives the buy zone. The sequence of Vi2 for all periods gives the sell zone.
In the algorithm description, we have: Build the distribution f(x) of the price during the lookback period i. The distribution here is empirical namely, how many times a given value of x appeared during the lookback period. The problem is to find such x that the probability of a price being greater or equal to x will be equal to a probability selected by the user. Probability is the area under the distribution curve. The task is to find such value of x that the area under the distribution curve to the right of x will be equal to the probability selected by the user. That x is the dynamic zone.
Included:
Bar coloring
3 signal variations w/ alerts
Divergences w/ alerts
Loxx's Expanded Source Types

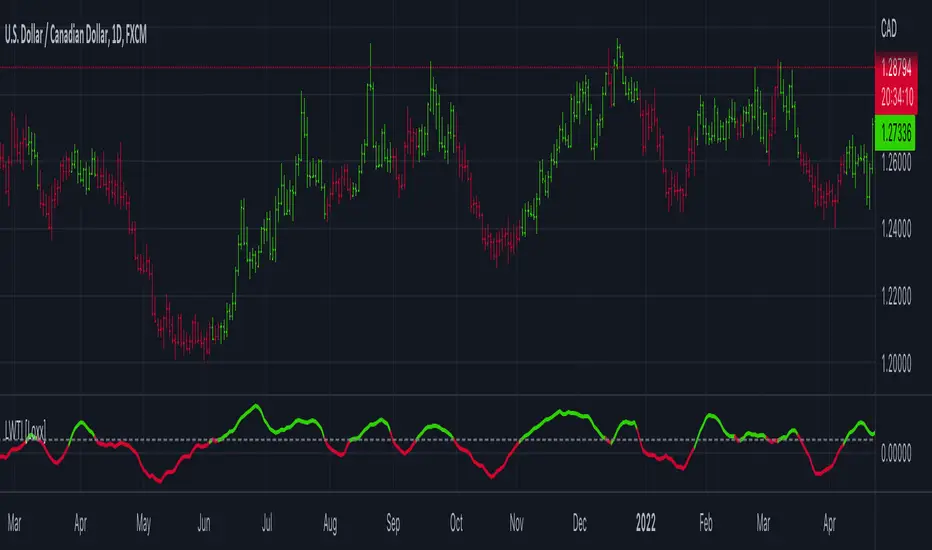
Larry Williams Large Trade Index (LWTI) [Loxx]Larry Williams Large Trade Index (LWTI) is an indicatory by Larry Williams as explained in his book "Trade Stocks and Commodities with the Insiders: Secrets of the COT Report". I've added optional smoothing if you wish to smooth the output.
What is the Larry Williams Large Trade Index (LWTI)?
The original concept was specifically based on Trader (or Market) Sentiment and predicting market reversals. It's calculated as follows:
MovingAvg(Close - Close , bars used in average)/MovingAvg(Range,bars used in average)*50 + 50
Included
Bar coloring
Signals
Alerts
Larry Williams Proxy Index (LWPI) [Loxx]Larry Williams Proxy Index (LWPI) is an indicatory by Larry Williams as explained in his book "Trade Stocks and Commodities with the Insiders: Secrets of the COT Report", pages 129-135. This is an INVERSE indicator, so follow the signals and colors to understand what it's doing. I've added optional smoothing if you wish to smooth the output.
What is the Larry Williams Proxy Index (LWPI)?
The original concept was specifically based on Trader (or Market) Sentiment and predicting market reversals. It's calculated as follows:
MovingAvg(Open-Close, bars used in average)/MovingAvg(Range, bars used in average)*50+50
Included
Bar coloring
Signals
Alerts

Inverse Fisher Transform on Williams %RInverse Fisher Transform On Williams %R
Since Williams R indicator produces negative values, I preferred to add 50 instead of subtracting 50.
It produces values between 0.5 and -0.5.
Generates clear buy and sell signals.
Williams %R determines overbought and oversold levels.
You can see more softly.

Dual Timeframe Williams Percent RangeThis is a dual timeframe Williams Percent Range indicator.
Function:
The idea behind this indicator is for trader to see what the Williams %r is doing on higher timeframes without the need to change the chart. I added the "Smoothing" function to take the jagged lines out of the higher timeframe. It has a better flow this way.
If we choose the 4H and the Daily timeframes for example. In this bullish situation I wait for the Daily WPR to cross above the -50 mid line. Then the faster 4H WPR will eventually hit the bottom and begin to rise again back into the trend.
This is the "Reset" of the 4H WPR and when the 4H WPR crosses up above the -50 mid line again it means price should begin to rise on the chart. I added the option to change the colour when the signal lines cross the -50. It is good to use a fast time frame so you can see the WPR hitting the bottom in an uptrend, but not too fast.
The Heiken Ashi candle sticks are a very good addition to this system. You can also use a colour changing 200 EMA if you run the "1H/Daily" in the WPR. Or the 50 EMA if you run the Daily 4H.
This system could be used on lower timeframes too but I have not tested it there.
The Dual WPR indicator, the colour changing 50 EMA and Heiken Ashi have been optimised for the 4H/Daily.
If you want to set alerts the the faster WPR line crossing the -50 is good, on candle close.
This way you will only need one alert per chart.
If you get an alert on the EURUSD 4H that the 4H WPR has crossed up then look to see what what the Daily WPR is doing. If it is also above the -50 mid line then EURUSD is probably trending up.
Thank you to TradingView for supplying the Williams %r template.
I hope this helps some other traders out there.
I combined the Supertrend and the Coloured EMA in the main screen into one indicator.
This is my first indicator published :-)
Have fun out there and good luck.
Eddie T.

Williams %RWilliams %R indicator with Bollinger Bands.
A bound oscillator from a formula by Larry Williams.
The oscillator ranges from 0 to -100. Overbought is at -20 and oversold is -80.
You can change the %R period, toggle the Bollinger Bands on and off and change the Bollinger Band period.
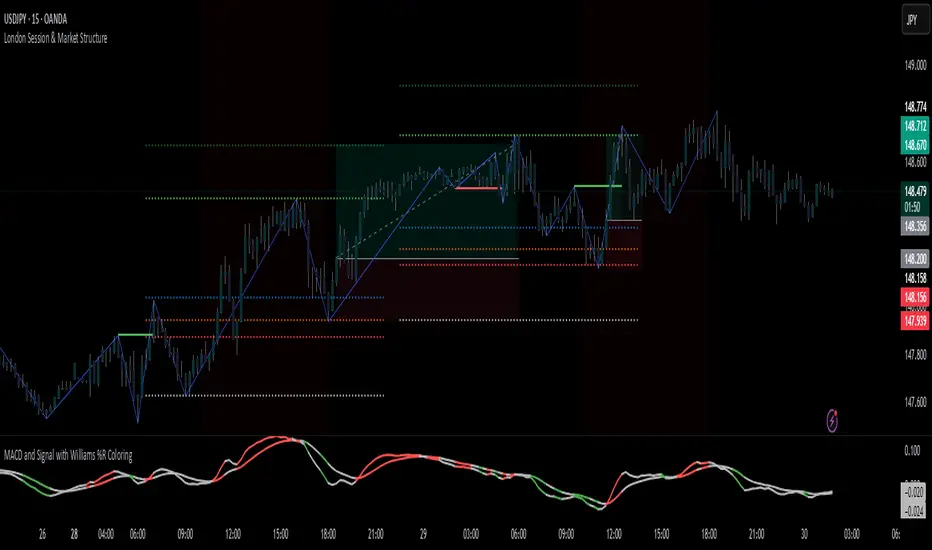
MACD Signal with Williams %R ColoringA simple fused indicator of 2, 1) MACD signal lines made colouring when 2) Williams % R is in overbought or oversold. not my own coding, just took two readily available indicators and coded them together.
Jurik Smoothed Williams %R by jwammo12This is Williams %R that has been used using Jurik's method. This removes a lot of the chop and false signals of William's %R while adding only minimal lag.

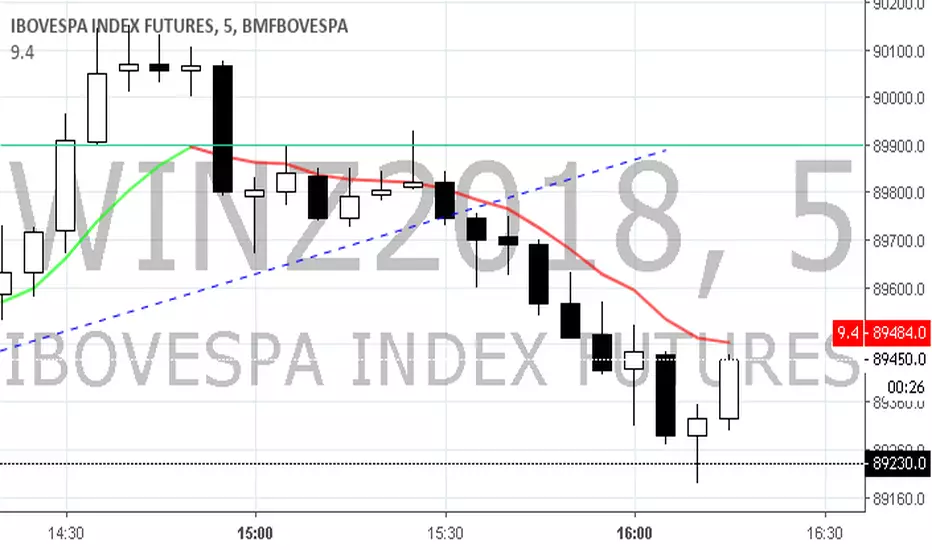
Setup 9.4 - Larry Williams---IN-US---
Hi traders, this simple setup was created by the professional Trader Larry Willians.
This trade system is based on 9 EMA .
Setup EMA 9.3
1) Find a stock with 9 EMA uptrend and turns down, but the low of the candle which made turn go down can't be lose, 9 EMA can go down ONLY ONE candle.
2) Wait for 9 EMA go up in the next candle and mark the high.
3) If the price doesnt across the high, mark the next high.
4) Buy when the price cross the mark.
5) Stop-loss in the low of the marked candle.
--PT-BR---
Olá traders, setup universal, criado pelo famoso Trader Larry Williams , e divulgado pelo Trader Palex. Setup baseado na MME de 9 períodos.
Setup MME 9.4
1) Achar ativo com a MME9 esteja subindo; A MME9 vem subindo e vira para baixo, mas o candle que fez essa virada ocorrer não tem a mínima perdida e a MME9 volta a virar para cima no candle seguinte. Só pode ficar virada pra baixo 1 candle e logo no candle seguinte a média vira pra cima.
2) Marcamos a máxima do candle que fez a MME9 virar para cima e no seu rompimento temos a entrada na
ponta compradora.
3) Se a máxima não for rompida, marcar a próxima máxima;
4) Compra no rompimento dessa máxima (qualquer negócio acima dessa máxima);
5)Stop-loss na mínima do candle que fez a MME9 virar para baixo.
Bons trades a todos.
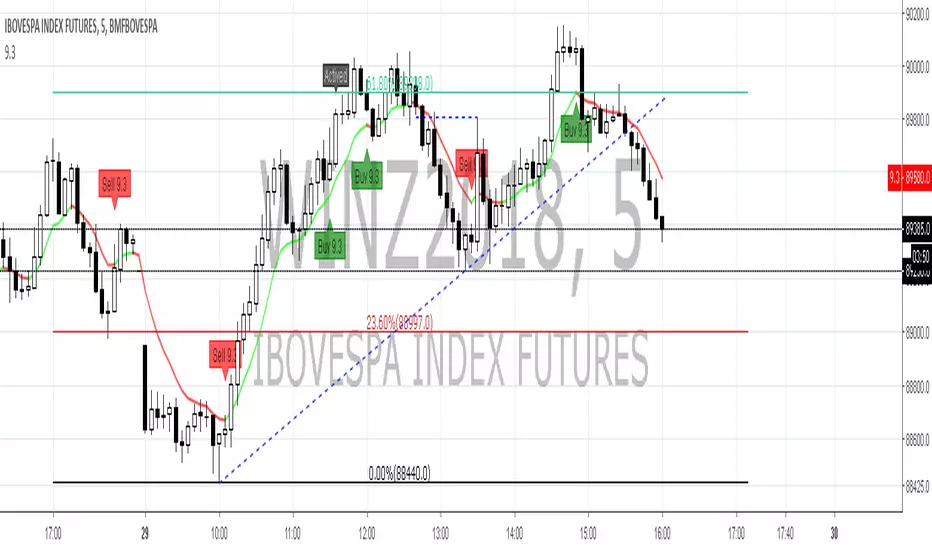
Setup 9.3 - Larry Williams--IN-US---
Hi traders, this simple setup was created by the professional Trader Larry Willians.
This trade system is based on 9 EMA .
Setup 9.3
1) Find a stock with the 9 period EMA uptrend.
2) Look for a close which is followed by two lower closes,
3) Mark the high of the last candle.
4) Buy when the price cross the mark.
5) Stop-loss in the low of the marked candle.
---PT-BR---
Olá traders, setup universal, criado pelo famoso Trader Larry Williams , e divulgado pelo Trader Palex. Setup baseado na MME de 9 períodos.
Setup MME 9.3
1) Achar ativo com a MME9 esteja subindo;
2) Procurar 1 fechamento que seja seguido por dois fechamentos seguidos descendentes (abaixo do "candle referência") e marcar máxima do último candle;
3) Se a máxima não for rompida, marcar a próxima máxima;
4) Compra no rompimento dessa máxima (qualquer negócio acima dessa máxima);
5) Stop na mínima do candle anterior ao que gerou a entrada;
Setup 9.2 - Larry Williams---IN-US---
Hi traders, this simple setup was created by the professional Trader Larry Willians.
This trade system is based on 9 EMA.
Setup EMA 9.2
1) Find a stock with 9 EMA uptrend.
2) Wait for a close below the last candle low and mark the high of it candle.
3) If the price doesnt across the high, mark the next high.
4) Buy when the price cross the mark.
5) Stop-loss in the low of the marked candle.
---PT-BR---
Olá traders, setup universal, criado pelo famoso Trader Larry Williams, e divulgado pelo Trader Palex. Setup baseado na MME de 9 períodos.
Setup MME 9.2
1) Achar ativo com a MME9 subindo;
2) Aguardar fechamento abaixo da mínima do candle anterior e marcar a máxima desse candle;
3) Se a máxima não for rompida, marcar a próxima máxima;
4) Compra no rompimento dessa máxima (qualquer negócio acima dessa máxima);
5) Stop na mínima do candle anterior ao que gerou a entrada;
Bons trades.

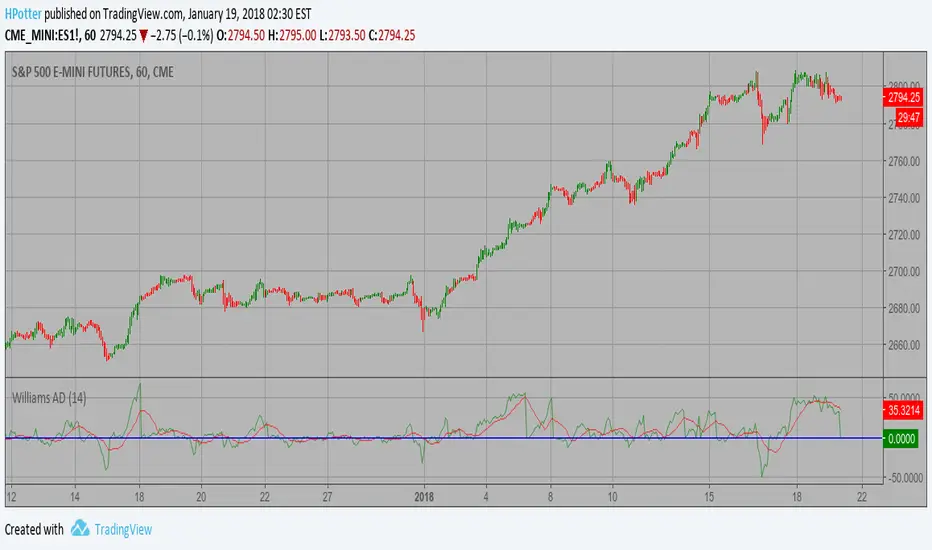
Smoothened Williams A/D Strategy Accumulation is a term used to describe a market controlled by buyers;
whereas distribution is defined by a market controlled by sellers.
Williams recommends trading this indicator based on divergences:
Distribution of the security is indicated when the security is making
a new high and the A/D indicator is failing to make a new high. Sell.
Accumulation of the security is indicated when the security is making
a new low and the A/D indicator is failing to make a new low. Buy.
WARNING:
- This script to change bars colors.
Colored Williams %RThis script is the same as Williams %R except that on green days we plot green and red on red days. If a bar opens and closes the same, we plot black.

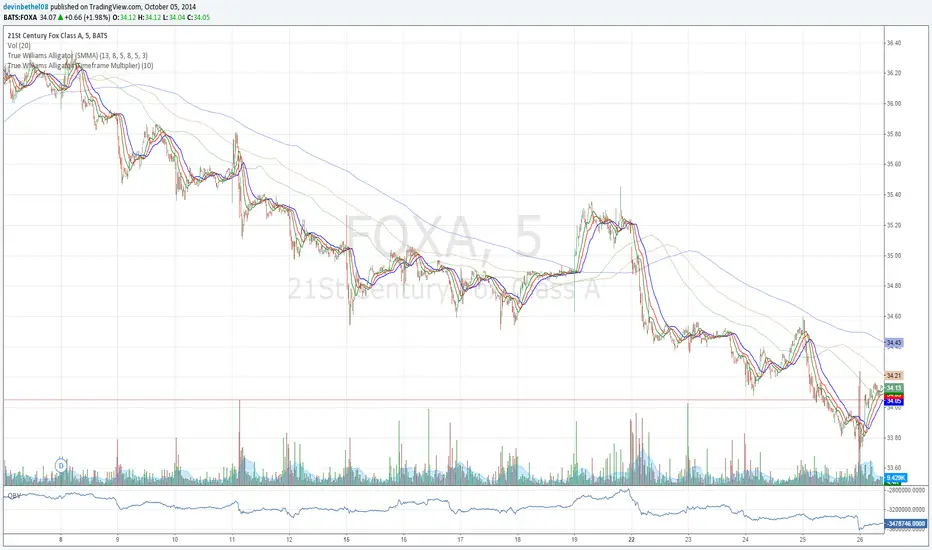
True Williams Alligator (Timeframe Multiplier)Modified version of my original "True Williams Alligator (SMMA)" indicator that includes a multiplier to show the alligator (ie elliot wave mode) of higher timeframes. See original indicator for details.
Note: First script submission. Didn't mean to use this chart. Ugly and messy. Oops.
Williams Squat BarsSquat bars are a battle of the bulls and the bears, with lots of buying and selling but little price movement.
A squat bar will be one of the top three OR bottom three bars 85% of the time at the end of a trend.
While all trends end with a squat, all squats are NOT the end of a trend.

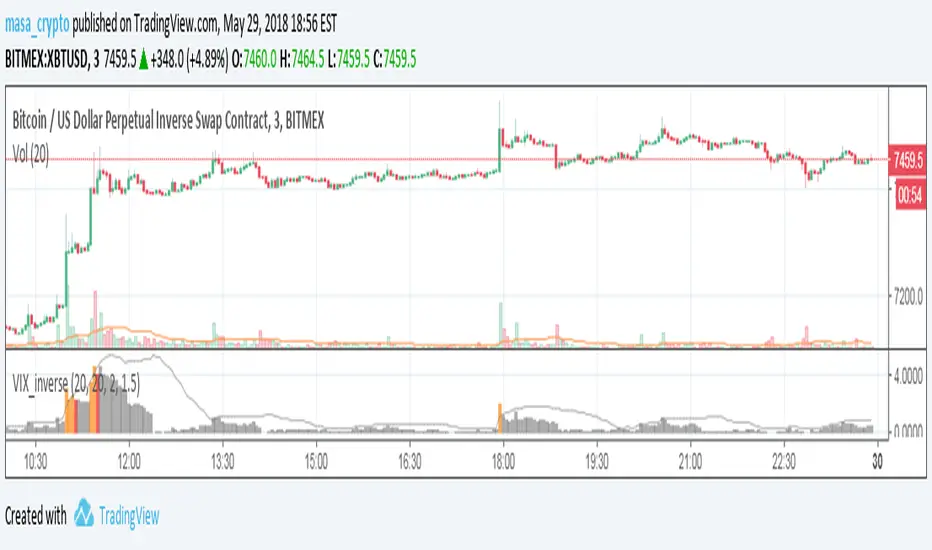
Williams Vix Fix ultra complete indicator (Tartigradia)Williams VixFix is a realized volatility indicator developed by Larry Williams, and can help in finding market bottoms.
Indeed, as Williams describe in his paper, markets tend to find the lowest prices during times of highest volatility, which usually accompany times of highest fear. The VixFix is calculated as how much the current low price statistically deviates from the maximum within a given look-back period.
Although the VixFix originally only indicates market bottoms, its inverse may indicate market tops. As masa_crypto writes : "The inverse can be formulated by considering "how much the current high value statistically deviates from the minimum within a given look-back period." This transformation equates Vix_Fix_inverse. This indicator can be used for finding market tops, and therefore, is a good signal for a timing for taking a short position." However, in practice, the Inverse VixFix is much less reliable than the classical VixFix, but is nevertheless a good addition to get some additional context.
For more information on the Vix Fix, which is a strategy published under public domain:
* The VIX Fix, Larry Williams, Active Trader magazine, December 2007, web.archive.org
* Fixing the VIX: An Indicator to Beat Fear, Amber Hestla-Barnhart, Journal of Technical Analysis, March 13, 2015, ssrn.com
* Replicating the CBOE VIX using a synthetic volatility index trading algorithm, Dayne Cary and Gary van Vuuren, Cogent Economics & Finance, Volume 7, 2019, Issue 1, doi.org
Created By ChrisMoody on 12-26-2014...
V3 MAJOR Update on 1-05-2014
tista merged LazyBear's Black Dots filter in 2020:
Extended by Tartigradia in 10-2022:
* Can select a symbol different from current to calculate vixfix, allows to select SP:SPX to mimic the original VIX index.
* Inverse VixFix (from masa_crypto and web.archive.org)
* VixFix OHLC Bars plot
* Price / VixFix Candles plot (Pro Tip: draw trend lines to find good entry/exit points)
* Add ADX filtering, Minimaxis signals, Minimaxis filtering (from samgozman )
* Convert to pinescript v5
* Allow timeframe selection (MTF)
* Skip off days (more accurate reproduction of original VIX)
* Reorganized, cleaned up code, commented out parts, commented out or removed unused code (eg, some of the KC calculations)
* Changed default Bollinger Band settings to reduce false positives in crypto markets.
Set Index symbol to SPX, and index_current = false, and timeframe Weekly, to reproduce the original VIX as close as possible by the VIXFIX (use the Add Symbol option, because you want to plot CBOE:VIX on the same timeframe as the current chart, which may include extended session / weekends). With the Weekly timeframe, off days / extended session days should not change much, but with lower timeframes this is important, because nights and weekends can change how the graph appears and seemingly make them different because of timing misalignment when in reality they are not when properly aligned.

Williams Fractals + SMMAwilliams fractail + smoothed moving average. moving average. williams fractails with moving average , williams fractails + MA, smma

Williams A/D IndicatorWilliams A/D Indicator, with three choices of ema (regular, double, and zero-lag). Running sum of positive accumulation values (buying pressure) and negative distribution values (selling pressure), as determined by price's location within a given day's true range. Williams states that it is worth selling if the price makes a new high and the indicator fails to follow suit. As well, it's better to purchase if prices fall to a new bottom while the A/D indicator fails to reach a new low.


Williams_VIX_fix_inverseThe volatility index, Williams vix fix developed by Larry Williams, is a well-known index for finding market bottoms. It describes how much the current low price statistically deviates from the maximum within a given look-back period.
The inverse can be formulated by considering "how much the current high value statistically deviates from the minimum within a given look-back period." This transformation equates Vix_Fix_inverse. This indicator can be used for finding market tops, and therefore, is a good signal for a timing for taking a short position.