coates moving averages (cma)This indicator uses three moving averages:
2 period low simple ma
2 period high simple ma
9 period least squares ma
The trend is determined by the angle of the moving averages, current close relative the the 9 least squares ma (lsm) and the current close relative to the prior two periods high and low.
When there are consecutive closes inside the prior two candles high and low then a range is signaled:
In ranges the buy zone is between the lowest low and the lowest close of the current range. The sell zone is between the highest high and the highest close. The zones are adjusted as long as the new close is within the prior two candles range:
When price closes above the 2 high ma and the 9 lsm then a bull trend is signaled if all moving averages are angled upward (as seen at #4 in the chart above and #1 the chart below ). If the 9 lsm and / or the 2 low ma continue to angle downward, following a close above the 2 high ma and 9 lsm, then a prolonged range or reversal is expected (#2 in the chart below):
During a bull trend the buy zone is between the 2 low ma and the 9 lsm. The profit target is the 2 high ma:
During dip buying opportunities price should resist closing below the 9 lsm. If there is one close below the 9 lsm then it is a canary in the coalmine that tells us to proceed with caution. This will often signal a range, based on the conditions outlined above. To avoid a prolonged range, or reversal, price needs to immediately react in the direction of the prevailing trend:
If the moving averages are angled down and the most recent close is below the 2 low ma and 9 lsm then trend is fully bearish:
During a bear trend the short zone is between the 2 high ma and 9 lsm. The profit target is the 2 low ma:
When the 2 high ma angles down and the 2 low ma angles up while price closes inside both mas then it indicates a cma squeeze:
Volatility is expected in the direction of the breakout following the squeeze. In this situation traps / shakeouts are common. If there is a wick outside the cma, with a close inside, then it indicates a trap / shakeout. If there is a close outside the 2 high / low ma then it signals a breakout.
A trend is considered balanced when the 9 lsm is roughly equidistant from the 2 low and 2 high mas. If the 9 lsm crosses the 2 high or 2 low ma then it signals exhaustion / imbalance.
For a stop loss I use the prior three periods low, for bull trends, and the prior three periods high for bear trends. I would expect other reliable stops, such as the parabolic sar or bill williams fractal, to be effective as well. The default moving averages should be very effective on all timeframes and assets classes, however this indicator was developed for bitcoin with a focus on higher timeframes such as the 4h, daily and weekly.
As with any other technical indicator there will be bad signals. Proceed with caution and never risk more than you are willing to lose.
스크립트에서 "weekly"에 대해 찾기

MA200W buy sell BTC ColoredA script to help you plan your entrances and exits with beautiful colors for BTC. It just helps to better highlight the gap between the start of the week and the end.
It only work on Weekly.
Info :
Blue ... you can wait, enjoy your life
Green is when you buy
Yellow when you enter bull market
Orange is when you begin to take care of next week
Red when you begin to sell low part
White, if while a week you see white you can sell bigs bags, if it end with White you can close majors positions
Warning White may not appear, if second week after first Red week is not White you can sell large position
Good luck and take a breath

Valuation Bands - Customized Bollinger BandsValuation Bands are supposed to be used for taking INVESTMENT decisions. Hence best time frames to use these bands are Daily & Weekly.
These bands are an attempt to represent a stock's valuation in terms of its pricing. Obviously, there is no relation between actual valuation determined through Fundamental Analysis.
The bands have been created by modifying Bollinger band settings. There are 3 bands Over-Valuation Band, Average Valuation Band & Under Valuation Band.
OVER VALUATION BAND
- Do not create fresh positions near or above this band
- If the price is trading above the band; hold onto your investment unless there is closing below this band.
- If the price closes below this band; wait for a reversal sign to create a fresh entry.
AVERAGE VALUATION BAND
- Create a new or keep adding more to your existing positions as the price approaches this band.
- It is recommended to exit if this band is broken & wait for fresh entry.
UNDER VALUATION BAND
- Look for a fresh investment opportunity after there is closing above this band
- Do not create fresh positions unless there are clear reversal signs.
You can use this indicator along with REKAB & RECAT to confirm entry points.

Indices Sector SigmaSpikes█ OVERVIEW
“The benchmark Dow Jones Industrial Average is off nearly 300 points as of midday today...”
“So what? Is that a lot or a little? Should we care?”
-Adam H Grimes-
This screener aims to provide Bird-Eye view across sector indices, to find which sector is having significant or 'out-of-norm' move in either direction.
The significance of the move is measured based on Sigma Spikes, a method proposed by Adam H. Grimes, where Standard Deviation of returns used as a baseline.
*You can google his blog or read his book, got some gold in there, especially on how he use indicators for trading
█ Understanding Sigma Spikes
As described by Grimes, moves in markets are only meaningful when we consider what “normal” is for that market.
Without that baseline, the daily change number, and even the percent change on the day doesn’t really mean much.
To overcome that problem, Sigma Spikes, as a measure of volatility, attempt to put todays change in price (aka return) in context of the standard deviation of 20 days daily's return.
Refer chart below:
1. The blue bars refer to each days return
2. The orange line is 1 time standard deviation of past 20days daily's return (today not included)
3. The red line is 2 time standard deviation of past 20days daily's return (today not included)
Using the ratio of today's return over the Std Deviation, determining your threshold (1,2,3,etc) will be the key that tells if today's move is significant or not.
*Threshold referring to times standard deviation, and different market may require different threshold.
*20 Days period are based on the Lookback Period, adjustable from user input window.
█ Features
- Scan up to 13 symbols at a time (Bursa (MYX) indices are defaulted, but you may change to any symbols/index from the user input setting)
█ Limitation
- Due to multiple use of security() function required to call other symbols, expect the screener to be slow at certain times
- Custom Timeframe currently accept only Daily and Weekly. I'll try to include lower timeframe in the next update
█ Disclaimer
Past performance is not an indicator of future results.
My opinions and research are my own and do not constitute financial advice in any way whatsoever.
Nothing published by me constitutes an investment recommendation, nor should any data or Content published by me be relied upon for any investment/trading activities.
I strongly recommends that you perform your own independent research and/or speak with a qualified investment professional before making any financial decisions.
Any ideas to further improve this indicator are welcome :)

Rain On Me IndicatorFinally, we made it :D
Rain On Me Indicator, As the name suggests this indicator will make money rain on you. More seriously, this indicator contains :
This indicator contains:
-Bullish and bearish RSI divergences showing on chart with alerts.
-Parabolic SAR with Labels on chart with buying or selling alerts.
-3 Moving Average (MA 1 : 7, MA 2 : 21 MA 3 HIDDEN : 50 (Cross alerts for Pullback)
-Customizable Bollinger band
-Fibonacci on 10 levels with the level 0 to the middle. This Fibonacci help a lot since it can let you find easily entry/exit point, trend and even where to place your Take Profit and Stop Loss. It have alerts for most important levels (0.382, 0.§, 0.618) for Crossunder and Crossover in Bullish or Bearish trend.
-Fully Customizable Ichimoku Cloud.
-Trend Buy/Sell Labels on chart with buying or selling signal alerts.
-Trend color visible on candles.
If an alert trigger of Buy/Sell Signal with the same alert based on PSAR, so you can be confident to enter in position. Alway checking fibs level that is the key thing with this indicator. the script has been set to have the best possible results on as many market as possible. But.best result for zfter backtesting is on
Forex : EUR/USD, USDJPY, USDCAD.
Indice : S&P500, NASDAQ, DOWJONES
Commodities : OIL, WTI
Everything work on following timeframe :
15MN, 1H, 4H, DAILY, WEEKLY.
So that you can avoid having to set it again, whether it be in minutes, hours, days, months.
So you can easily trade in the mode that suits you best. It works well on everything from indices to forex to commodities etc. I thank all those who allowed me to carry out this project. IF you feelt free to give your ideas, suggestions, for improve it by sending me messages.
This is really a first version sp it may contain bugs / errors that will be fixed over time.
A BIG THANK YOU TO QUANTNOMAD WHO GIVE ME HIS PERMISSION TO USE, MODIFY AND REPUBLISH HIS "Ultimate Pivot Points Alerts" Script Indicator :
Good trade to all !

mtf b zonesThese zones helps to do intraday, short term & long term. The blue lines are for intraday. The small green and red dotted lines are for weekly. The large green and red dotted lines are for monthly. use this along with price action trading. Best wishes. Thank you....
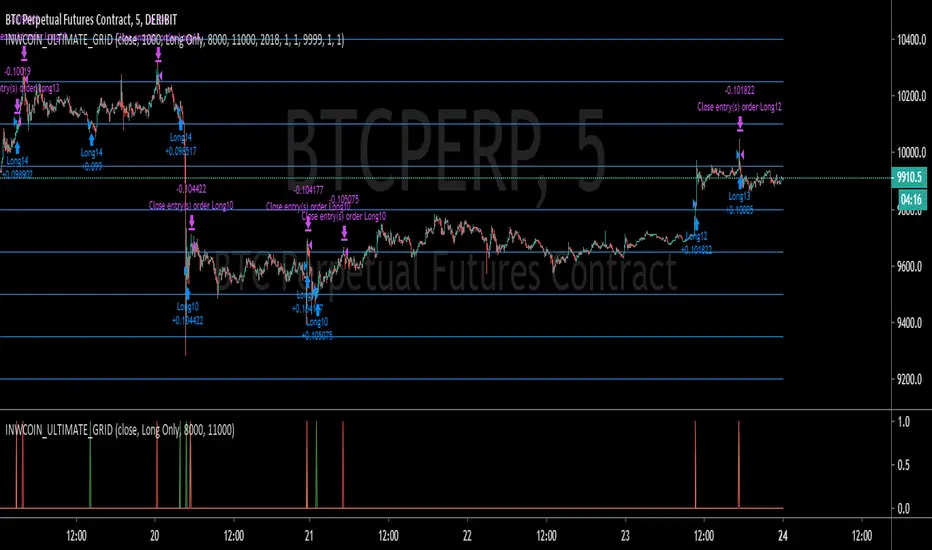
inwCoin Ultimate Grid StrategyinwCoin Ultimate Grid Strategy is the proof of concept of infamous grid trading strategy.
IDEA :
- The idea is to put the price level as a grids on the chart and when price cross up or cross down it will enter position.
- If the price move to next level it will take profit the last level and enter new position.
Caution :
- If market is trending into one direction, it's not wise to run this strategy counter trend. eg. run short grid when trend is up or run long grid when trend is down.
- So make sure you have something to define the big trend like Moving Average (18) TF weekly.
- I still can't try in range market ( sideway ) because this strategy using 5 min TF to work and tradingview don't provide data back that far.
How to use
1) Find out which start value of your asset that you want to use. Eg. BTC is 8000 for this time ( 22/2/2020 )
2) Define the spread of each grid as percent. ( eg. 2% for BTC ). You can choose small percent like 0.2% or 0.01 in asset like currency or altcoin/btc
3) The default grid level is 20 grids, so you can try and try again until you happy with the result.
4) This strategy is fix position size so it can easily calculate.
5) Don't forget to check "Properties" tab to try changing capital size and fee rate to match your criteria
6) This strategy is not perfect, it just some proof of concept to see if the strategy is working in real trade.
Extra :
If you want to access to alert for this strategy you can inbox me for detail.
Chingas MTF SMASuper simple Multi Time Frame Simple Moving Average.
This is hard coded to auto select the 200 SMA from multiple timeframes such as the 30m, 1H, 4H, Daily and Weekly.
I am hopeful in another version to be able to get the 12H available in a drop down but at the present moment, it is not an option.
This script will give the convenience of seeing where a Moving Average on another timeframe sits, no matter what timeframe you are currently displaying.

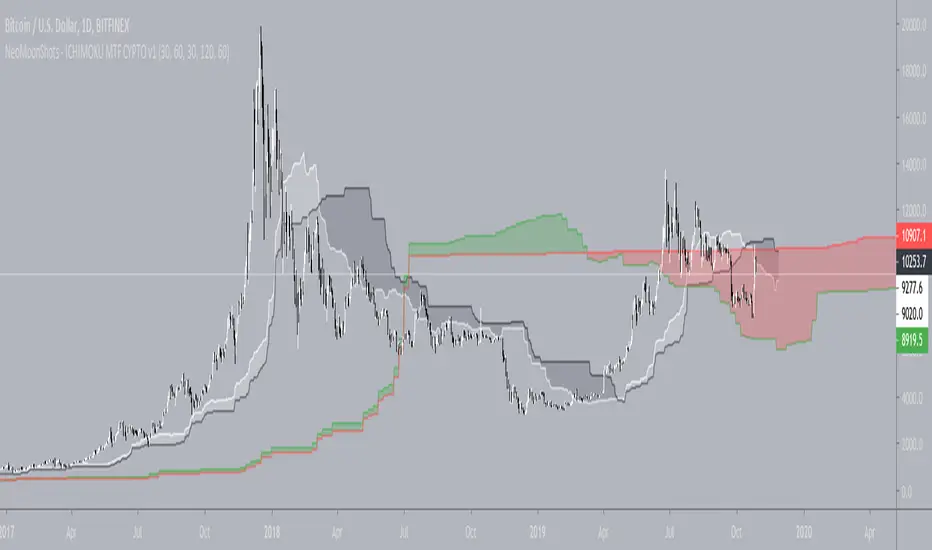
NeoMoonShots - ICHIMOKU MTF CYPTO V1Ichimoku cloud study to support multiple time frame (TF) at any given TF.
Supported TFs are:
1. 1 Hour
2. 4 Hour
3. Daily
4. 2Days
5. 3Days
6. Weekly.
Infopanel to show SenkouSpan A and B levels.
Multi TF - RSIRSI with 5 timeframes, you can change the TF it in the configs.
This one has 1h, 2h, 4h, Daily and Weekly.

Golden Cross by -Westy-Quick Guide
- Yellow cross and green MA on top = Potential uptrend
- Yellow cross and red MA on top = Potential downtrend
A simple golden cross indicator of the green 50 and red 200 SMA with a yellow cross for ease of visibility and backtesting.
Generally, longer time frames more powerful signals but are less frequent. I typically use it on the 4 hour, daily and weekly.


Multiple MAs & EMAsMultiple MA & EMA for swing and scalp trading. Good for every timeframe with specific MA's for weekly.
Suited for Bitcoin. Change the MA periods if you want to use it on other assets.
6 SMA's (fit to BTC) 9,20,30,50,128,200 (exponential optional)I've been using these for a while trading Bitcoin and I've found them to be the most useful to me. I replaced the 7 you may have seen in the first set with the 9 as I'm seeing it tested across many time frames quite frequently. The least used of the six is the 30 period, but it does have some influence I've found on the large time frames, mainly the weekly.

StochRSI and RSI StrategyThis is a strategy that is based around using the general value of the RSI to determine the trend and then using the Stoch RSI to pick and entry point.
It also uses the RSI to determine a profit taking point or exit point from the trade.
This version doesn't have a stop loss other than the signal to trade the opposing direction. Therefore it is more effective in higher trading time frames like Daily and Weekly.
I have also added the function of selecting the time frame for which the strategy is applied to.

'OPEXXINQ' Market CapsMarket Caps for the following:
OMGUSD
PARTUSD
EOSUSD
XLMUSD
XMRUSD
IOTUSD
NEOUSD
QTUMUSD
Supplies refreshed weekly.

'PLINEOX' DominanceCustom index of dominance for the following:
PARTUSD
LTCUSD
IOTUSD
NEOUSD
EOSUSD
OMGUSD
XMRUSD
Supply refreshed weekly. PM me if you want a custom index.


Quantitative Qualitative Estimation (QQE)The indicator QQE, is an interesting tool based on a Relative Strength Index (RSI). While the original RSI is often used as a pointer for overbought or oversold market phases, the QQE provides additional information. Use the QQE to display trend direction and trend strength .
For me this is one of the most important indicator for Trend Following.
##This QQE indicator is an improved version made by 'mladen' for Metatrader 4.
The histogram does not differ from the original QQE! The developer has adapted the scaling so that the central horizontal level is zero. It has no effect to the result, but is much more convenient to analyze the trend.
Main Signals
Background changes when the black line crosses the grey line.
Identify the trend direction
Singal turns green while the main QQE trendline is above the zero line and red while it is below.
This works best in the major timeframes like Daily or Weekly.
You can activate this signal in the settings.
NYSE:THO
Identify the trend strength
_Histogram Colors_
Green (above 10): bullish
Red (below -10): bearish
Yellow: flat
It is not a buy or sell signal when the color of the histogram changes. It only says that one side could gained the advantage.
If you use a large timeframe like Monthly, you can reduce the number of false signal by setting the SF (Slow Factor) from 5 (default) to 1.
S&P 500, Monthly
Please always remember, there is no holy grail indicator!
...but this one defines trends quite accurately.

Madrid Upper OHLCThis study displays the candlesticks of the upper timeframe, this provides a glance of the bigger picture in the current time frame by quickly and easily identifying the main OHLC levels.
In this example I am using the indicator twice on the 15 min chart, the first implementation displays the candles of the Daily timeframe and the second displays those of the weekly.

Yacine EMA Bands V2Version 2, because of popular demand.
Default values are weekly.
Feel free to try other configurations.

Institutional MF-Vol Compression Scanner v4.0 [BIG]═══════════════════════════════════════════════════════════════════════════════
BIG COMPRESSION SCANNER v4.0
═══════════════════════════════════════════════════════════════════════════════
OVERVIEW
The BIG Compression Scanner v4.0 is a proprietary volatility regime detection system designed for systematic Daily options deployment. This framework identifies pre-expansion volatility compression zones through multi-dimensional market structure analysis, combining institutional positioning patterns with hierarchical timeframe confirmation and options market structure to generate high-conviction directional signals for premium strategies.
The methodology synthesizes volatility dynamics, liquidity flow patterns, and cross-timeframe regime alignment into a probabilistic scoring system that isolates asymmetric risk-reward setups characteristic of compression-to-expansion transitions. The framework is calibrated specifically for 30-45 DTE options strategies where timing precision and volatility environment assessment are critical to edge generation.
═══════════════════════════════════════════════════════════════════════════════
CORE METHODOLOGY
═══════════════════════════════════════════════════════════════════════════════
• Proprietary Compression Detection
The system employs a multi-factor compression identification framework that monitors volatility regime transitions across price dispersion metrics and range contraction patterns. Unlike single-indicator squeeze systems, this methodology uses weighted ensemble logic to distinguish true pre-expansion compression from random consolidation noise.
Compression strength is quantified through a proprietary scoring algorithm (0-100%) that evaluates:
- Statistical volatility contraction relative to historical norms
- Price range compression within dynamic envelope systems
- Institutional volume signature analysis during low-volatility periods
- Cross-timeframe compression alignment (Daily/Weekly/Monthly hierarchy)
The framework filters compression events based on minimum strength thresholds and multi-bar confirmation to eliminate premature signals characteristic of retail squeeze indicators.
• Hierarchical Multi-Timeframe Architecture
The indicator integrates a three-tier temporal analysis structure where higher timeframes constrain and validate lower timeframe signals:
Strategic Layer (Monthly) – Establishes macro directional bias and identifies structural market positioning. This layer determines whether intermediate trends align with or counter dominant regime dynamics.
Structural Layer (Weekly) – Provides tactical context through key price levels, momentum assessment, and volatility regime confirmation. Weekly analysis filters signals that would occur in unfavorable proximity to structural inflection zones.
Execution Layer (Daily) – Generates precise entry timing through intraday regime shift detection, momentum confluence analysis, and institutional flow pattern recognition.
Each layer contributes weighted influence to the composite directional probability model, with recalibration logic that adjusts timeframe importance based on current market regime characteristics. The exact weighting algorithm is proprietary and adapts to volatility environment dynamics.
• Options Market Structure Integration
Version 4.0 incorporates options-specific market intelligence not available in standard technical analysis frameworks:
Volatility Environment Assessment – The system continuously monitors implied volatility regime characteristics through proprietary estimation models. These models identify whether current premium levels favor buying or selling strategies, adjusting signal generation accordingly.
Temporal Decay Awareness – Built-in expiration cycle logic ensures signals only trigger when sufficient time value remains for thesis development. The framework approximates days-to-expiration and applies minimum threshold filters to prevent entries in high theta decay regimes.
Greeks-Aware Targeting – Price targets are dynamically calibrated based on volatility expansion expectations and estimated leverage characteristics. Target multipliers adjust to current options market structure rather than using fixed risk-reward ratios.
Premium Environment Classification – Signals are enhanced with real-time assessment of whether current volatility levels favor long premium, short premium, or spread strategies based on historical percentile analysis.
• Probabilistic Directional Scoring System
Rather than binary bullish/bearish classification, the framework generates probability-weighted directional bias through a proprietary multi-factor model. This model synthesizes trend alignment metrics, momentum characteristics, structural positioning, and institutional flow signatures into normalized probability distributions.
The scoring system evaluates dozens of market structure variables across multiple timeframes, applies regime-dependent weighting, and produces directional probabilities that reflect actual edge rather than arbitrary technical indicator thresholds. Signal generation occurs only when directional probability exceeds user-defined conviction thresholds (55-65% depending on sensitivity setting).
This probabilistic approach allows traders to calibrate position sizing and strategy selection (outright vs. spreads) to the strength of directional conviction rather than treating all signals as equal weight.
• Institutional Flow Detection
The framework monitors volume and price interaction patterns characteristic of institutional accumulation or distribution during compression phases. This analysis identifies whether compression zones contain building directional positions (high probability of sustained move post-breakout) versus thin, choppy consolidation (high false breakout risk).
Flow detection employs proprietary algorithms that distinguish genuine institutional activity from retail volume spikes, providing critical context for signal validation.
═══════════════════════════════════════════════════════════════════════════════
SIGNAL ARCHITECTURE
═══════════════════════════════════════════════════════════════════════════════
Call Option Signals trigger when compression strength, directional probability, timeframe alignment, options market structure, and institutional flow patterns simultaneously satisfy proprietary threshold criteria. Signals are filtered against weekly structural levels to avoid low-probability entries near major resistance zones.
Put Option Signals follow equivalent logic with inverse directional parameters, ensuring symmetrical framework application across bull and bear setups.
All signals include:
- Directional conviction probability (percentage)
- Current volatility environment assessment (IV Rank proxy)
- Dynamic price target based on expansion expectations
- Multi-timeframe alignment status
Signal cooldown logic prevents excessive signal generation during extended consolidation periods, maintaining signal quality over quantity.
═══════════════════════════════════════════════════════════════════════════════
VISUAL INTELLIGENCE
═══════════════════════════════════════════════════════════════════════════════
Real-Time Multi-Timeframe Dashboard
The top-right panel provides continuous visibility into:
- Trend alignment across Daily/Weekly/Monthly timeframes
- Current compression status at each temporal layer
- Momentum regime characteristics (RSI values)
- Options environment assessment (IV Rank, optimal strategy)
- Composite signal readiness (compression strength percentage)
This dashboard enables rapid regime assessment without manual multi-timeframe chart analysis.
Chart Integration
Visual overlays include:
- Volatility envelope systems (dynamic bands)
- Weekly structural price levels (pivot, resistance, support)
- Compression zone highlighting (background shading)
- Active squeeze indicators (Daily and Weekly differentiation)
Signal Labels
When setups trigger, comprehensive labels display:
📈 CALL OPTION
Prob: XX%
IV Rank: XX%
Target: $XXX.XX
Labels provide all critical execution information without requiring dashboard consultation.
═══════════════════════════════════════════════════════════════════════════════
KEY CAPABILITIES
═══════════════════════════════════════════════════════════════════════════════
- Proprietary multi-factor compression detection with adaptive thresholds
- Hierarchical multi-timeframe confirmation (Daily/Weekly/Monthly)
- Options-specific filters (IV regime, DTE requirements, Greeks awareness)
- Probabilistic directional scoring (0-100% conviction levels)
- Institutional flow pattern recognition during compression
- Weekly structural level integration with proximity filters
- Dynamic target calibration based on volatility expansion expectations
- Real-time multi-timeframe regime dashboard
- Customizable sensitivity and threshold parameters
- Non-repainting signal architecture (bar close confirmation)
- Comprehensive alert system for proactive monitoring
═══════════════════════════════════════════════════════════════════════════════
APPLICATION GUIDELINES
═══════════════════════════════════════════════════════════════════════════════
1. Timeframe Selection
Apply to Daily (D1) charts only. Framework calibration is timeframe-specific; other intervals produce suboptimal results.
2. Options Mode Activation
Enable Options Trading Mode for premium strategy optimization. This activates IV filtering, DTE thresholds, and Greeks-aware targeting.
3. Strategy Calibration
- Premium Buying: Set IV threshold to 50th percentile, DTE minimum 30+ days, target multiplier 2.5-3.0×
- Premium Selling: Set IV threshold to 70th+ percentile, DTE minimum 20-30 days, target multiplier 1.5-2.0×
4. MTF Dashboard Monitoring
Verify multi-timeframe alignment before execution:
- Ideal setup: Daily + Weekly compression both active
- Confirm trend alignment across timeframes
- Check IV Rank for premium environment assessment
- Wait for "READY" status (green) indicating threshold satisfaction
5. Signal Execution
When labels appear:
- Review directional probability (target >65% for high conviction)
- Assess IV environment (low IV favors buying, high IV favors selling)
- Use price target for strike selection and profit objectives
- Consider 30-45 DTE options for thesis development time
6. Risk Management
- Position size: 2-5% options capital per signal
- Stop loss: Exit if compression breaks opposite direction without follow-through
- Time stop: Reassess if position stagnant after 5-7 days
- Profit taking: Scale out at provided targets or weekly pivot levels
7. Sensitivity Adjustment
- High (55%): More signals, lower conviction, diversified approach
- Medium (60%): Balanced, default setting (2-4 signals/month typical)
- Low (65%): Fewer signals, higher conviction, concentrated positions
═══════════════════════════════════════════════════════════════════════════════
FRAMEWORK LIMITATIONS
═══════════════════════════════════════════════════════════════════════════════
- Optimized exclusively for Daily timeframe analysis
- Compression development requires patience (2-4 weeks typical)
- IV metrics are proprietary proxies, not direct exchange data
- Greeks estimations approximate actual options contract characteristics
- DTE calculations simplified vs. precise monthly expiration dates
- Multi-timeframe filtering reduces but cannot eliminate false breakouts
- Requires liquid options markets (tight spreads, adequate open interest)
- Not designed for earnings-driven volatility events (IV crush risk)
- Framework identifies timing, not specific strike or expiration selection
═══════════════════════════════════════════════════════════════════════════════
TECHNICAL SPECIFICATIONS
═══════════════════════════════════════════════════════════════════════════════
- Pine Script v5 architecture
- Non-repainting signal confirmation (bar close validation)
- Multi-security data integration (Weekly/Monthly via request.security)
- Real-time multi-timeframe analysis dashboard
- 4 alert conditions (Call/Put options, directional generic)
- Fully customizable parameters (compression, scoring, filters, visuals)
- Professional-grade visual hierarchy and information density
═══════════════════════════════════════════════════════════════════════════════
PROFESSIONAL CONTEXT
═══════════════════════════════════════════════════════════════════════════════
This framework is designed for systematic options traders with working knowledge of:
- Volatility regime dynamics and expansion/contraction cycles
- Options Greeks and their impact on P&L across various market conditions
- Implied Volatility Rank interpretation and premium pricing assessment
- Multi-timeframe analysis methodology and trend hierarchy
- Risk-adjusted position sizing and portfolio construction principles
The system identifies when market structure favors options deployment but does not prescribe how to construct positions. Strike selection, expiration choice, spread architecture, and position sizing require independent trader judgment based on account parameters and risk tolerance.
Optimal deployment combines this framework with:
- Options analytics platform (actual IV, Greeks, probability calculations)
- Earnings calendar awareness (pre-earnings IV inflation vs. post-earnings crush)
- Broader market regime context (VIX, correlation, sector rotation)
- Portfolio-level risk management (concentration limits, correlation analysis)
═══════════════════════════════════════════════════════════════════════════════
Proprietary compression-to-expansion framework for systematic Daily options deployment. Methodology incorporates multi-dimensional volatility analysis, hierarchical timeframe confirmation, and options market structure intelligence.

TGIF Dynamic Tracker [NINE]Overview
A professional-grade indicator for tracking weekly price ranges and identifying high-probability retracement zones based on the TGIF (Thank God It's Friday) concept from ICT (Inner Circle Trader) methodology.
What is the TGIF Concept?
The TGIF concept is based on the observation that price tends to retrace a significant portion of the weekly range toward the end of the trading week — typically on Thursday evening or Friday. This phenomenon occurs as institutional traders take profits and rebalance positions before the weekend, creating predictable retracement patterns.
By identifying the weekly high and low, traders can anticipate specific retracement levels where price is likely to find support or resistance. The most commonly referenced retracement zone is the 20-30% level, representing a shallow pullback from the week's extreme before potential continuation.
Features In Depth
Weekly High/Low Tracking
The foundation of the TGIF strategy is accurately tracking the current week's price extremes.
Automatic Detection: The indicator continuously monitors price action and updates the weekly high and low in real-time. As new extremes are made, all dependent calculations (retracement zones, percentage levels) update automatically.
Smart Session Timing: The indicator automatically detects your market type and adjusts accordingly:
Stocks/ETFs: Week begins Monday at 9:30 AM ET (market open)
Forex/Crypto/Futures: Week begins Sunday at 6:00 PM ET (18:00)
This ensures accurate weekly range calculations regardless of which market you're trading.
Visual Customization:
Enable/disable weekly high and low lines independently
Choose line color, style (solid, dashed, dotted), and thickness
Lines extend from week start to current bar
Percentage Level Lines
Individual horizontal lines mark key retracement percentages within the weekly range.
Available Levels:
20% — Shallow retracement, first potential support/resistance
30% — Edge of the primary TGIF zone
50% — Mid-range equilibrium point
60% — Beginning of deeper retracement territory
80% — Deep retracement zone
90% — Near-complete retracement
Independent Controls: Each level can be toggled on or off individually, allowing you to display only the levels relevant to your trading strategy. All levels share common styling settings for a clean, consistent appearance.
Dynamic Bias Adjustment: Levels automatically adjust based on the current weekly bias:
Bullish Bias (new weekly high made): Levels measure DOWN from the high
Bearish Bias (new weekly low made): Levels measure UP from the low
This ensures retracement zones always point toward the direction of potential pullback.
Retracement Zones
Highlighted zones visually emphasize the most significant retracement areas.
Three Configurable Zones:
20-30% Zone (Primary TGIF Zone)
This is the classic TGIF retracement area. When price makes a weekly high or low, traders anticipate a pullback to this zone before potential continuation. This shallow retracement often provides optimal risk/reward entries in the direction of the weekly trend.
50-60% Zone (Equilibrium Zone)
Represents a balanced pullback to the middle of the weekly range. Price reaching this zone suggests a more significant retracement is underway. This area often acts as a decision point — price either finds support/resistance here or continues toward deeper retracement levels.
80-90% Zone (Deep Retracement Zone)
Indicates a near-complete retracement of the weekly range. Price reaching this zone suggests the original weekly move may be fully reversing. Traders watch for reversal signals here or prepare for a potential range expansion in the opposite direction.
Zone Display Options:
Each zone can be enabled/disabled independently
Customizable background colors with transparency control
Zones only appear during the retracement period (starting Thursday/Friday)
Midlines: Optional center lines within each zone (25%, 55%, 85%) provide additional precision points. These midlines often act as the "sweet spot" within each retracement band.
Time-Based Markers
Vertical lines help you identify important session boundaries and timing.
Daily Session Lines:
Mark the start of each trading day with vertical lines extending through the weekly range.
Stocks: 9:30 AM ET (NYSE/NASDAQ open)
Forex/Crypto/Futures: 6:00 PM ET (18:00 — New York session close/new day start)
Control how many historical session lines remain visible (1-5) to avoid chart clutter while maintaining useful reference points.
Weekly Start Lines:
A distinct vertical line marks the beginning of each trading week, providing clear visual separation between weeks and helping you identify the starting point for weekly range calculations.
Retracement Start Lines:
Mark when the TGIF retracement period begins — this is when you should start watching for pullbacks to the retracement zones.
Stocks: Friday 9:30 AM ET (Friday market open)
Forex/Crypto/Futures: Thursday 6:00 PM ET (18:00)
Historical Weeks
View retracement data from previous weeks to identify recurring patterns and validate the TGIF concept on your chosen instrument.
Historical Tracking:
Display up to 20 previous weeks of data
Each historical week shows its own high/low lines, retracement zones, and time markers
Helps identify how consistently the instrument respects TGIF levels
What's Displayed:
Weekly high and low boundaries
All enabled retracement zones with midlines
Weekly start and retracement start lines
Optional labels for historical levels
Historical Labels: Toggle labels on historical weeks independently. Disable them to reduce clutter while keeping the visual reference lines.
Use Cases:
Backtest TGIF setups visually on your chart
Identify instruments that respect TGIF levels consistently
Study how deep retracements typically go on your chosen market
Labels & Display Modes
Comprehensive labeling options for quick reference.
Label Display Modes:
Levels: Shows only the level name (e.g., "HIGH", "20%", "50%")
Price: Shows only the price value
Both: Shows level name and price (e.g., "20% | 1.2345")
Label Positioning: Labels appear to the right of the current bar, staying visible as price action develops.
Tooltips: When using "Levels" display mode, hover over any label to see the exact price in the tooltip.
Label Customization:
Text size: Tiny, Small, Normal, Large, Huge
Text color selection
Labels use monospace font for clean alignment
Info Table
An optional real-time summary table showing all current levels and their distance from price.
Table Contents:
Current day indicator (MON, TUE, WED, THU, FRI)
All six percentage levels (20%, 30%, 50%, 60%, 80%, 90%)
Exact price for each level
Distance from current price to each level
Adaptive Theming: The table automatically detects your chart's background color (light or dark) and adjusts text and border colors for optimal readability.
Display Settings:
9 position options (corners, edges, and center)
Size options: Tiny, Small, Normal, Large
Practical Use: Quickly identify which level is nearest to current price without visually scanning the chart. The distance column helps assess how far price needs to travel to reach key zones.
Smart Market Detection
The indicator automatically identifies your market type and adjusts all timing calculations.
Detected Market Types:
Stocks & ETFs:
Week starts: Monday 9:30 AM ET
Daily sessions: 9:30 AM ET
Retracement period begins: Friday 9:30 AM ET
Standard equity market hours apply
Forex & Crypto:
Week starts: Sunday 6:00 PM ET (18:00)
Daily sessions: 6:00 PM ET (18:00)
Retracement period begins: Thursday 6:00 PM ET (18:00)
24-hour market timing with New York session rollover
Futures Contracts:
Automatically detected via common futures symbols (ES, NQ, YM, RTY, CL, GC, etc.)
Uses forex-style timing (18:00 ET rollover)
Handles continuous contracts and front-month symbols
This automatic detection ensures you get accurate weekly ranges without manual configuration.
Bias Tracking
The indicator dynamically tracks weekly directional bias to orient retracement calculations correctly.
How Bias is Determined:
When price makes a new weekly high, bias shifts to BULLISH
When price makes a new weekly low, bias shifts to BEARISH
Bias can change multiple times throughout the week as new extremes are made
Why Bias Matters:
Retracement levels are calculated from the appropriate extreme based on current bias:
Bullish bias: Levels measure DOWN from the weekly high (anticipating pullback from high)
Bearish bias: Levels measure UP from the weekly low (anticipating pullback from low)
This ensures the 20-30% zone always represents a shallow retracement in the context of the current weekly direction.
Tips
Best Results on Trending Weeks: TGIF works best when there's a clear weekly direction. Choppy, range-bound weeks may not produce clean retracements.
Combine with Other Confluence: TGIF levels are most powerful when they align with other technical factors — Fair Value Gaps, order blocks, previous week highs/lows, or key support/resistance levels.
Use Historical Data: Enable historical weeks to see how your instrument typically respects TGIF levels. Some instruments are more "TGIF-friendly" than others.
Midlines as Precision Points: The midlines (25%, 55%, 85%) often act as the exact reversal point within each zone. Watch for reactions specifically at these levels.
Friday Afternoon Caution: Late Friday sessions can be thin and choppy. Consider taking profits or reducing position sizes heading into the weekend.
Requirements
Intraday Timeframes Only: This indicator requires timeframes of 1 hour or less for accurate session and weekly boundary detection.
Sufficient Historical Data: When using the Historical Weeks feature, ensure your chart has enough bars loaded to display the requested number of weeks.
Session-Based Markets: Optimized for markets with distinct sessions. Continuous 24/7 markets may show different characteristics.
Disclaimer
For Educational and Informational Purposes Only
This indicator is provided as a technical analysis tool for educational and informational purposes only. It is not intended as, and should not be construed as, financial advice, investment advice, trading advice, or any other type of advice.
No Guarantees: Past performance of any trading strategy, indicator, or methodology is not indicative of future results. The TGIF concept and associated retracement levels do not guarantee that price will behave in any predicted manner. Markets are inherently
unpredictable, and no technical indicator can accurately predict future price movements.
Risk Warning: Trading financial instruments involves substantial risk of loss and is not suitable for all investors. You should carefully consider your investment objectives, level of experience, and risk appetite before trading. Never trade with money you cannot afford to lose.
Not Financial Advice: The creator of this indicator (NINE) is not a licensed financial advisor, broker, or dealer. Nothing in this indicator or its documentation should be interpreted as a recommendation to buy, sell, or hold any financial instrument.
Your Responsibility: You are solely responsible for your own trading decisions. Always conduct your own research and due diligence before making any trading or investment decisions. Consider consulting with a qualified financial professional before trading.
No Liability: The creator assumes no responsibility or liability for any errors, inaccuracies, or omissions in this indicator or its documentation. The creator shall not be held liable for any losses, damages, or costs arising from the use or inability to use this indicator.
