Compression Patterns (w/ Trend + Proximity Filter)🧠 Description:
This indicator identifies high-probability price compression patterns within trending environments — a setup prized by experienced swing and day traders alike. It combines the classic NR4, NR7, 2-Bar NR, 3-Bar NR, and Inside Day formations with a powerful trend filter and proximity logic to deliver clear, focused signals.
🔍 What's Inside:
▪️ Compression Patterns
The core of this tool lies in the logic of price compression. These patterns signal the market taking a breath — volatility contracts, volume dries up, and price coils like a spring.
When this happens in the right context, the next move is often explosive.
NR4 / NR7: Narrowest range in 4 or 7 bars — excellent for spotting the quiet before the storm.
2-Bar NR / 3-Bar NR: These identify the tightest consecutive 2 or 3-day ranges over the past 20 days — contextually rare and powerful.
Inside Day: A simple but highly effective consolidation pattern, especially when it clusters around key moving averages.
▪️ Trend Filter (EMA Stack)
You could say this is where most indicators fall apart — no context.
This one doesn’t make that mistake.
Signals only fire when the 10 EMA > 20 EMA > 50 EMA, and price is above the 20 EMA. That’s a strong, established uptrend — the only environment where breakouts are statistically favourable.
Why?
Because trend following works.
It may not give you fixed daily returns, but it’s the only strategy with theoretically infinite profit potential. You risk little, trade less, and position yourself for rare but massive moves. That’s the edge.
▪️ Proximity Filter (1 ATR to EMA)
We’ve added another layer of discipline. Signals only fire when price is:
Within 1 ATR of the 10 EMA (if price is above it), or
Within 1 ATR of the 20 EMA (if price is below the 10 EMA)
This ensures you’re not chasing. You’re waiting for tight, controlled pullbacks into dynamic support — exactly where institutions add size, not exit.
⚙️ Fully Customisable:
Toggle visibility of each pattern
Custom colours and transparency for label & background
Adjustable ATR length and multiplier
Change label text if needed (useful for translations or tweaks)
🎯 Ideal Use Case:
Swing trading off the daily chart
Day trading with VWAP/MACD filters (in alternate versions)
Supplementing price action strategies
🔚 Final Word:
This isn’t an “everything scanner.”
It’s a discerning sniper scope for traders who wait patiently for clean trends, tight consolidations, and perfect proximity — then strike.
스크립트에서 "trend"에 대해 찾기

NR4/NR7 + Trend + MACD + VWAP FilterThe Ultimate Momentum-Compression Strategy
This strategy merges the power of price compression and trend confirmation, ensuring you're trading when the market is coiled and ready to move. By combining multiple filters—NR4/NR7, trend alignment, MACD momentum, and VWAP support—this setup identifies high-probability trade opportunities in dynamic, trending stocks. Here's how it works:
NR4/NR7 Patterns: These are narrow-range days where the current price range is smaller than the previous 4 or 7 days. This signals potential breakout or continuation setups, as the market is compressing before making a move.
Trend Confirmation: To ensure you're not trading against the current trend, the price must be above the 20 EMA, and the 10 EMA must be above the 20 EMA. This confirms a bullish structure, with the price trending in your favour.
MACD Momentum: The fast MACD line must be above the slow MACD line, confirming the trend is not only intact but also gaining momentum.
VWAP Filter: Price must be above the VWAP (Volume Weighted Average Price). This is the final confirmation that the market is in a strong, bullish phase, with buyers dominating the market.
By requiring all these conditions to align, this strategy takes the guesswork out of day trading. It ensures you're trading within a well-established trend, with compression patterns and momentum backing your trade. The result? You’re entering positions with confidence and clarity, poised to ride strong, sustained moves.
This strategy is for the trader who values both flexibility and discipline—able to capture dynamic moves while staying aligned with market structure and momentum. It’s a refined, systematic approach that makes decisions clear, without the emotional second-guessing.

Multi-Timeframe Trend Analysis [BigBeluga]Multi-Timeframe Trend Analysis
A powerful trend-following dashboard designed to help traders monitor and compare trend direction across multiple higher timeframes. By analyzing EMA conditions from five customizable timeframes, this tool gives a clear visual breakdown of short- to long-term trend alignment.
🔵Key Features:
Multi-Timeframe EMA Dashboard:
➣ Displays a table in the top-right corner showing trend direction across 5 user-defined timeframes.
➣ Each row shows whether ema is rising or falling its corresponding EMA for that timeframe.
➣ Green arrows (🢁) indicate uptrends, purple arrows (🢃) signal downtrends.
Custom Timeframe Selection:
➣ Traders can input any 5 timeframes (e.g., 1h, 2h, 3h, etc.) with individual EMA lengths for flexible trend mapping.
➣ The tool auto-adjusts to match and align external timeframe EMAs to the current chart for seamless overlay.
Dynamic Chart Arrows:
➣ On-chart arrows mark when EMA rising or falling EMAs from the current chart timeframe.
➣ Each EMA arrows has a unique transparency level—shorter EMA arrows are more transparent, longer EMA arrows are more vivid. (Hover Mouse over the arrow to see which EMAs it is)
Gradient EMA Plotting:
➣ All five EMAs are plotted with gradually increasing opacity.
➣ Gradient fills between EMAs enhance visual structure, making it easier to track convergence/divergence.
🔵Usage:
Trend Confirmation: Use the dashboard to confirm multi-timeframe trend alignment before entering trades.
Entry Filtering: Avoid countertrend trades by spotting when higher timeframes disagree with the current one.
Momentum Insight: Track the transition of arrows from lighter to stronger opacity to visualize trend shifts over time.
Scalping or Swinging: Customize timeframes depending on your strategy—from intraday scalps to longer-term swings.
Multi-Timeframe Trend Analysis is the ultimate visual companion for traders who want clarity on how price behaves across multiple time horizons. With its smart EMA mapping and dashboard feedback, it keeps you aligned with dominant trend directions and transition zones at all times.

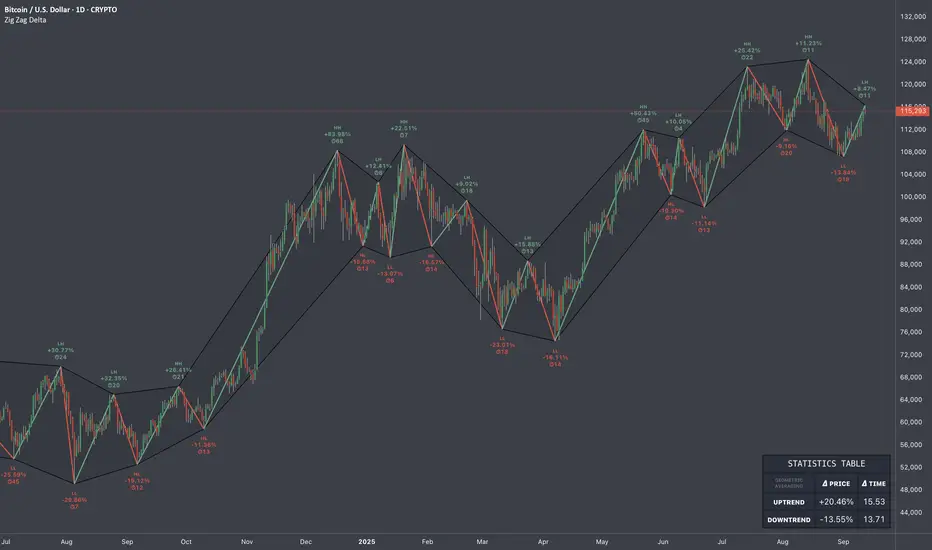
Zig Zag Trend Metrics“ Zig Zag Trend Metrics ” is a highly versatile indicator, built on the classic Zig Zag concept and thoughtfully designed for technical traders seeking a deeper, more structured view of market dynamics. This tool identifies significant swing highs and lows, classifies them, and annotates each with key metrics, offering a precise snapshot of each movement. It enhances visual analysis by drawing connecting lines that outline the flow of market structure, making trend progression and reversals instantly recognizable. Beyond visual mapping, it features a compact, real-time statistics table that calculates the average price and time deltas for both bullish and bearish swings, giving traders deep insights into trend momentum and rhythm. With extensive customization options, this indicator adapts seamlessly to vast trading styles or chart setups, empowering traders to spot patterns, evaluate trend strength, and make more confident, data-backed decisions.
❖ FEATURES
✦ Automatic Swing Detection
At its core, this indicator automatically identifies swing highs and lows based on a customizable lookback period (default: 10 bars).
✦ Labeling Swing Points
Each swing is visualized with a label that includes:
Swing Classification : “HH” (Higher High), “LH” (Lower High), “LL” (Lower Low), or “HL” (Higher Low).
Price Difference : Displayed in percentage or absolute value from the previous opposite swing.
Time Difference : The number of bars since the previous swing of the opposite type.
These labels offer traders clear, immediate insight into price movements and structural changes.
✦ Visual Lines
The indicator draws three types of lines:
Bullish Lines: Connect recent swing lows to new swing highs, indicating uptrends.
Bearish Lines: Connect recent swing highs to new swing lows, indicating downtrends.
Range Lines: Connect consecutive highs or lows to outline price channels.
Each line type can be color-coded and customized for visibility.
✦ Statistics Table
An on-screen metrics table provides a live summary of trends. Script uses Relative Averaging to smooth price and time changes. This prevents outliers from distorting the data and provides a more reliable sense of typical swing behavior.
Uptrend Metrics: Shows average price and time differences from recent bullish swings.
Downtrend Metrics: Shows the same for bearish swings.
🛠️ Customization Options
Ability to tailor the indicator to suit their strategy and aesthetic preferences:
Swing Period: Adjust sensitivity to short- or long-term swings.
Color Settings: Customize line and label colors.
Label Display: Choose between absolute or percentage price differences.
Table Settings: Modify size, location, or visibility.
This makes the indicator highly flexible and useful across various timeframes and assets.
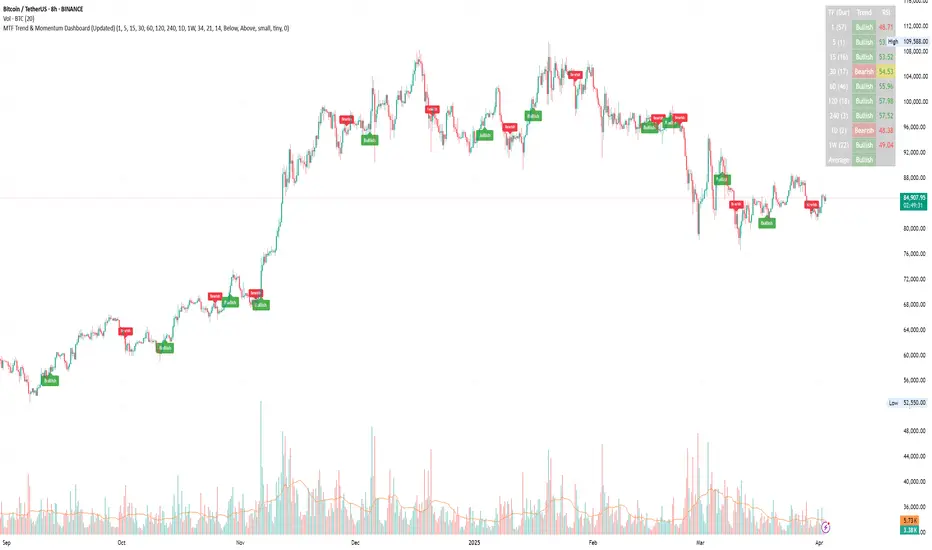
Multi-timeframe Trend & Momentum DashboardMulti-Timeframe Trend & Momentum Dashboard
This indicator is a comprehensive multi-timeframe analysis tool designed for traders who want to quickly assess market trends and momentum across several timeframes. It combines trend detection with duration tracking and displays key information in an easy-to-read on-chart table. Key features include:
Multi-Timeframe Analysis:
Analyzes nine different timeframes (from 1-minute up to 1-week) simultaneously, helping you gauge the overall market trend at a glance.
Trend Detection & Duration:
Uses a combination of a short-term EMA and a long-term SMA to determine whether the market is bullish, bearish, or neutral. It also tracks how long the current trend has persisted in terms of consecutive bars and displays this duration next to each timeframe.
RSI Display & Visual Alerts:
Calculates the RSI for each timeframe. RSI values are color-coded—green when above 50 (indicating bullish momentum) and red when below 50 (indicating bearish conditions). Additionally, if the market is bearish on a particular timeframe while the RSI is above 50, the RSI cell flashes yellow to alert you of a potential trend reversal or divergence.
On-Chart Trend Start Markers:
When a new trend is detected on your current chart’s timeframe, the indicator automatically marks the bar with a label showing the new trend direction, providing a clear visual cue for trend changes.
This powerful tool is perfect for traders looking to combine multi-timeframe trend analysis with momentum indicators, enabling a more informed and dynamic trading strategy. Whether you’re a day trader or swing trader, the Multi-Timeframe Trend & Momentum Dashboard brings clarity to market conditions across multiple time horizons.
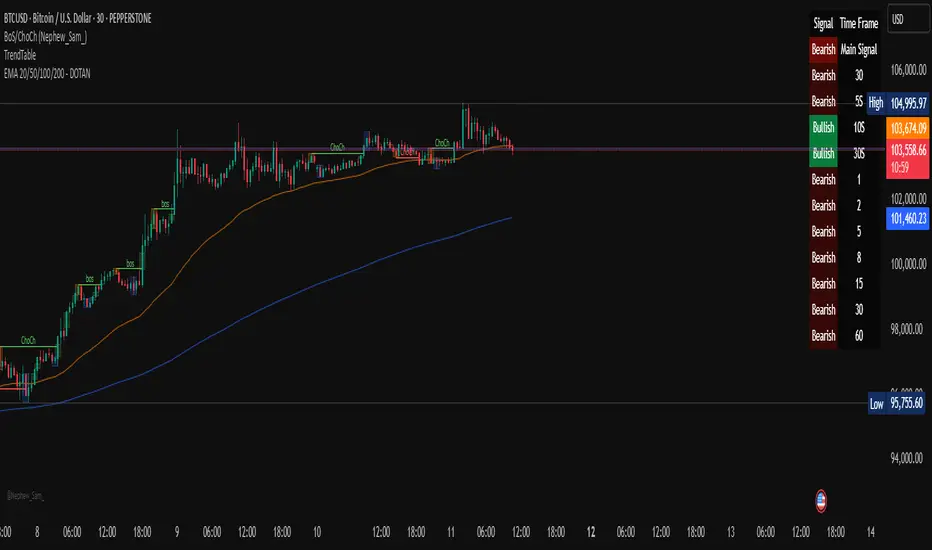
Multi-Timeframe Trend Table - DOTANMulti Timeframe Trend Signal table - Wizord_KS
"Multi-Timeframe Trend Table"
This Pine Script indicator displays a table on the TradingView chart that shows the trend direction (Bullish/Bearish) across multiple timeframes. The trend is determined using a Simple Moving Average (SMA).
🔹 Key Features of the Script
Calculates trend direction based on SMA for:
The current timeframe.
10 different user-defined timeframes.
Determines a "Main Signal" based on trend strength:
Counts the number of bullish and bearish trends across all timeframes.
Uses this count to generate an overall market sentiment (Bullish, Bearish, or Neutral).
The strength of the main signal determines its background transparency.
Displays a table in the top-right corner of the chart showing:
The main trend signal (aggregated from multiple timeframes).
The trend for the current timeframe.
The trend for each of the 10 selected timeframes.
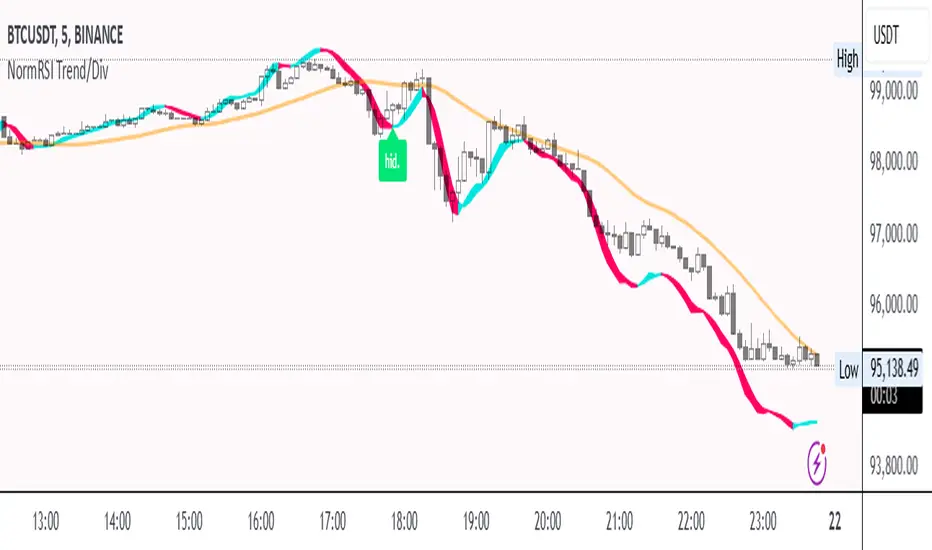
Normalized RSI Trendline with DivergencesNormalized RSI Trendline with Divergences
🔹 Overview
The Normalized RSI Trendline with Divergences indicator enhances traditional RSI analysis by normalizing RSI values within a defined range and applying a trend-following approach. It also detects bullish and bearish divergences to highlight potential trend reversals.
🔹 Features
✔ Normalized RSI Calculation – The RSI values are normalized between -1 and 1 to provide a clearer representation of market momentum.
✔ Trend & Center Lines – A trendline based on linear regression and an adaptive moving average (ALMA) for smoother trend visualization.
✔ Divergence Detection – Identifies regular and hidden divergences, displaying signals directly on the chart.
✔ Customizable Parameters – Users can adjust the signal period, lookback range, trend length, and divergence sensitivity to fit different trading strategies.
🔹 How to Use
Trend Following: The trendline helps identify the overall market direction.
Divergence Signals:
🟢 Bullish Divergence (Potential upward reversal)
🔴 Bearish Divergence (Potential downward reversal)
🟩 Hidden Bullish Divergence (Trend continuation signal)
🟧 Hidden Bearish Divergence (Trend continuation signal)
This script is suitable for trend traders, swing traders, and divergence-based strategies. Customize the settings to match your preferred trading style. 🚀
📌 Disclaimer: This script is for educational purposes only and does not constitute financial advice. Always conduct your own analysis before making trading decisions.
Waldo's RSI Color Trend Candles
TradingView Description for Waldo's RSI Color Trend Candles
Title: Waldo's RSI Color Trend Candles
Short Title: Waldo RSI CTC
Overview:
Waldo's RSI Color Trend Candles is a visually intuitive indicator designed to enhance your trading experience by color-coding candlesticks based on the integration of Relative Strength Index (RSI) momentum and moving average trend analysis. This innovative tool overlays directly on your price chart, providing a clear, color-based representation of market sentiment and trend direction.
What is it?
This indicator combines the power of RSI with the simplicity of moving averages to offer traders a unique way to visualize market conditions:
RSI Integration: The RSI is computed with customizable parameters, allowing traders to adjust how momentum is interpreted. The RSI values influence the primary color of the candles, indicating overbought or oversold market states.
Moving Averages: Utilizing two Simple Moving Averages (SMAs) with user-defined lengths, the indicator helps in identifying trend directions through their crossovers. The fast MA and slow MA can be toggled on/off for visual clarity.
Color Trend Candles: The 'Color Trend Candles' feature uses a dynamic color scheme to reflect different market conditions:
Purple for overbought conditions when RSI exceeds the set threshold (default 70).
Blue for oversold conditions when RSI falls below the set threshold (default 44).
Green indicates a bullish trend, confirmed by both price action and RSI being bullish (fast MA crossing above slow MA, with price above the slow MA).
Red signals a bearish trend, when both price and RSI are bearish (fast MA crossing below slow MA, with price below the slow MA).
Gray for neutral or mixed market sentiment, where signals are less clear or contradictory.
How to Use It:
Waldo's RSI Color Trend Candles is tailored for traders who appreciate visual cues in their trading strategy:
Trend and Momentum Insight: The color of each candle gives an immediate visual representation of both the trend (via MA crossovers) and momentum (via RSI). Green and red candles align with bullish or bearish trends, respectively, providing a quick reference for market direction.
Identifying Extreme Conditions: Purple and blue candles highlight potential reversal zones or areas where the market might be overstretched, offering opportunities for contrarian trades or to anticipate market corrections.
Customization: Users can adjust the RSI length, overbought/oversold levels, and the lengths of the moving averages to align with their trading style or the specific characteristics of the asset they're trading.
This customization ensures the indicator can be tailored to various market conditions.
Simplified Decision Making: Designed for traders who prefer a visual approach, this indicator simplifies the decision-making process by encoding complex market data into an easy-to-understand color system.
However, for a robust trading strategy, it's recommended to use it alongside other analytical tools.
Control Over Display: The option to show or hide moving averages and to enable or disable the color-coding of candles provides users with control over how information is presented, allowing for a cleaner chart or more detailed analysis as preferred.
Conclusion:
Waldo's RSI Color Trend Candles offers a fresh, visually appealing method to interpret market trends and momentum through the color of candlesticks. It's ideal for traders looking for a straightforward way to gauge market sentiment at a glance. While this indicator can significantly enhance your trading setup, remember to incorporate it within a broader strategy, using additional confirmation from other indicators or analysis methods to manage risk and validate trading decisions. Dive into the colorful world of trading with Waldo's RSI Color Trend Candles and let the market's mood guide your trades with clarity and ease.

Dynamic 200 EMA with Trend-Based ColoringDescription:
This script plots the 200-period Exponential Moving Average (EMA) and dynamically changes its color based on the trend direction. The script helps traders quickly identify whether the price is above or below the 200 EMA, which is widely used as a long-term trend indicator.
How It Works:
The script calculates the 200 EMA based on the closing price.
If the price is above the EMA, it suggests a bullish trend, and the EMA line turns green.
If the price is below the EMA, it suggests a bearish trend, and the EMA line turns red.
An optional background color is added to enhance visual clarity, highlighting the current trend direction.
Use Cases:
Trend Confirmation: Helps traders determine if the overall trend is bullish or bearish.
Support and Resistance: The 200 EMA is often used as dynamic support/resistance.
Entry & Exit Signals: Traders can use crossovers with the 200 EMA as potential trade signals.
This script is designed for traders looking for a simple yet effective way to incorporate trend visualization into their charts. It is fully open-source and can be customized to fit individual trading strategies.

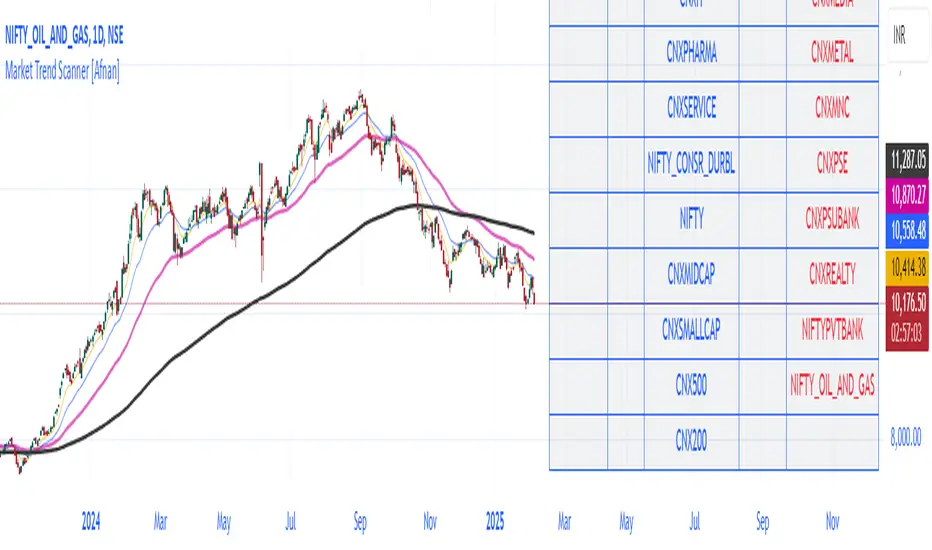
Market Trend Scanner [Afnan]This Market Strength Scanner indicator is designed to provide traders with a clear and concise overview of market trends using a single table. It helps you quickly determine which sectors and indices are strong, weak, or choppy, allowing you to make informed trading decisions with ease.
How This Indicator Helps You:
✅ Identify Strong Sectors & Indices
🔹By analyzing this table, you can instantly see which sectors and indices are performing well.
🔹Focus on stocks within strong sectors to find high-probability buying opportunities.
✅ Avoid Weak or Choppy Markets
🔹The indicator highlights bearish or consolidating sectors, helping you avoid poor trading conditions.
🔹Stay away from sectors that are weak or moving sideways to reduce unnecessary risks.
✅ Understand Market Sentiment in Seconds
🔹If most sectors are bullish, the market is in an uptrend—giving you confidence to take long positions.
🔹If the majority are bearish, the market is weak, signaling caution.
🔹A mix of bullish and bearish sectors indicates a choppy market, warning you to avoid trading or adjust your strategy.
✅ Powered by 4 Customizable EMAs
🔹The indicator uses 4 Exponential Moving Averages (EMAs) to determine trends for each sector and index.
🔹These EMAs are fully modifiable, allowing you to adjust them based on your preferred strategy.
✅ Covers 25 Major Indices (Fully Customizable)
🔹By default, the indicator tracks 25 key indices, giving you a broad market perspective.
🔹You can customize the list to focus on the indices that matter most to you.
Why Use This Indicator?
🔹 Saves Time – No need to analyze multiple charts manually. The table gives you everything at a glance.
🔹 Improves Trade Selection – Focus only on strong sectors for better trade accuracy.
🔹 Works in All Market Conditions – Whether the market is trending or consolidating, this tool keeps you informed.
🔹 Fully Customizable – Adjust the EMAs and indices according to your trading preferences.
With just this one powerful indicator, you get a complete market overview, helping you align your trades with the current trend effortlessly! 🚀
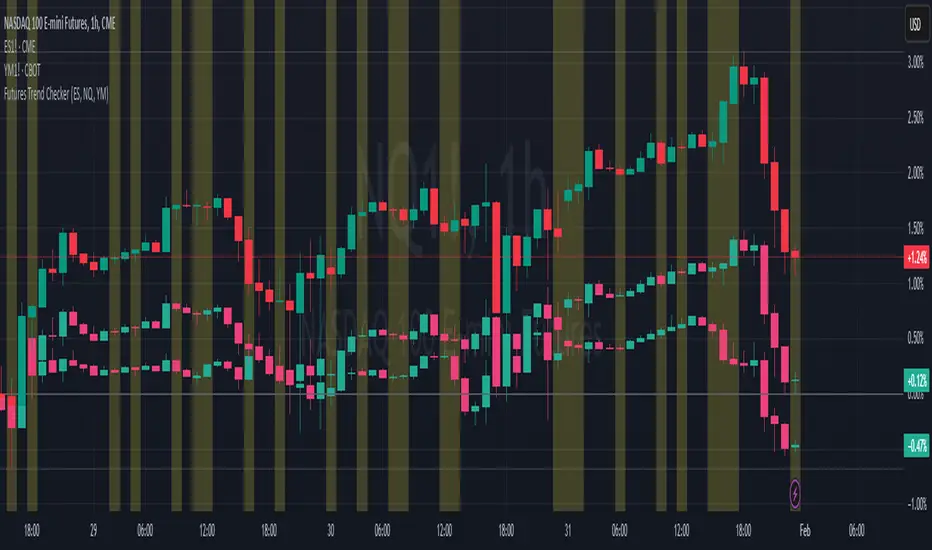
ELHAI Futures Trend Checker (ES, NQ, YM)The ELHAI Futures Trend Checker is a powerful TradingView indicator designed for futures traders who want to monitor the trend synchronization of the three major U.S. futures indices:
✅ E-mini S&P 500 (ES1!)
✅ E-mini Nasdaq 100 (NQ1!)
✅ E-mini Dow Jones (YM1!)
This indicator checks whether all three futures indices are bullish or bearish during each candle formation. If one of them is out of sync (e.g., two indices are bullish while one is bearish), the indicator triggers an alert and highlights the background in red, helping traders identify potential market indecision or divergence.
Key Features
📌 Designed for Futures Traders – Focuses on ES, NQ, and YM futures contracts.
📌 Live Market Monitoring – Works in real-time and updates dynamically with each tick.
📌 Bullish/Bearish Trend Confirmation – Detects when all three indices are in sync.
📌 Mismatch Detection – Alerts you when at least one index is out of trend.
📌 Custom Alerts – Set up TradingView alerts to be notified instantly when a trend mismatch occurs.
📌 Visual Background Highlight – A red background warns of a market divergence.
How It Works
The script retrieves open and close prices for ES, NQ, and YM.
Determines whether each futures index is bullish (close > open) or bearish (close < open).
If all three indices are bullish or all are bearish, it remains neutral.
If one index is different, an alert is triggered and the background turns red.
How to Use
Apply the indicator to your TradingView chart.
Choose any timeframe – Works well on intraday, daily, or higher timeframes.
Enable alerts: Go to Alerts → Create Alert, select "Futures Trend Mismatch", and set your preferred alert frequency.
Use alongside other indicators like moving averages, RSI, or MACD for better trade confirmation.
Best Use Cases
✔ Day traders & scalpers – Quickly spot market divergence in live trading.
✔ Swing traders – Identify when futures markets lose synchronization.
✔ Trend followers – Confirm if all major futures markets are aligned before making a move.
Final Notes
This indicator was built for Elhai to provide real-time trend analysis across major U.S. futures indices. Use it as a confirmation tool to improve market timing and decision-making.
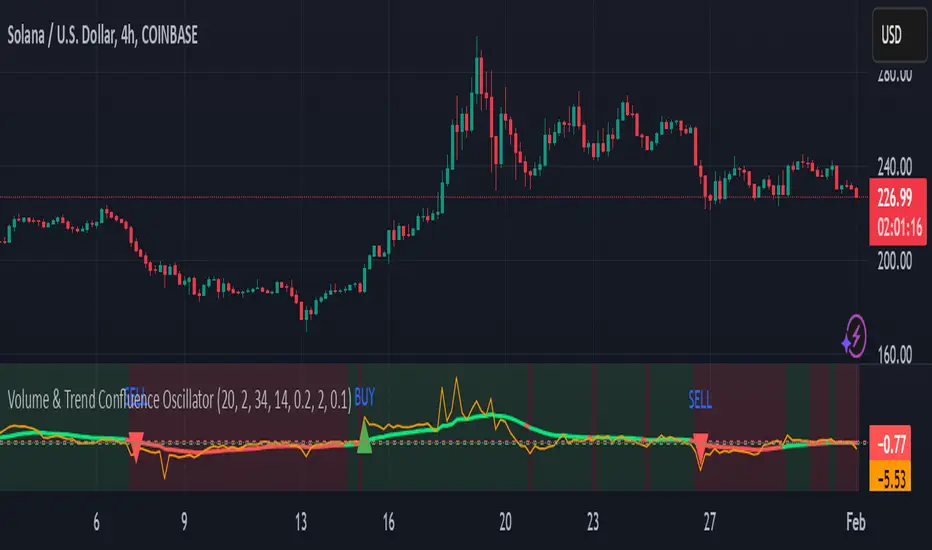
Volume & Trend Confluence OscillatorVolume & Trend Confluence Oscillator (VTCO)
Overview:
The Volume & Trend Confluence Oscillator (VTCO) is a technical analysis tool designed to help traders assess market conditions by integrating volume analysis, momentum, and trend direction into a single oscillator. This indicator provides traders with additional confirmation when evaluating potential trade entries and exits.
Key Features:
Volume Analysis: Calculates a Z-score to detect unusual trading activity.
Momentum Measurement: Evaluates the rate of price change to gauge market velocity.
Trend Confirmation: Utilizes an Exponential Moving Average (EMA) to assess overall market direction.
Signal Filtering: Incorporates minimum movement thresholds and a confirmation period to reduce false signals.
Visual Enhancements: Background shading indicates trend direction, and buy/sell markers highlight key signals.
How It Works:
The VTCO applies a volume multiplier to momentum readings when volume activity significantly deviates from its historical norm. Additionally, it prioritizes momentum moves that align with the prevailing market trend. A smoothing mechanism refines the oscillator’s signal line, ensuring a more stable and actionable output. The indicator generates alerts when key conditions are met, assisting traders in identifying potential trend shifts.
Signal Generation:
Buy Signal: Triggered when the oscillator crosses above zero after an oversold condition, ideally within an uptrend.
Sell Signal: Triggered when the oscillator crosses below zero after an overbought condition, ideally within a downtrend.
Alerts: Configurable alerts notify traders when key market conditions are met.
Usage Considerations:
Works effectively across various timeframes but may provide more reliable signals on higher timeframes.
Best utilized in conjunction with additional technical indicators and risk management strategies.
No indicator guarantees future performance; proper analysis and trade management remain essential.
Disclaimer:
This indicator is provided for educational purposes only and should not be considered financial advice. Trading involves risk, and past performance is not indicative of future results. Always conduct independent analysis before making trading decisions.
Instantaneous Trendline with Cloud Instantaneous Trendline with Cloud
Introduction & History
The Instantaneous Trendline was introduced by John Ehlers, a well-known figure in the field of technical analysis, particularly for applying digital signal processing concepts to financial markets. Ehlers aimed to create an indicator that reacts to market price changes more quickly than traditional moving averages, yet remains smooth enough to avoid excessive noise. By incorporating concepts from digital filtering, he devised a formula that calculates a trendline with minimal lag—hence the term “instantaneous.”
Purpose
The primary purpose of the Instantaneous Trendline with Cloud is to provide traders and analysts with a responsive, smoothed line that closely follows market price movements. Additionally, this script enhances the visual cues by adding a cloud fill to highlight bullish and bearish zones:
Trend Identification
The ITL (Instantaneous Trendline) is plotted alongside the price. When price consistently stays above the ITL, it may signal an uptrend. Conversely, when price dips below the ITL, it can suggest a downtrend.
Signal Generation
Crossover points between the price and the ITL can serve as potential entry or exit signals. A bullish crossover (price moving above the ITL) often indicates the start of upward momentum, while a bearish crossover (price dropping below the ITL) may point to downward momentum.
Noise Reduction
By applying digital filtering concepts and smoothing through the alpha (smoothing coefficient), the ITL reduces noise while still responding relatively quickly to price changes. Traders can adjust alpha to make the trendline more reactive (higher alpha) or smoother (lower alpha).
Clarity via Cloud Fill
A color-coded cloud between the price and the ITL provides an at-a-glance view of market bias. The green cloud highlights potentially bullish phases, while the red cloud highlights potentially bearish phases.
Experiment with the alpha value (commonly between 0.2 and 0.3) to find a balance that suits your preference for responsiveness versus smoothness.
This indicator implements John Ehlers’ Instantaneous Trendline concept and plots a smoothed trendline (ITL) alongside the price. The trendline is controlled by a user-defined smoothing coefficient (alpha). A higher alpha makes the trendline respond more quickly to price changes, while a lower alpha produces a smoother line.
A color-filled cloud helps traders identify bullish and bearish conditions:
Green cloud if the price is above the ITL (bullish potential).
Red cloud if the price is below the ITL (bearish potential).
Key Benefits
Trend Visualization: Quickly see if the market is in an uptrend or downtrend based on the position of the price relative to the trendline.
Crossover Signals: Identify potential shifts in trend or momentum when the price crosses the ITL.
Customizable Sensitivity: Adjust the alpha parameter to make the ITL more or less reactive to price moves. Use this tool to better visualize short-term trend changes and potential entry/exit signals in conjunction with other technical analysis methods.

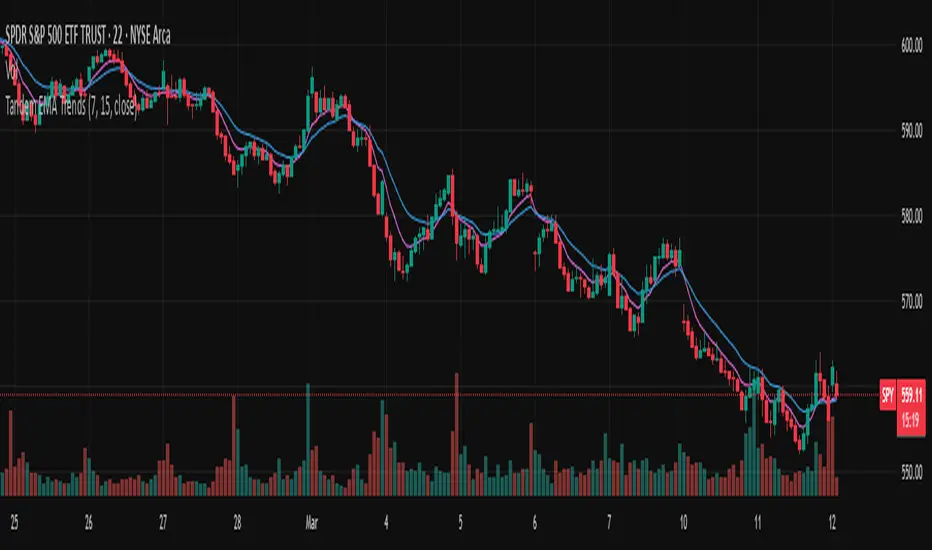
Tandem EMA TrendsThis indicator helps to identify trends using 2 (tandem) EMAs: a fast EMA and a slow EMA. Set the lengths of the EMAs in the inputs (fast EMA should be a smaller number than the slow EMA).
The trend is bullish if the current value of the fast EMA > current value of the slow EMA AND the current value of the fast EMA > the prior bar's value of the fast EMA.
The trend is bearish if the current value of the fast EMA < current value of the slow EMA AND the current value of the fast EMA < the prior bar's value of the fast EMA.
The fast EMA is countertrend to the slow EMA if either of the following 2 conditions exist:
The current value of the fast EMA > current value of the slow EMA AND the current value of the fast EMA < the prior bar's value of the fast EMA (bullish countertrend).
-OR-
The current value of the fast EMA < current value of the slow EMA AND the current value of the fast EMA > the prior bar's value of the fast EMA (bearish countertrend).
Use this script to set custom alerts based off of the current trend like sending webhooks when specific conditions exist.
Customize the colors of the plots.
Detecting Sideways Market or Strong Trends| Copy Trade Tungdubai**Tool Description**:
The **"Detecting Sideways Market or Strong Trends | Copy Trade Tungdubai"** tool is designed to help traders identify two key market conditions:
1. **Sideways Market**:
- This condition is detected when the ADX is below 20, the price stays within the Bollinger Bands, and the RSI is between 45 and 55.
- When the market is sideways, the chart background will turn yellow as a visual alert.
2. **Strong Trend Market**:
- This condition is identified when the ADX is above 25, and either the price breaks out of the Bollinger Bands or the RSI surpasses the overbought (70) or oversold (30) levels.
- When the market is in a strong trend, the chart background will turn blue as a visual alert.
**Key Components of the Tool**:
- **ADX**: Measures the strength of the market trend, with key thresholds at 20 and 25.
- **Bollinger Bands**: Helps determine volatility and checks if the price is within or outside the bands.
- **RSI**: Measures momentum, helping identify overbought and oversold levels.
**Visual Features on the Chart**:
- ADX, RSI, and Bollinger Bands are clearly plotted with their respective key thresholds for easier recognition of market conditions.
- The chart background changes color to reflect the current market condition (yellow for sideways, blue for strong trends).
**Alerts**:
- Alerts are triggered when the market enters either a sideways or strong trend phase, providing notifications to help users act promptly.
This tool serves as a practical aid in recognizing market conditions, allowing traders to make informed decisions aligned with their strategies.
**Mô tả công cụ**:
Công cụ **"Detecting Sideways Market or Strong Trends | Copy Trade Tungdubai"** được thiết kế để giúp các nhà giao dịch xác định hai trạng thái chính của thị trường:
1. **Thị trường đi ngang (Sideways)**:
- Điều kiện được xác định dựa trên chỉ số ADX thấp hơn ngưỡng 20, giá nằm trong dải Bollinger Bands, và chỉ số RSI dao động trong khoảng từ 45 đến 55.
- Khi thị trường đi ngang, nền của biểu đồ sẽ chuyển sang màu vàng để cảnh báo trực quan.
2. **Thị trường bùng nổ sóng mạnh (Strong Trend)**:
- Điều kiện được xác định khi ADX vượt qua ngưỡng 25 và giá phá vỡ dải Bollinger Bands (hoặc) chỉ số RSI vượt ngưỡng quá mua 70 hoặc quá bán 30.
- Khi thị trường bùng nổ sóng mạnh, nền biểu đồ sẽ chuyển sang màu xanh để cảnh báo trực quan.
**Các thành phần chính của công cụ**:
- **ADX**: Được sử dụng để đo sức mạnh xu hướng thị trường, với các ngưỡng quan trọng là 20 và 25.
- **Bollinger Bands**: Được sử dụng để xác định mức độ biến động và kiểm tra giá nằm trong hay ngoài dải.
- **RSI**: Dùng để đo mức độ quá mua/quá bán, xác định động lượng giá.
**Hiển thị trên biểu đồ**:
- Các đường ADX, RSI, và Bollinger Bands được vẽ rõ ràng, cùng với các ngưỡng quan trọng (hỗ trợ nhận biết trạng thái thị trường).
- Nền biểu đồ thay đổi màu sắc tương ứng với điều kiện thị trường.
**Cảnh báo**:
- Cảnh báo sẽ được kích hoạt khi thị trường rơi vào trạng thái đi ngang hoặc bùng nổ sóng mạnh, với các thông báo giúp người dùng hành động kịp thời.
Công cụ này là một trợ thủ hữu ích trong việc nhận biết trạng thái thị trường, từ đó giúp các nhà giao dịch đưa ra quyết định phù hợp với chiến lược của mình.
Custom Trend TableManual input of trend starting with Daily Time frame, then H4 and H1.
If Daily and H4 are the same trend we can ignore H1 trend (N/A).
M15 Buy or Sell comes automatically depending on what the higher time frame trends are.
If Daily and H4 are bearish, then we look for Selling opportunities on M15.
If Daily and H4 are bullish, then we look for Buying opportunities on M15.
If Daily and H4 are different trends, then H1 trend will determine M15 Buy or Sell.
Works for up to 4 pairs / Symbols. If you need more, just add the indicator twice and on the second settings, move the placement of the table to a different location (Eg: Top, Middle) so you can see up to 8 Symbols. Repeat this process if required.
