RAINBOW AVERAGES - INDICATOR - (AS) - 1/3
-INTRODUCTION:
This is the first of three scripts I intend to publish using rainbow indicators. This script serves as a groundwork for the other two. It is a RAINBOW MOVING AVERAGES indicator primarily designed for trend detection. The upcoming script will also be an indicator but with overlay=false (below the chart, not on it) and will utilize RAINBOW BANDS and RAINBOW OSCILLATOR. The third script will be a strategy combining all of them.
RAINBOW moving averages can be used in various ways, but this script is mainly intended for trend analysis. It is meant to be used with overlay=true, but if the user wishes, it can be viewed below the chart. To achieve this, you need to change the code from overlay=true to false and turn off the first switch that plots the rainbow on the chart (or simply move the indicator to a new pane below). By doing this, you will be able to see how all four conditions used to detect trends work on the chart. But let's not get ahead of ourselves.
-WHAT IS IT:
In its simplest form, this indicator uses 10 moving averages colored like a rainbow. The calculation is as follows:
MA0: This is the main moving average and can be defined with the type (SMA, EMA, RMA, WMA, SINE), length, and price source. However, the second moving average (MA1) is calculated using MA0 as its source, MA2 uses MA1 as the data source, and so on, until the last one, MA9. Hence, there are 10 moving averages. The first moving average is special as all the others derive from it. This indicator has many potential uses, such as entry/exit signals, volatility indication, and stop-loss placement, but for now, we will focus on trend detection.
-TREND DETECTION:
The indicator offers four different background color options based on the user's preference:
0-NONE: No background color is applied as no trend detection tools is being used (boring)
1-CHANGE: The background color is determined by summing the changes of all 10 moving averages (from two bars). If the sum is positive and not falling, the background color is GREEN. If the sum is negative and not rising, the background color is RED. From early testing, it works well for the beginning of a movement but not so much for a lasting trend.
2-RAINBW: The background color is green when all the moving averages are in ascending order, indicating a bullish trend. It is red when all the moving averages are in descending order, indicating a bearish trend. For example, if MA1>MA2>MA3>MA4..., the background color is green. If MA1 threshold, and red indicates width < -threshold.
4-DIRECT: The background color is determined by counting the number of moving averages that are either above or below the input source. If the specified number of moving averages is above the source, the background color is green. If the specified number of moving averages is below the source, the background color is red. If all ten MAs are below the price source, the indicator will show 10, and if all ten MAs are above, it will show -10. The specific value will be set later in the settings (same for 3-TSHOLD variant). This method works well for lasting trends.
Note: If the indicator is turned into a below-chart version, all four color options can be seen as separate indicators.
-PARAMETERS - SETTINGS:
The first line is an on/off switch to plot the skittles indicator (and some info in the tooltip). The second line has already been discussed, which is the background color and the selection of the source (only used for MA0!).
The line "MA1: TYP/LEN" is where we define the parameters of MA0 (important). We choose from the types of moving averages (SMA, EMA, RMA, WMA, SINE) and set the length.
Important Note: It says MA1, but it should be MA0!.
The next line defines whether we want to smooth MA1 (which is actually MA0) and the period for smoothing. When smoothing is turned on, MA0 will be smoothed using a 3-pole super smoother. It's worth noting that although this only applies to MA0, as the other MAs are derived from it, they will also be smoothed.
In the line below, we define the type and length of MAs for MA2 (and other MAs except MA0). The same type and length are used for MA1 to MA9. It's important to remember that these values should be smaller. For example, if we set 55, it means that MA1 is the average of 55 periods of MA0, MA2 will be 55 periods of MA1, and so on. I encourage trying different combinations of MA types as it can be easily adjusted for ur type of trading. RMA looks quirky.
Moving on to the last line, we define some inputs for the background color:
TSH: The threshold value when using 3-TSHOLD-BGC. It's a good idea to change the chart to a pane below for easier adjustment. The default values are based on EURUSD-5M.
BG_DIR: The value that must be crossed or equal to the MA score if using 4-DIRECT-BGC. There are 10 MAs, so the maximum value is also 10. For example, if you set it to 9, it means that at least 9 MAs must be below/above the price for the script to detect a trend. Higher values are recommended as most of the time, this indicator oscillates either around the maximum or minimum value.
-SUMMARY OF SETTINGS:
L1 - PLOT MAs and general info tooltip
L2 - Select the source for MA0 and type of trend detection.
L3 - Set the type and length of MA0 (important).
L4 - Turn smoothing on/off for MA0 and set the period for super smoothing.
L5 - Set the type and length for the rest of the MAs.
L6 - Set values if using 4-DIRECT or 3-TSHOLD for the trend detection.
-OTHERS:
To see trend indicators, you need to turn off the plotting of MAs (first line), and then choose the variant you want for the background color. This will plot it on the chart below.
Keep in mind that M1 int settings stands for MA0 and MA2 for all of the 9 MAs left.
Yes, it may seem more complicated than it actually is. In a nutshell, these are 10 MAs, and each one after MA0 uses the previous one as its source. Plus few conditions for range detection. rest is mainly plots and colors.
There are tooltips to help you with the parameters.
I hope this will be useful to someone. If you have any ideas, feedback, or spot errors in the code, LET ME KNOW.
Stay tuned for the remaining two scripts using skittles indicators and check out my other scripts.
-ALSO:
I'm always looking for ideas for interesting indicators and strategies that I could code, so if you don't know Pinescript, just message me, and I would be glad to write your own indicator/strategy for free, obviously.
-----May the force of the market be with you, and until we meet again,
스크립트에서 "the script"에 대해 찾기

MTFT VWAPs Auto AnchoredMulti Time Frame Tools
Multi Time Frame Tools (MTFT) is a suite of scripts aimed to establish a standard timeframe-based color scheme. This can be utilized to overlay different timeframes calculations/values over a single timeframe. As one example, this would allow to observe the 5-month moving average, 5-week moving average, and 5-day moving average overlaid over each other. This would allow to study a chart, get accustomed to the color scheme and study all these at the same time much easier.
All indicators calculated using the below specific timeframes as input, will always use the color scheme outlined below. This is to get you in habit of recognizing the different timeframes overlaid in top of each other. These can be personalized.
Longer TF analysis.
Yearly - Black
Semi-Annual - Yellow
Quarterly - White
Monthly - Maroon
Weekly - Royal Blue
Daily - Lime
Shorter TF analysis.
4 hour - Fuchsia
1 hour - Orange
30 min - Red
15 min - Brown
10 min - Purple
5 min - Lilac
All color coordination is able to be modified in either the “Inputs” or “Style” section. If you need to make changes, make sure to select “Save as Default” on the bottom right of the settings menu.
Recommended Chart Color Layout
I played around with color coordination a lot. The final product was what worked best for me. I personally use the following chart settings to accent all available TF colors.
-> Click on the settings wheel on your chart. -> Click on “Appearance”.
Background - Solid -> On the top row pick the 6th color from the left.
Vert Grid Lines and Horz Grid Lines -> On the top row pick the 7th color from the left.
You may of course change these and the indicator line colors as you like.
Adding indicator to Chart
-> Open the TradingView “Indicators & Strategies” library, the icon has “ƒx”. -> All premium scripts will be located under “Invite-Only Scripts” -> Click indicator to add to your chart.
MTFT VWAPs Auto Anchored
The Anchored Volume-Weighted Average Price, Anchored VWAP, is a commonly discussed FinTwit tool. I personally found it through Brian Shannon on Twitter. I have seen big FinTwit accounts solely focus on this strategy alone and have seen other big FinTwit accounts mix with their other indicators. I will be providing very basic info to utilize this script; it is up to you to dive deep into learning this strategy. I am not an expert with the tool or a financial advisor. As with all aspects of life, I recommend you research, learn, discern and practice extensively in order to become a master.
The script has the following features.
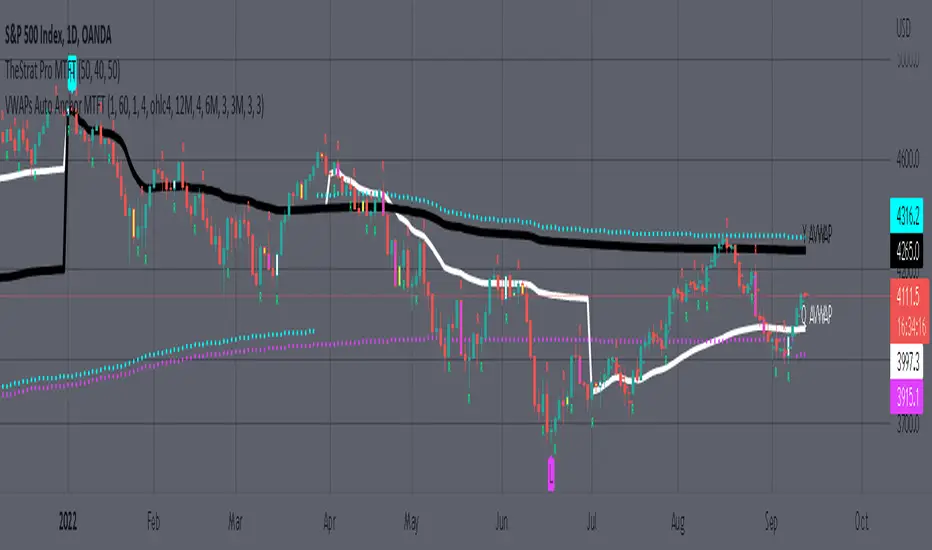
1. Three user selected time frames auto anchored VWAPS. It will auto anchor to the start of the timeframe. Timeframes(TF) include: Yearly(Y), Semi-annually(S), Quarterly(Q), Monthly(M), Weekly(W), Daily(D), and 4 hour. Image below shows the D candlestick as the active timeframe, the anchored VWAPs for the Year, Quarter, and Month.
2. Auto hide lower timeframe calculations. Auto Hide feature will hide smaller TF calculations when a larger timeframe is selected as the display TF. Example, when the Daily timeframe candlestick selected the Weekly and Daily Anchored VWAPs are hidden because they produce very noisy results. If a lower TF is selected such as the 30 min candlestick, the previously hidden Daily and Weekly Open Anchored VWAPs are now displayed. Notice that this specific indicator calculates different with every different timeframe that is selected. The lower TF calculations are more accurate as they include additional information. Image below shows the 30 min timeframe selected with the Daily, Weekly, and Monthly Open Anchored VWAPs displayed.
3. Auto Anchor using Pivot High/Low locations. Script finds the pivot highs/lows with a user selected look back/forward period. Additionally, as new pivot highs/lows appear you can choose to keep up to 4 each previous pivot high/low anchored VWAPs displayed. Image below has a 40 look back/forward period selected, and 2 past AVWAPs enabled.
You may notice in the above image that there is a gap between the AVWAP plot and the marked pivot point. This is not something that can be avoided as the script has to look forward in order to verify the pivot. The calculation is still correct, this can be verified by manually adding an “Anchored VWAP” drawing and seeing the values align. Image below shows that they match. White lines are the manually added “Anchored VWAP” drawings. If you verify this for yourself, make sure to select the correct input source in the settings of the drawing.
4. Auto Anchored on IPO High/Low. Looks for the first available candlestick in a chart and anchors to the high and low. This is useful with newer companies with recent IPOs.
IMPORTANT NOTE to TradingView admin: One of the lessons I would consider most important in attaining clarity regarding trading, is “TheStrat” by Rob Smith. His lesson on “actionable signals” is something that can be applied to any strategy. For this reason, I am including “MTFT TheStrat Patterns Pro” script in all images that will depict confluence for a better trade selection.
Example using TheStrat Pro MTFT with this indicator.
Look for a “TheStrat actionable signal” or a “TheStrat Reversal signal” on a smaller timeframe that has an instance of this indicator on a larger timeframe calculation that is in range of the candlestick that formed your actionable signal. This means that the indicators plot you are observing must be above the low and below the high of the candlestick that is the actionable signal/reversal signal.
The Image below shows what this would look like with this indicator. The selected candlestick is the 2-day, it shows a 1-3-1 pattern and the Quarter Anchored VWAP in range. This actionable signal could be played in both directions. If the high is breached, you would enter a long position from the high of the inside candlestick. If the low is breached than you would enter a short. For targets you would look at the previous pivots, for this example all targets were hit. Note that the “Entry” and “Targets” line were added manually and are not part of the script. Setups won’t always play out so nice and clean, but given that there is so many stocks and so many signals this is just a thought to improve the quality of the signal as it has extra confluence. If you are interested in learning further, research ‘TheStrat’ by Rob Smith.
MTFT EMA CloudsMulti Time Frame Tools
Multi Time Frame Tools (MTFT) is a suite of scripts aimed to establish a standard timeframe-based color scheme. This can be utilized to overlay different timeframes calculations/values over a single timeframe. As one example, this would allow to observe the 5-month moving average, 5-week moving average, and 5-day moving average overlaid over each other. This would allow to study a chart, get accustomed to the color scheme and study all these at the same time much easier.
All indicators calculated using the below specific timeframes as input, will always use the color scheme outlined below. This is to get you in habit of recognizing the different timeframes overlaid in top of each other. These can be personalized.
Longer TF analysis.
Yearly - Black
Semi-Annual - Yellow
Quarterly - White
Monthly - Maroon
Weekly - Royal Blue
Daily - Lime
Shorter TF analysis.
4 hour - Fuchsia
1 hour - Orange
30 min - Red
15 min - Brown
10 min - Purple
5 min - Lilac
All color coordination is able to be modified in either the “Inputs” or “Style” section. If you need to make changes, make sure to select “Save as Default” on the bottom right of the settings menu.
Recommended Chart Color Layout
I played around with color coordination a lot. The final product was what worked best for me. I personally use the following chart settings to accent all available TF colors.
-> Click on the settings wheel on your chart. -> Click on “Appearance”.
Background - Solid -> On the top row pick the 6th color from the left.
Vert Grid Lines and Horz Grid Lines -> On the top row pick the 7th color from the left.
You may of course change these and the indicator line colors as you like.
Adding indicator to Chart
-> Open the TradingView “Indicators & Strategies” library, the icon has “ƒx”. -> All premium scripts will be located under “Invite-Only Scripts” -> Click indicator to add to your chart.
*** MTFT EMA Clouds ***
The Exponential Moving Average Clouds, EMA Clouds, is a commonly discussed FinTwit tool. I personally found it through Ripster47 and PatternProfits on Twitter. I have seen big FinTwit accounts solely focus on this strategy alone and have seen other big FinTwit accounts mix with their other indicators. I will be providing very basic info to utilize this script; it is up to you to dive deep into learning this strategy. I am not an expert with the tool or a financial advisor. As with all aspects of life, I recommend you research, learn, discern and practice extensively in order to become a master.
The script has the following features.
1. Two user selected timeframes(TF) per script instance. Timeframes include: Quarter, Month, Weekly, Daily, 4 hour, 1 hour, 30 min, 15 min, 10 min, and 5 min candlestick data.
2. Five Unique Clouds per selected timeframe can each be individually enabled/disabled. Cloud pairs include: 5&13, 8&9, 34&50, 72&89, and 180&200.
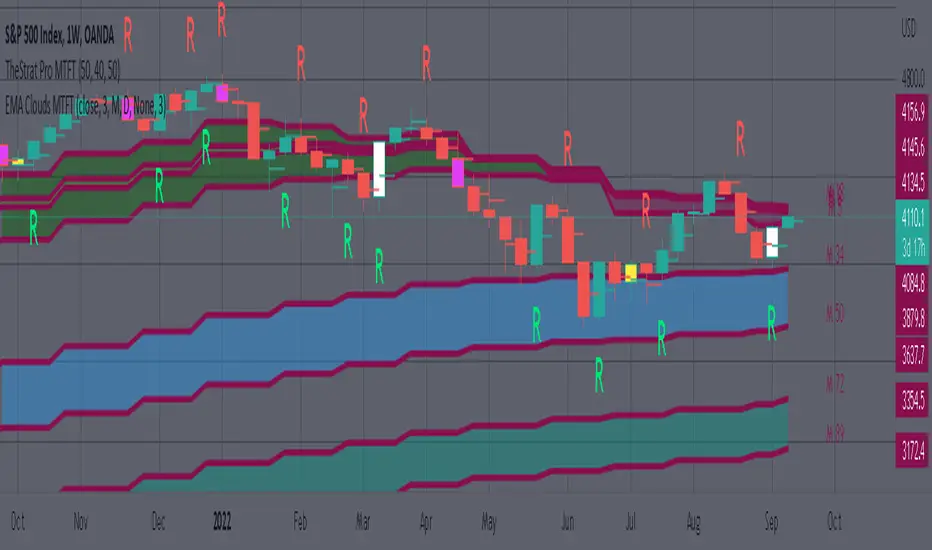
Below are some examples of how switching between multiple TF’s could assist you in identifying patterns and resistance/support easier. Below are 4 different timeframe EMA Clouds plotted over similar areas. What supports/resistances do you see?
Weekly timeframe selected with Quarterly Clouds
Weekly timeframe selected with Monthly Clouds
Daily timeframe selected with Weekly Clouds
1-hour timeframe selected with Daily Clouds.
This is meant to show you that the EMA Clouds often serve as resistance/support on multiple timeframes.
3. Force a specific cloud on both selected timeframes. Maybe you want to see how one cloud on several TFs looks over the same chart. Here I added two instances of the script in order to show 4 different TF clouds (Q, M, W, and D). Then I selected the “8_9” on “Force single cloud” for each instance, which will force only the selected cloud to be forced on all the selected time frames.
IMPORTANT NOTE: One of the lessons I would consider most important in attaining clarity regarding trading, is “TheStrat” by Rob Smith. His lesson on “actionable signals” is something that can be applied to any strategy. For this reason, I am including “MTFT TheStrat Patterns Pro” script in all images that will depict confluence for a better trade selection.
Example using TheStrat Pro MTFT with this indicator.
Look for a “TheStrat actionable signal” or a “TheStrat Reversal signal” on a smaller timeframe that has an instance of this indicator on a larger timeframe calculation that is in range of the candlestick that formed your actionable signal. This means that the indicators plot you are observing must be above the low and below the high of the candlestick that is the actionable signal/reversal signal. Image below shows what this would look like with this indicator.
The Image below shows what this would look like with this indicator. The selected candlestick is the Weekly, it shows a hammer actionable signal and the Monthly 34 EMA in range. This actionable signal is meant to be played in a long position. If the high is breached, you would enter a long position from the high of the hammer candlestick. For targets you would look at the previous pivots, for this example all targets were hit. Note that the “Entry” and “Targets” line were added manually and are not part of the script. Setups won’t always play out so nice and clean, but given that there is so many stocks and so many signals this is just a thought to improve the quality of the signal as it has extra confluence. If you are interested in learning further, research ‘TheStrat’ by Rob Smith.
PriceCatch Euronext Paris Stocks Screener v1Hi,
Tradingview community. Warm Greetings.
Euronext Paris Stocks Screener
I am sharing a script that screens Euronext Paris stocks for Probable Breakout Buy signal and Stop-Reverse Buy Signal. This script may prove to be useful to traders who trade Euronext Paris listed stocks.
I have already shared the script "PriceCatch Signals Buy Signals" that marks the following levels on the chart.
Probable Breakout Buy Level
Stop-Reverse Buy Level
While the script "PriceCatch Signals Buy Signals" can be used independently, this script is intended to be used with the script "PriceCatch Signals Buy Signals".
Used together, these two scripts may help you identify probable buy opportunities. The purpose of this script is to help screen stocks quickly without manually going through every stock in your watchlist.
Please read the Notes of the script "PriceCatch Signals Buy Signals" for explanation of its functionality.
Stocks Set
As Tradingview limits the number of security function calls, to get around, you have to select Set1 to screen first set of 25 stocks and then select Set2 to screen next set of 25 stocks.
List of Euronext Paris stocks
ACA AI AIR ALCRB ALGAU ALO ALONC ALVTX ATO BN BNP CA CLA COFA CS DBG DG EDF
EL ELIOR EN ENGI ETL FDJ FR FTI GET GLE MCPHY OR ORA POXEL PUB RI
RNO RXL SAF SAN SGO SMCP STLA STM SU TE TTE VIE VIV VK VLA WLN
Chart resolution vs. Script resolution
I have noticed that if the chart resolution is set to 15 minutes time-frame and the screener resolution is selected as 2 Hours, then the results are correct. However, if the screener resolution is set to 5 minutes, then the results are not accurate. This is not an issue with script. So scanning higher time-frames from a lower time-frame chart works better. My advice however, is better to set the chart resolution to the same interval as screener resolution for sure results.
As usual with price action, longer time-frames produce more reliable signals.
SOME CHARTS
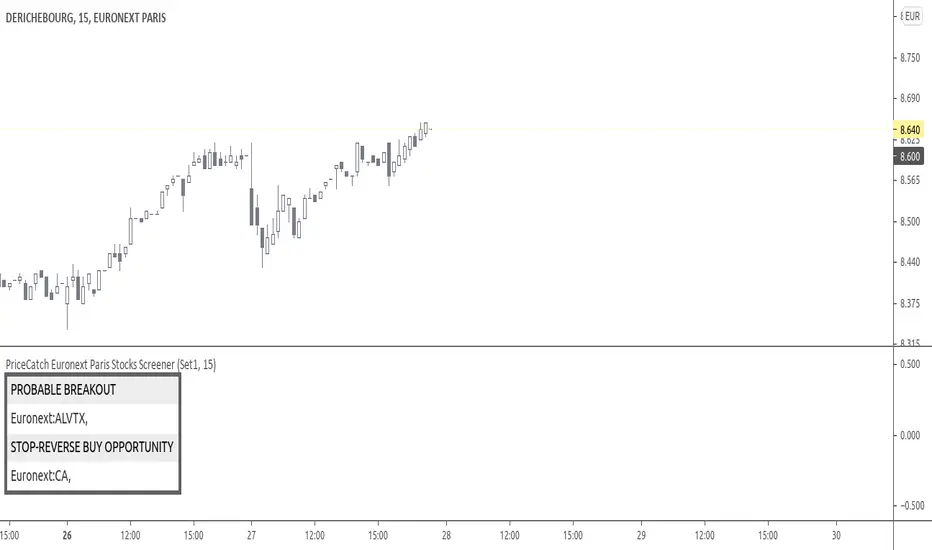
Chart set to Daily time-frame and shows Derichebourg stock. Screener shows a Stop-Reverse Buy Opportunity on GET.
s3.tradingview.com
Example 2
Chart set to 30 min. timeframe and shows Derichebourg stock. Screener shows a Stop-Reverse Buy Opportunity on VIV .
s3.tradingview.com
NOTE - PRIOR TO USING THIS SCRIPT
Please remember that the script is shared with absolutely no assurances about usability and any warranties whatsoever and as a responsible trader, please satisfy yourselves thoroughly and use it only if you are satisfied it works for you. Remember, you are 100% responsible for your actions. If you understand and accept that, you may use the script.
QUERIES/FEEDBACK
Please PM me.
Regards to all and wish everyone all the best with trading.
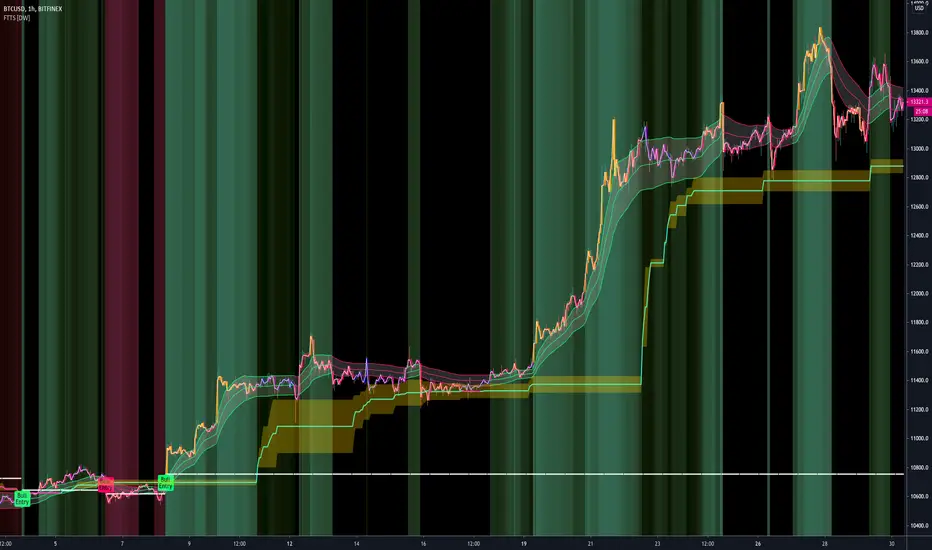
Fractal Trend Trading System [DW]This is an advanced utility that uses fractal dimension and trend information to generate useful insights about price activity and potential trade signals.
In this script, my Advanced FDI algorithm is used to estimate the fractal dimension of the dataset over a user defined period.
Fractal dimension, unlike spatial or topological dimension, measures how complexity or detail in an "object" changes as its unit of measurement changes, rather than the number of axes it occupies.
Many forms of time series data (seismic data, ECG data, financial data, etc.) have been theoretically shown to have limited fractal properties.
Consequently, we can estimate the fractal dimension from this data to get an approximate measure of how rough or convoluted the data stream is.
Financial data's fractal dimension is limited to between 1 and 2, so it can also be used to roughly approximate the Hurst Exponent by the relationship H = 2 - D.
When D=1.5, data statistically behaves like a random walk. D above 1.5 can be considered more rough or "mean reverting" due to the increase in complexity of the series.
D below 1.5 can be considered more prone to trending due to the decrease in complexity of the series.
In this script, you are given the option to apply my Band Shelf EQ algorithm to the dataset before estimating dimension.
This enables you to transform your data and observe how its newly measured complexity changes the outputs.
Whether you want to give emphasis to some frequencies, isolate specific bands, or completely alter the shape of your waveform, EQ filtration makes for an interesting experience.
The default EQ preset in this script removes the low shelf, then attenuates low end and high end oscillations.
The dominant cyclical components (bands 3 - 5 on default settings) are passed at 100%, keeping emphasis on 8 to 64 sample per cycle oscillations.
The estimated dimension is then used to calculate the High Dimension Zone and the Error Bands.
Both of these components are great for analyzing trends and for estimating support and resistance values.
The High Dimension Zone is composed of a high line, low line, and midline that update their values when D is at or above the user defined zone activation threshold.
The zone is then averaged over a user defined amount of updates and zone width is multiplied by a user defined value.
The Error Bands are composed of a high, low, and middle band that are calculated using an error adjusted adaptive filter algorithm that utilizes dimension as the smoothing constant modulator.
The basis filter for the error bands has two calculation types built in:
-> MA - Calculates the filters as adaptive moving averages modulated by D.
-> WAP - Calculates the filters as adaptive weighted average prices modulated by D.
The WAP starting point can be based on the High Dimension Zone being moved or a user defined interval.
You can also define the WAP's minimum and maximum periods for additional control of the initial and decayed sensitivity states.
The alpha (smoothing constant) modulator can be fine tuned using the designated dimension thresholds.
When D is at or below the low dimension threshold, the filter is most responsive, and vice-versa for the high dimension threshold.
Alpha is then multiplied by a user defined amount for additional control of sensitivity.
Band width is then multiplied by a user defined value.
A Hull transformation can be optionally performed on the zone averaging and band filter algorithms as well, which will alter the frequency and phase responses at the cost of some overshoot.
This transformation is the same as a typical Hull equation, but with custom filters being used instead of WMA.
The calculated outputs are then used to gauge the trend for signal and color scheme calculations.
First, a dominant trend indication is selected from its designated dropdown tab.
The available built in indications to choose from are:
-> Band Trend (Outer) - Detects band breakouts and saves their direction to gauge trend.
-> Band Trend (Median) - Uses disparity between source and the band median to gauge trend.
-> Zone Trend (Expansion) - Detects when the high fractal zone expands and saves its direction to gauge trend.
-> Zone Trend (Outer Levels) - Detects zone breakouts and saves their direction to gauge trend.
-> Zone Trend (Median) - Uses disparity between source and the zone median to gauge trend.
Then the trend output is optionally filtered before triggering signals.
There are multiple trend filtration options built into this script that can be used individually or in unison:
-> Filter Trend With High Fractal Zone - Filters the trend using the specified zone level or combination of levels with either disparity or crossover conditions.
There is a set of options for bullish and bearish trends.
-> Filter Trend With Error Bands - Filters the trend using the specified band level or combination of levels with either disparity or crossover conditions.
There is a set of options for bullish and bearish trends.
-> Filter Trend With Band - Zone Disparity Condition - Filters the trend using the specified band level, zone level, and disparity direction.
There is a set of options for bullish and bearish trends.
-> Filter By Zone That Moves With The Trend - Filters the specified trend by detecting when the high fractal zone’s direction correlates.
-> Filter By Bands That Move With The Trend - Filters the specified trend by detecting when the error bands’ direction correlates.
-> Filter Using Wave Confirmation - Filters the specified trend by detecting when source is in a correlating wave with user defined length.
You can also choose separate lengths for bullish and bearish trends.
-> Filter By Bars With Decreasing Dimension - Filters the specified trend by detecting when fractal dimension is decreasing, suggesting source is approaching more linear movement.
The filtered trend output is then used to generate entry and exit signals.
There are multiple options included to fine tune how these signals behave.
For entries, you have the following options built in:
-> Limit Entry Dimension - Limits the range of dimensional values that are acceptable for entry with user defined thresholds.
This can be incredibly useful for filtering out entries taken when price is moving in a more complex pattern,
or when price is approaching a peak and you’re a little late to the party.
-> Enable Position Increase Signals - Enables more entry signals to fire up to a user defined number of times when a position is active.
This is helpful for those who incrementally increase their positions, or for those who want to see additional signals as reference.
-> Limit Number Of Consecutive Trades - Limits the number of consecutive trades that can be opened in a single direction to a user defined maximum.
This is especially useful for markets that only trend for brief durations.
By limiting the amount of trades you take in one direction, you have more control over your market exposure.
There is a set of these options for both bullish and bearish entries.
For exits, you have the following options built in:
-> Include Exit Signals From High Fractal Zone - Enables exit signals generated from either crossover or disparity conditions between price and a specified zone level.
-> Include Exit Signals From Error Bands - Enables exit signals generated from either crossover or disparity conditions between price and a specified zone level.
-> Include Inactive Trend Output For Exits - Triggers exit signals when the filtered trend output is an inactive value.
-> Dimension Target Exit Method - Triggers exit signals based on fractal dimension hitting a user defined threshold.
You can either choose for the exit to trigger instantly, or after dimension reverts from the target by a user specified amount.
-> Exit At Maximum Entry Dimension - Triggers exit signals when dimension exceeds the maximum entry limit.
-> Number Of Signals Required For 100% Exit - Controls the number of exit signals required to close the position.
You can also choose whether or not to include partial exits.
Enabling them will fire a partial signal when an exit occurs, but the position is not 100% closed.
Of course, there is a set of these options for bullish and bearish exits.
In my opinion, no system is complete without some sort of risk management protocol in place.
So in this script, bullish and bearish trades come equipped with optional protective SL and TP levels with signals.
The levels can be fixed or trailing, and are calculated with a user defined scale.
The available scales for SL and TP distances are ticks, pips, points, % of price, ATR, band range, zone range, or absolute numerical value.
Now what if you have some awesome signals of your own that you’d like to use in conjunction with this script?
Well good news. You can!
In addition to all of the customizable features built into the script, you can integrate your own signals into the system using the external data inputs and linking your script.
This adds a whole new layer of customization to the system.
With external signals, you can use your own custom dominant trend indication, filter the dominant trend, and trigger exits and protective stops using custom signals.
The signal input is an integer format. 1=Bull Signal, -1=Bear Signal, 2=Bull Exit, -2=Bear Exit, 3=Bull SL Hit, -3=Bear SL Hit, 4=Bull TP Hit, -4=Bear TP Hit.
You can also use the external input as a custom source value for either dimension or global sources to further tailor the system to your liking.
The color scheme in this script utilizes two custom gradients that can be chosen for bar and background colors:
-> Trend (Dominant or Filtered) - A polarized gradient that shows green scaled values for bullish trend and red scaled values for bearish trend.
The colors are brighter and more vibrant as perceived trend strength increases.
-> Dimension - A thermal gradient that shows cooler colors when dimension is higher, and hotter colors when dimension is lower.
Both color schemes are dependent on the designated dimension thresholds.
The script comes equipped with alerts for entries, additional entries, exits, partial exits, and protective stops so you can automate more and stare at your charts less.
And lastly, the script comes equipped with additional external outputs to further your analysis:
-> Entry And Exit Signals - Outputs in the same format as the external signal input with these additions: 5=Bull Increase, -5=Bear Increase, 6=Bull Reduce, -6=Bear Reduce.
You can use these to send to other scripts, including strategy types so you can backtest your performance on TV’s engine.
-> Dominant Trend - Outputs 1 for bullish and -1 for bearish. Can be used to send trend signals to another script.
I designed this tool with individuality in mind.
Every trader has a different situation. We trade on different schedules, markets, perspectives, etc.
Analytical systems of basically any type are very seldom (if ever) “one size fits all” and usually require a fair amount of modification to achieve desirable results.
That’s why this system is so freely customizable.
Your system should be flexible enough to be tailored to your analytical style, not the other way around.
When a system is limited in what you can control, it limits your experience, analytical potential, and possibly even profitability.
This is not your typical pre-set system. If you're looking for just another "buy, sell" script that requires minimal thought, look elsewhere.
If you’re ready to dive into a powerful technical system that allows you to tailor the experience to your style, welcome!
-----------------------------------------------------------------------------------------------------------------------------------------------------------------
This is a premium script, and access is granted on an invite-only basis.
To gain access, get a copy of the system overview, or for additional inquiries, send me a direct message.
I look forward to hearing from you!
-----------------------------------------------------------------------------------------------------------------------------------------------------------------
General Disclaimer:
Trading stocks, futures, Forex, options, ETFs, cryptocurrencies or any other financial instrument has large potential rewards, but also large potential risk.
You must be aware of the risks and be willing to accept them in order to invest in stocks, futures, Forex, options, ETFs or cryptocurrencies.
Don’t trade with money you can’t afford to lose.
This is neither a solicitation nor an offer to Buy/Sell stocks, futures, Forex, options, ETFs, cryptocurrencies or any other financial instrument.
No representation is being made that any account will or is likely to achieve profits or losses of any kind.
The past performance of any trading system or methodology is not necessarily indicative of future results.
TFi Pivot Reversal StudyThe Pivot Reversal Study script uses pivot points to create a support and resistance level; based on this levels the script creates virtual stop-market orders to catch the trend if the price is crossing the pivot lines.
A configurable trailing-stop and stop-loss is being used to exit an open position.
The entry and exit points are visualized in the chart via green arrows and crosses; the position follows the exact behavior of the strategy script.
The study also creates alerts, which follow the exact position of the entry/exit markers. Via the input parameter "Alert Message Type" it is possible to select a predefined alertcondition message; right now the script supports a generic default message and a trading setup for Alertatron.
How to use
The study works with all timeframes; the current chart setting is using a 15min timeframe. The strategy enters about 10 trades per day, depending on the used settings.
I'm also providing a "strategy" version of this study, which can be used to backtest the strategy.
How to access
This strategy is a "Invite Only" script. You can can subscribe or purchase the strategy ; please use the link below or send me a message via Tradingview to obtain access to the strategy and study script.
For enabling the script in your Tradingview chart window, click on "Indicators" and select "Invite-Only Scripts".
Full list of alerts:
'Enter Long' ... Enter long position
'Enter Short' ... Enter short position
'Exit Long PT' ... Exit long position - profit-target reached
'Exit Short PT' ... Exit short position - profit-target reached
'Exit Long SL' ... Exit long position - stop-loss
'Exit Short SL' ... Exit short position - stop-loss
Full list of parameters:
"Pivot Left Bars" ... Number of bars on the left of the pivot point - used for pivot/peak detection
"Pivot Right Bars" ... Number of bars on the right of the pivot point - used for pivot/peak detection
"Entry Offset " ... Entry price offset after crossing pivot line (in %)
"Trailing Activation Level " ... Trailing stop activation level above/below average price (in %)
"Trailing Offset " ... Trailing stop price (in %)
"Stop Loss " ... Absolute stop-loss (in %)
"Alert Message Type" ... Alert message type: generic or Alertatron
"Backtest ..." ... Backtest timeframe; area outside this timeframe will be grayed out
I'm looking forward to any feedback, reviews and change requests!

™TradeChartist Fib Extensions™TradeChartist Fib Extensions is a free to use script that helps traders plot Fibonacci Extensions on chart. Even though Trading View has a Fib extensions tool, some traders may prefer a plotting script like this with Fib plot lines extending across the whole of the chart to track historic prices in relation to Fib extensions drawn.
----To draw Fib extensions for uptrend ,
1. Choose a Pivot Low point (LL or a HL) as Pivot 1
2. Choose a Pivot High point (must be higher than Pivot 1) as Pivot 2
3. Choose a Pivot Low point (must be lower than Pivot 2, must be Higher than Pivot 1)
----To draw Fib extensions for downtrend,
1. Choose a Pivot High point (HH or a LH) as Pivot 1
2. Choose a Pivot Low point (must be lower than Pivot 1) as Pivot 2
3. Choose a Pivot High point (must be higher than Pivot 2 and lower than Pivot 1)
Negative extensions of -23.6% and -61.8% fib plots may be useful for some to spot reversals or to set stop losses.
Higher levels can be used if price goes beyond 161.8%
This is a free to use indicator. Give a thumbs up or leave a comment if you like the script
Check my 'Scripts' page to see other published scripts. Get in touch with me if you would like access to my invite-only scripts for a trial before deciding on a paid access for a period of your choice. Half-Yearly, Annual and Lifetime access available on invite-only scripts along with 1hr Team Viewer intro session.

CryptoSnaxAllinOne > 5 Scripts in 1 > Saving Time and Efficiency5 Scripts in 1 > Saving Time and Efficiency in My Daily Life
Tired of doing those repetivie tasks with Trading View?
- Spending Hours finding Support or Resistance?, Looking for Entry or Exit Signals? Looking for Pivot High/Low?
- Only to do it all again, when changing timeframes or asset!
- Fear Not > My All in One script should help.
Please find an overview of the All in One Script I have been building.
- This is purely for educational purposes.
- This script is not financial advice.
- I hold no responsibility for anyone using this script.
- I do not guarantee lifetime support for this script (if TV update version from 3 to 4, code will need to be updated)
- If you would like to use the script, please message me on TradingView.
- Script One > Give overall direction of trend with
- Script Two > Much Easier to see the Highs and the Lows of the Candles. Easier to Spot Resistance & Support. [Highest High / Lowest Low of Candle/Wick > 20Bars Eitherside)
- Script Three > 1st Confirmation of Pivot High and Low Plot > My 1st Confirmation of High or Low. [Pivot High/Low 20Bars Eitherside > 1st Confirm)
- Script Four > 2nd Confirmation of Pivot High and Low Plot > Entry and Exit > My 2nd Confirmation of High or Low. [Pivot High/Low 10Bars Eitherside > 2nd Confirm)
- Script Five > Plot in the Main Chart Red IF OverBought / Green if OverSold
NOTE > White Support Lines were Manually Drawn. I Drew them from the Script Data. I.e. Looking for Strong Support / Resistance Zones + Possible Fib = Manually Draw and Much Quicker to Make Qualified Decisions on the Probability.

Volume essential parameters overlayVolume EPO – Essential Volume Parameters Overlay
1. Motivation and design philosophy
Volume EPO is designed as a conceptual overlay rather than a self contained trading system. The main idea behind this script is to take complex, foundational market concepts out of heavy, menu driven strategies and express them as lightweight, independent layers that sit on top of any chart or indicator.
In many TradingView scripts, a single strategy tries to handle everything at once: signal logic, risk settings, visual cues, multi timeframe controls, and conceptual explanations. This usually leads to long input menus, performance issues, and difficult maintenance. The architectural approach behind Volume EPO is the opposite: keep the core strategy lean, and move the explanation and measurement of key concepts into dedicated overlays.
In this framework, Volume EPO is the base layer for the concept of volume. It does not decide anything about entries or exits. Instead, it exposes and clarifies how different definitions of volume behave candle by candle. Other layers or strategies can then build on top of this understanding.
2. What Volume EPO does
Volume EPO focuses on four essential volume parameters for each bar:
- Buy volume - Sell volume - Total volume - Delta volume (the difference between buy and sell volume)
The script presents these parameters in a compact heads up display (HUD) table that can be positioned anywhere on the chart. It is designed to be visually minimal, language aware, and usable on top of any other indicator or price action without cluttering the view.
The indicator does not output signals, alerts, arrows, or strategy entries. It is a descriptive and educational tool that shows how volume is distributed, not a prescriptive tool that tells the trader what to do.
3. Two definitions of volume
A central theme of this script is that there is more than one way to define and interpret “volume” inside a single candle. Volume EPO implements and clearly separates two different approaches:
- A geometric, candle based approximation that uses only OHLC and volume of the current bar. - An intrabar, data driven definition that uses lower timeframe up and down volume when it is available.
The user can switch between these modes via the calculation method input. The mode is prominently shown inside the on chart table so that the context is always explicit.
3.1 Geometry mode (Source File, approximate)
In Geometry mode, Volume EPO works only with the current bar’s OHLC values and total volume. No lower timeframe data is required.
The candle’s range is defined as high minus low. If the range is positive, the position of the close inside that range is used as a simple model for how volume might have been distributed between buyers and sellers:
- The closer the close is to the high, the more of the total volume is attributed to the buying side. - The closer the close is to the low, the more of the total volume is attributed to the selling side. - In a rare case where the bar has no price range (for example a flat or doji bar), total volume is split evenly between buy and sell volume.
From this model, the script derives:
- Buy volume (approximated) - Sell volume (approximated) - Total volume (as reported by the bar) - Delta volume as the difference between buy and sell volume
This approach is intentionally labeled as “Geometry (Approx)” in the HUD. It is a theoretical reconstruction based solely on the candle’s geometry and total volume, and it is always available on any market or timeframe that provides OHLCV data.
3.2 Intrabar mode (Precise)
In Intrabar mode, Volume EPO uses the TradingView built in library for up and down volume on a user selected lower timeframe. Instead of inferring volume from the shape of the candle, it reads the underlying lower timeframe data when that data is accessible.
The script requests up and down volume from a lower timeframe such as 15 seconds, using the official TA library functions. The results are then interpreted as follows:
- Buy volume is taken as the absolute value of the up volume. - Sell volume is taken as the absolute value of the down volume. - Total volume is the sum of buy and sell volume. - Delta volume is provided directly by the library as the difference between up and down volume.
If valid lower timeframe data exists for a bar, the bar is counted as covered by Intrabar data. If not, that bar is marked as invalid for this precise calculation and is excluded from the covered count.
This mode is labeled “Precise” in the HUD, together with the selected lower timeframe, because it is anchored in actual intrabar data rather than in a geometric model. It provides a closer view of how buying and selling pressure unfolded inside the bar, at the cost of requiring more data and being dependent on the availability of that data.
4. Coverage, lookback, and what the numbers mean
The top part of the HUD reports not only which volume definition is active, but also an additional line that describes the effective coverage of the data.
In Intrabar (Precise) mode, the script displays:
- “Scanned: N Bars”
Here, N counts how many bars since the indicator was loaded have successfully received valid lower timeframe delta data. It is a measure of how much of the visible history has been truly covered by intrabar information, not a lookback window in the sense of a rolling calculation.
In Geometry mode, the script displays:
- “Lookback: L Bars”
In this extracted layer, the lookback value L is purely descriptive. It does not change how the current bar’s volume is computed, and it is not used in any iterative or statistical calculation inside this script. It is meant as a conceptual label, for example to keep the volume layer consistent with a broader framework where lookback length is a structural parameter.
Summarizing these two fields:
- Scanned tells you how many bars have been processed using real intrabar data. - Lookback is a descriptive parameter in Geometry mode in this specific overlay, not a direct driver of the computations.
5. The HUD layout on the chart
The on chart table is intentionally compact and structured to be read quickly:
- Header: a title identifying the overlay as Volume EPO. - Mode line: explicitly states whether the script is in Precise or Geometry mode, and for Precise mode also shows the lower timeframe used. - Coverage line: - In Precise mode, it shows “Scanned: N Bars”. - In Geometry mode, it shows “Lookback: L Bars”. - Volume block: - A line for buy and sell volume, marked with clear directional symbols. - A line for total volume and the absolute delta, accompanied by the sign of the delta. - Numeric formatting uses human friendly suffixes (for example K, M, B) to keep the display readable. - Footer: the current symbol and a time stamp, adjusted by a user selectable timezone offset so that the HUD can be aligned with the trader’s local time reference.
The table can be positioned anywhere on the chart and resized via inputs, and it supports multiple color themes and languages in order to integrate cleanly into different chart layouts.
6. How to use Volume EPO in practice
Volume EPO is meant to be read together with price action and other tools, not in isolation. Typical uses include:
- Studying how often a strong directional candle is actually supported by dominant buy or sell volume. - Comparing the behavior of delta volume between Geometry and Intrabar definitions. - Building a personal intuition for how intrabar data refines or contradicts the simple candle based approximation. - Feeding these insights into separate, lean strategy scripts that do not need to carry the full explanatory logic of volume inside them.
Because it is an overlay layer, Volume EPO can be stacked with other custom indicators without adding new signals or complexity to their logic. It simply adds a clear and consistent view of volume behavior on top of whatever the trader is already watching.
7. Educational and non signalling nature
Finally, it is important to stress that Volume EPO is not a trading system, not a signal generator, and not financial advice. The script does not tell the user when to enter or exit. It only reports how different definitions of volume describe the current bar.
Deciding whether to trade, how to trade, and which risk parameters to use remains entirely with the user and with their own strategy. Volume EPO provides context and clarity around the concept of volume so that those decisions can be informed by a better understanding of how buying and selling pressure is structured inside each candle.
Note: Even on lower timeframes, every reconstruction of volume remains an approximation, except at the true single tick level. However, the closer the chosen lower timeframe is to a one tick stream, the more accurately it can reflect the underlying order flow and balance between buying and selling pressure.

Price Action Key Level Break & Retest — Instant ReversalThis script identifies high-confidence support and resistance levels using pivot points and multi-step retest confirmation. It helps traders detect reliable breakout and reversal zones using price action.
How It Works:
1. The script scans for pivot highs and lows on the chart to identify potential key levels.
2. Each level is monitored for multiple retests (configurable by the user). The more a level is tested and holds, the stronger it becomes.
3. When price interacts with a key level:
o A Support signal occurs if the level acts as support after multiple retests.
o A Resistance signal occurs if the level acts as resistance after multiple retests.
o If a signal fails (price breaks the level), an opposite signal is automatically placed at the breach point.
4. Optional volume filter validates the strength of moves, reducing false signals.
5. Horizontal Line Visualization: Support and Resistance signals are represented by drawing manually horizontal lines, which remain on the chart regardless of scrolling, zooming, or candle compression and helps traders to identify the breakout of key levels
Example:
• Suppose a stock forms a pivot low at ₹1,000.
• Price retraces and touches ₹1,000 two to three times, holding each time — the level is confirmed as strong support.
• The script places a buy line at ₹1,000.
• If price breaks below ₹1,000 after holding it for multiple retests, the script automatically generates a Resistance Signal at the breach point, signaling a potential trend reversal.
• That Resistance Signal act as Resistance level throughout. if such Resistance level breaks out above, it act as Support level and vice versa
• This allows traders to react adaptively, entering trades based on confirmed support or resistance while managing risk.
Why It’s Useful:
• Focuses on multi-retest confirmation rather than single touch points, reducing false signals.
• To draw horizontal lines on key levels, providing clear visualization of key levels without clutter.
• Integrates adaptive breach signals, so traders can respond when levels fail.
• Suitable for swing, intraday, and trend-following strategies.
How to Use:
1. Apply the script to any timeframe.
2. Configure pivot detection length and maximum retests to match trading style.
3. Enable the optional volume filter for stronger signal validation.
4. Monitor the horizontal lines for Support/Resistance signals and opposite signals at breaches.
5. Combine with other technical analysis if desired.
Concepts Behind the Script:
• Pivot-based support and resistance
• Multi-retest validation for stronger levels
• Adaptive opposite signals for failed levels
• Volume-based confirmation for reliability
• Horizontal line visualization for easy tracking
Key Features:
Horizontal Lines visualization: Support and Resistance levels remain on the chart permanently, providing constant visual reference.
Multi-Timeframe Compatible: Can be applied on any timeframe; lines and breach logic adjust automatically.
Optional Noise Filters: Volume and retest filters improve signal reliability.
Why It’s Worth Paying:
• Uses multi-retest confirmation to reduce false signals compared to standard support/resistance scripts.
• Provides adaptive opposite signals for failed levels — giving traders an actionable edge.
• Visualizes key levels as fixed horizontal lines, helping traders track trends clearly.
• Works across multiple timeframes — suitable for intraday, swing, or trend-following strategies.
How to Request Access:
This script is invite-only on TradingView. To get access:
1. DM me on TradingView with your username.
2. Access is granted individually to ensure proper use and avoid unauthorized sharing.
3. Once approved, you can apply the script to your charts immediately and benefit from high-confidence level detection.
Disclaimer:
Trading involves risk. Signals are based on historical price action and should be used alongside other technical analysis and risk management strategies.
Past performance does not guarantee future results. This is an analytical tool; it does not provide investment advice.

Multi-Timeframe Continuity Custom Candle ConfirmationMulti-Timeframe Continuity Custom Candle Confirmation
Overview
The Timeframe Continuity Indicator is a versatile tool designed to help traders identify alignment between their current chart’s candlestick direction and higher timeframes of their choice. By coloring bars on the current chart (e.g., 1-minute) based on the directional alignment with selected higher timeframes (e.g., 10-minute, daily), this indicator provides a visual cue for confirming trends across multiple timeframes—a concept known as Timeframe Continuity. This approach is particularly useful for day traders, swing traders, and scalpers looking to ensure their trades align with broader market trends, reducing the risk of trading against the prevailing momentum.
Originality and Usefulness
This indicator is an original creation, built from scratch to address a common challenge in trading: ensuring that price action on a lower timeframe aligns with the trend on higher timeframes. Unlike many trend-following indicators that rely on moving averages, oscillators, or other lagging metrics, this script directly compares the bullish or bearish direction of candlesticks across timeframes. It introduces the following unique features:
Customizable Timeframes: Users can select from a range of higher timeframes (5m, 10m, 15m, 30m, 1h, 2h, 4h, 1d, 1w, 1M) to check for alignment, making it adaptable to various trading styles.
Neutral Candle Handling: The script accounts for neutral candles (where close == open) on the current timeframe by allowing them to inherit the direction of the higher timeframe, ensuring continuity in trend visualization.
Table: A table displays the direction of each selected timeframe and the current timeframe, helping identify direction in the event you don't want to color bars.
Toggles for Flexibility: Options to disable bar coloring and the debug table allow users to customize the indicator’s visual output for cleaner charts or focused analysis.
This indicator is not a mashup of existing scripts but a purpose-built tool to visualize timeframe alignment directly through candlestick direction, offering traders a straightforward way to confirm trend consistency.
What It Does
The Timeframe Continuity Indicator colors bars on your chart when the direction of the current timeframe’s candlestick (bullish, bearish, or neutral) aligns with the direction of the selected higher timeframes:
Lime: The current bar (e.g., 1m) is bullish or neutral, and all selected higher timeframes (e.g., 10m) are bullish.
Pink: The current bar is bearish or neutral, and all selected higher timeframes are bearish.
Default Color: If the directions don’t align (e.g., 1m bar is bearish but 10m is bullish), the bar remains the default chart color.
The indicator also includes a debug table (toggleable) that shows the direction of each selected timeframe and the current timeframe, helping traders diagnose alignment issues.
How It Works
The script uses the following methodology:
1. Direction Calculation: For each timeframe (current and selected higher timeframes), the script determines the candlestick’s direction:
Bullish (1): close > open / Bearish (-1): close < open / Neutral (0): close == open
Higher timeframe directions are fetched using Pine Script’s request.security function, ensuring accurate data retrieval.
2. Alignment Check: The script checks if all selected higher timeframes are uniformly bullish (full_bullish) or bearish (full_bearish).
o A higher timeframe must have a clear direction (bullish or bearish) to trigger coloring. If any selected timeframe is neutral, alignment fails, and no coloring occurs.
3. Coloring Logic: The current bar is colored only if its direction aligns with the higher timeframes:
Lime if the higher timeframes are bullish and the current bar is bullish or neutral.
Maroon if the higher timeframes are bearish and the current bar is bearish or neutral.
If the current bar’s direction opposes the higher timeframe (e.g., 1m bearish, 10m bullish), the bar remains uncolored.
Users can disable bar coloring entirely via the settings, leaving bars in their default chart color.
4. Direction Table:
A table in the top-right corner (toggleable) displays the direction of each selected timeframe and the current timeframe, using color-coded labels (green for bullish, red for bearish, gray for neutral).
This feature helps traders understand why a bar is or isn’t colored, making the indicator accessible to users unfamiliar with Pine Script.
How to Use
1. Add the Indicator: Add the "Timeframe Continuity Indicator" to your chart in TradingView (e.g., a 1m chart of SPY).
2. Configure Settings:
Timeframe Selection: Check the boxes for the higher timeframes you want to compare against (default: 10m). Options include 5m, 10m, 15m, 30m, 1h, 2h, 4h, 1D, 1W, and 1M. Select multiple timeframes if you want to ensure alignment across all of them (e.g., 10m and 1d).
Enable Bar Coloring: Default: true (bars are colored lime or maroon when aligned). Set to false to disable coloring and keep the default chart colors.
Show Table: Default: true (table is displayed in the top-right corner). Set to false to hide the table for a cleaner chart.
3. Interpret the Output:
Colored Bars: Lime bars indicate the current bar (e.g., 1m) is bullish or neutral, and all selected higher timeframes are bullish. Maroon bars indicate the current bar is bearish or neutral, and all selected higher timeframes are bearish. Uncolored bars (default chart color) indicate a mismatch (e.g., 1m bar is bearish while 10m is bullish) or no coloring if disabled.
Direction Table: Check the table to see the direction of each selected timeframe and the current timeframe.
4. Example Use Case:
On a 1m chart of SPY, select the 10m timeframe.
If the 10m timeframe is bearish, 1m bars that are bearish or neutral will color maroon, confirming you’re trading with the higher timeframe’s trend.
If a 1m bar is bullish while the 10m is bearish, it remains uncolored, signaling a potential misalignment to avoid trading.
Underlying Concepts
The indicator is based on the concept of Timeframe Continuity, a strategy used by traders to ensure that price action on a lower timeframe aligns with the trend on higher timeframes. This reduces the risk of entering trades against the broader market direction. The script directly compares candlestick directions (bullish, bearish, or neutral) rather than relying on lagging indicators like moving averages or RSI, providing a real-time, price-action-based confirmation of trend alignment. The handling of neutral candles ensures that minor indecision on the lower timeframe doesn’t interrupt the visualization of the higher timeframe’s trend.
Why This Indicator?
Simplicity: Directly compares candlestick directions, avoiding complex calculations or lagging indicators.
Flexibility: Customizable timeframes and toggles cater to various trading strategies.
Transparency: The debug table makes the indicator’s logic accessible to all users, not just those who can read Pine Script.
Practicality: Helps traders confirm trend alignment, a key factor in successful trading across timeframes.

Uptrick: Oscillator SpectrumUptrick: Oscillator Spectrum is a versatile trading tool designed to bring together multiple aspects of technical analysis—oscillators, momentum signals, divergence checks, correlation insights, and more—into one script. It includes customizable overlays and alert conditions intended to address a wide range of market conditions and trading styles.
Developed in Pine Script™, Uptrick: Oscillator Spectrum represents an extended version of the classic Ultimate Oscillator concept. It consolidates short-, medium-, and long-term momentum readings, applies correlation analysis across different symbols, and offers optional table-based metrics to provide traders with a more structured overview of potential trade setups. Whether used alongside your existing charts or as a standalone toolkit, it aims to build on and enhance the functionality of the standard Ultimate Oscillator.
### A Few Key Features
- Momentum Insights: Multiple timeframes for oscillators, plus buy/sell signal modes for flexible identification of overbought/oversold situations or crossovers.
- Divergence Detection: Automated checks for bullish/bearish divergences, aiming to help traders spot potential shifts in momentum.
- Correlation Meter: A visual histogram summarizing how selected assets are collectively trending. It is useful for tracking the bigger market picture.
- Gradient Overlays & Bar Coloring: Dynamic color transitions designed to emphasize changes in momentum, trend shifts, and overall sentiment without cluttering the chart.
- Money Flow Tracker: Tracks the flow of money into and out of the market using a smoothed Money Flow Index (MFI). Highlights overbought/oversold conditions with dynamic bar coloring and visual gradient fills, helping traders assess volume-driven sentiment shifts.
- Advanced Table Metrics: An optional table showing return on investment (ROI), collateral risk, and other contextual metrics for supported assets.
- Alerts & Automation: Configurable alerts covering divergence events, crossing of critical levels, and more, helping to keep traders informed of developments in real time.
### Intended Usage
- For Multiple Markets: Works on various markets (cryptocurrencies, forex pairs, stocks) to deliver a consistent view of momentum, potential entry/exit signals, and correlation.
- Adaptable Trading Styles: With customizable input settings, you can enable or disable specific features to align with your preferred strategies—intraday scalping, swing trading, or position holding.
By combining these elements under one indicator, Uptrick: Oscillator Spectrum allows traders to streamline analysis workflows, helping them stay focused on interpreting market moves and making informed decisions rather than juggling multiple scripts.
Purpose
Purpose of the “Uptrick: Oscillator Spectrum” Indicator
The “Uptrick: Oscillator Spectrum” indicator is intended to bring together several technical analysis elements into one tool. It combines oscillator-based momentum readings across different lookback periods, checks for potential divergences, provides optional buy/sell signal triggers, and offers correlation-based insights across multiple symbols. Additionally, it includes features such as bar coloring, gradient visualization, and user-configurable alerts to help highlight various market conditions.
By consolidating these functions, the script aims to help users systematically observe changing momentum, identify when prices reach user-defined overbought or oversold levels, detect when oscillator movements diverge from price, and examine whether different assets are aligning or diverging in their trends. The indicator also allows for optional advanced metric tables, which can supply further context on risk, ROI calculations, or other factors for supported assets. Overall, the script’s purpose is to organize multiple layers of technical analysis so that users have a structured way to evaluate potential trade opportunities and market behavior.
## Usage Guide
Below is an outline of how you can utilize the various components and features of Uptrick: Oscillator Spectrum in your charting workflow.
---
### 1. Using the Core Oscillator
- Basic View: By default, the script calculates a multi-timeframe oscillator (commonly displayed as the “Ultimate Oscillator”). This oscillator combines short-, medium-, and long-term measurements of buying pressure and true range.
- Overbought/Oversold Zones: You can configure thresholds (e.g., 70 for overbought, 30 for oversold) to help identify potential turning points. When the oscillator crosses these levels, it may indicate that price is extended in one direction.
- You can use the colors of the main oscillator to help you take short-term trades as well: cyan : Buy , red: Sell
- Alerts: If you enable alerts, the indicator can notify you when the oscillator crosses above or below your chosen overbought/oversold boundaries or when you get buy/sell signals.
---
### 2. Buy/Sell Signals in Overlay Modes
Uptrick: Oscillator Spectrum provides several signal modes and a choice between overlay true and overlay false or both. Additionally, you can pick which “line” (data source) the script uses to generate signals. This is set in the “Line to Analyze” dropdown, which includes Oscillator, HMA of Oscillator, and Moving Average. The following sections describe how each piece fits together.
---
#### Line to Analyze - Overlay Flase: Oscillator / HMA of Oscillator / Moving Average
1. Oscillator
- The core momentum reading, reflecting short-, medium-, and long-term periods combined.
2. HMA of Oscillator
- Applies a Hull Moving Average to the oscillator, creating a smoother but still responsive curve.
- Signals will be derived from this smoothed line. Some traders find it filters out minor fluctuations while remaining quicker to react than standard averages.
3. Moving Average
- Uses a user-selected MA type (SMA, EMA, WMA, etc.) over the oscillator values, rather than the raw oscillator itself.
- Tends to be more stable than the raw oscillator, but might delay signals more depending on the chosen MA settings.
---
#### Signal Modes
Regardless of which line you choose to analyze, you can use one of the following seven signal modes in overlay being true:
1. Overbought/Oversold (Pyramiding)
- What It Does:
- Buy signal when the chosen line crosses below the oversold threshold.
- Sell signal when it crosses above the overbought threshold.
- Pyramiding:
- Allows multiple triggers within the same overbought/oversold event.
2. Overbought/Oversold (Non Pyramiding)
- What It Does:
- Same thresholds but only one signal per oversold or overbought event.
- Use Case:
- Prevents repeated signals and chart clutter.
3. Smoothed MA Middle Crossover
- What It Does:
- Uses an MA defined by the user.
- Buy when crossing above the midpoint (50), Sell when crossing below.
- Use Case:
- Generates fewer signals, focusing on broader momentum shifts. There is no pyramiding.
In this image ,for example, the VWMA is used with length of 14 to identify buy sell signals.
4. Crossing Above Overbought/Below Oversold (Non Pyramiding)
- What It Does:
- Buy occurs if the line exits oversold territory by crossing back above it.
- Sell occurs if the line exits overbought territory by crossing back below it.
- Non Pyramiding:
- Restricts repeated signals until conditions reset.
5. Crossing Above Overbought/Below Oversold (Pyramiding)
- What It Does:
- Same thresholds, but allows multiple signals if the line repeatedly dips in and out of overbought or oversold.
- Use Case:
- More frequent entries/exits for active traders.
6. Divergence (Non Pyramiding)
- What It Does:
- Identifies bullish or bearish divergences using the chosen line vs. price.
- Buy for bullish divergence (higher low on the line vs. lower low on price), Sell for bearish divergence.
- Single Trigger:
- Only one signal per identified divergence event. (non pyramiding)
7. Divergence (Pyramiding)
- What It Does:
- Same divergence logic but triggers multiple times if the script sees repeated divergence in the same direction.
- Use Case:
- Could suit traders who layer positions during sustained divergence scenarios.
#### Overlay Modes: True vs. False
1. Overlay True
- Buy/sell arrows or labels plot directly on the main price chart, often at or near candlesticks.
- Bar Coloring:
- Can turn the candlestick bars green (buy) or red (sell), with intensity reflecting signal recency if bar coloring is enabled for this mode. (read below.)
- Advantage:
- Everything (price, signals, bar colors) is in one spot, making it straightforward to associate signals with current market action. You can adjust the periods of the main oscillator or lookback periods of divergences or overbought/oversold thresholds, to play around with your signals.
2. Overlay False
- Signal Placement:
- Signals appear in a sub-window or oscillator panel, leaving the main price chart uncluttered.
- Bar Coloring:
- You may still enable bar colors on the main chart (green for buy, red for sell) if desired.
- Alternatively, you can keep them neutral if you prefer a completely separate display of signals.
- Advantage:
- Clear separation of price action from signals, useful for cleaner charts or if using multiple overlay-based tools.
At the bottom are the signals for overlay being false and on the chart are the signals for overlay being true:
#### Bar Color Adjustments
1. Coloring Logic
- Bars typically go green on buy signals, red on sell signals.
- The opacity or brightness can vary to indicate signal freshness. When a new signal is formed, the color gets brighter. When there is no signal for a longer period of time, then the color slowly fades.
2. Enabling Bar Coloring
- In the indicator’s settings, turn on Bar Coloring.
- Choose “Signals Overlay True” or “Signals Overlay False” from the “Color should depend on:” dropdown, depending on which overlay approach you want to drive your bar colors. You can also chose the cloud fill in overlay false, correlation meter and smoothed HMA to color bars. Read more below:
### Bar Color Options:
When you enable bar coloring in Uptrick: Oscillator Spectrum, you can select which component or signal logic drives the color changes. Below are the five available choices:
---
#### Option 1: Overlay True Signals
- What It Does:
- Uses signals generated under the Overlay True mode to color the bars on your main chart.
- If a buy signal is triggered, bars turn green. If a sell signal occurs, bars turn red.
- Color Intensity:
- Bars appear brighter (more opaque) immediately after a new signal fires, then gradually fade over subsequent bars if no new signal appears.
---
#### Option 2: Overlay False Signals
- What It Does:
- Links bar coloring to signals generated when Overlay False mode is active.
- Buy/sell labels typically plot in a separate sub-window instead of the main chart, but your price bars can still change color based on these signals.
- Color Intensity:
- Similar to Overlay True, new buy/sell signals yield stronger color intensity, which fades over time.
- Use Case:
- Helps maintain a clean main chart (with signals off-chart) while still providing an immediate color-coded indication of a buy or sell state.
- Particularly useful if you prefer less clutter from signal markers on your price chart yet still want a visual representation of signal timing.
In this example normal divergence Pyramiding Signals are used in the overlay being true and the signals in overlay false are signals that analyze the HMA. This can help clear out noise (using a combo of both).
Option 3: Money Flow Tracker
What It Does:
The Money Flow Tracker uses the Money Flow Index (MFI), a volume-weighted oscillator, to measure the strength of money flowing into or out of an asset. The script smooths the raw MFI data using an EMA for a more responsive and visually intuitive output.
The feature also includes dynamic color gradients and bar coloring that highlight whether money flow is positive or negative.
Green Fill/Bar Color: Indicates positive money flow, suggesting potential accumulation.
Red Fill/Bar Color: Indicates negative money flow, signaling potential distribution.
Overbought and oversold thresholds are dynamically emphasized with transparency, making it easier to identify high-confidence zones.
Use Case:
Ideal for traders focusing on volume-driven sentiment to identify turning points or confirm existing trends.
Suitable for assessing broader market conditions when used alongside other indicators like oscillators or correlation analysis.
Provides additional clarity in spotting areas of accumulation or distribution, making it a valuable complement to price action and momentum studies.
---
#### Option 4: Correlation Meter
- What It Does:
- Colors the bars based on the indicator’s Correlation Meter output. The script checks multiple chosen tickers and sums up how many are trending positively or negatively.
- If the meter indicates an overall bullish bias (e.g., more than three assets in uptrend), bars turn green; if it’s bearish, bars turn red.
- Trend Readings:
- The correlation meter typically plots a histogram of bullish/neutral/bearish states. The bar color option links your chart’s candlestick coloring to that higher-level market sentiment.
- Use Case:
- Useful for traders wanting a quick visual prompt of whether the broader market (or a selection of related assets) is bullish or bearish at any given time.
- Helps avoid signals that conflict with the market majority.
#### Option 5: Smoothed HMA
- What It Does:
- Bar colors are driven by the slope or state of the Hull Moving Average (HMA) of the oscillator, rather than individual buy/sell triggers or correlation data.
- If the HMA indicates a strong upward slope (possibly darkening), bars may turn green; if the slope is downward (purple in the HMA line), bars turn red.
- Use Case:
- Ideal for those who focus on momentum continuity rather than discrete signals like overbought/oversold or divergence.
- May help identify smoother, more sustained moves, as the HMA filters out minor oscillations.
---
### 3. Using the Hull Moving Average (HMA) of the Oscillator
- HMA Calculation: You can enable a dedicated Hull Moving Average (HMA) for the oscillator. This creates a smoother line of the same underlying momentum reading, typically responding more quickly than classic moving averages.
- Color Intensity: As the HMA sustains an uptrend or downtrend, the script can adjust the line’s color. When slope momentum persists in one direction, the color appears more opaque. This intensification can hint that the existing direction may be well-established.
- Reversal Potential: If you observe the HMA color shifting or darkening after multiple bars of slope in the same direction, it may indicate increasing momentum. Conversely, a sudden flattening or change in color can be a clue that momentum is waning.
---
### 4. Moving Average Overlays & Gradient Cloud
- Oscillator MA: The script allows you to apply moving average types (SMA, EMA, SMMA, WMA, or VWMA) to the core oscillator, rather than to price. This can smooth out noise in the oscillator, potentially highlighting more consistent momentum shifts.
- Gradient Cloud: You can also enable a cloud in overlay true between two moving averages (for instance, a Hull MA and a Double EMA) on the price chart. The cloud fills with different colors, depending on which MA is above the other. This can provide a quick visual reference to bullish or bearish areas.
---
### 5. Divergence Detection
- Bullish & Bearish Divergence: By toggling “Calculate Divergence,” the script looks for oscillator pivots that contrast with price pivots (e.g., price making a lower low while the oscillator makes a higher low).
- A divergence is when the price makes an opposite pivot to the indicator value. E.g. Price makes lower low but indicator does higher low - This suggests a bullish divergence. THe opposite is for a bearish divergence.
- Visual Labels: When a divergence is found, labels (such as “Bull” or “Bear”) appear on the oscillator. This helps you see if the oscillator’s momentum patterns differ from the price movement.
- Filtering Signals: You can combine divergence signals with other features like overbought/oversold or the HMA slope to refine potential entries or exits.
---
### 6. Correlation & Multi-Ticker Analysis
- Correlation Meter: You can select up to five tickers in the settings. The script calculates a slope-based metric for each, then combines those metrics to show an overall bullish or bearish tendency (displayed as a histogram).
- Bar Coloring & Overlay: If you activate correlation-based bar coloring, it will reflect the broader trend alignment among the selected assets, potentially indicating when most are trending in the same direction.
- Use Case: If you trade multiple markets, the correlation histogram can help you quickly see if several major assets support the same market bias or are diverging from one another.
—
### 7. Money Flow Tracker
Money Flow Calculation: The Money Flow Tracker calculates the Money Flow Index (MFI) based on price and volume data, factoring in buying pressure and selling pressure. The output is smoothed using a low-lag EMA to reduce noise and enhance usability.
Visual Features:
Dynamic Gradient Fill:
The space between the smoothed MFI line and the midline (set at 50) is filled with a gradient.
Above 50: Green gradient, with intensity increasing as the MFI moves further above the midline.
Below 50: Red gradient, with intensity increasing as the MFI moves further below the midline.
This gradient provides a clear visual representation of money flow strength and direction, making it easier to assess sentiment shifts at a glance.
Overbought/Oversold Levels: Default thresholds are set at 70 (overbought) and 30 (oversold). When the MFI crosses these levels, it signals potential reversals or trend continuations.
Bar Coloring:
Bars turn green for positive money flow and red for negative money flow.
Color intensity fades over time, ensuring recent signals stand out while older ones remain visible without dominating the chart.
Alerts:
Alerts are triggered when the Money Flow Tracker crosses into overbought or oversold zones, keeping traders informed of critical conditions without constant monitoring.
Practical Applications:
Trend Confirmation: Use the Money Flow Tracker alongside the oscillator or HMA to confirm trends or identify potential reversals.
Volume-Based Reversal Signals: Spot turning points where price action aligns with shifts in money flow direction.
Sentiment Analysis: Gauge whether market participants are accumulating (positive flow) or distributing (negative flow) assets, offering an additional layer of insight into price movement.
(Space for an example chart: “Money Flow Tracker with gradient fills and overbought/oversold levels”)
### 8. Putting It All Together
- Combining Signals: A practical approach might be to watch for a bullish divergence in the oscillator, confirm it with a shift in the HMA slope color, and then wait for the price to be near or below oversold conditions. The correlation histogram may further confirm if the broader market is also leaning bullish at that time.
- Visual Cues: Bar coloring adds another layer, making your chart easier to interpret at a glance. You can also set alerts to ensure you don’t miss key events like divergences, crossovers, or moving average flips.
- Flexibility: Not every feature needs to be used simultaneously. You might opt to focus on divergences and overbought/oversold signals, or you could emphasize the correlation histogram and bar colors. The settings let you enable or disable each module to suit your style.
---
### 9. Tips for Customization
- Adjust Periods: Shorter periods can yield more signals but also more noise. Longer periods may provide steadier, but fewer, signals.
- Set Appropriate Alert Conditions: Only alert on events most relevant to your strategy to avoid overload.
- Explore Different MAs: Depending on the instrument, some moving average types may give a smoother or more responsive indication.
- Monitor Risk Management: As with any tool, these signals do not guarantee performance, so consider position sizing and stop-loss strategies.
---
By toggling and experimenting with the features described above—buy/sell signals, divergences, moving averages, dynamic gradient clouds, and correlation analysis—you can tailor Uptrick: Oscillator Spectrum to your specific trading approach. Each module is designed to give you a clearer, structured view of potential momentum shifts, overbought or oversold states, and the alignment or divergence of multiple assets.
## Features Explanation
Below is a detailed overview of key features in Uptrick: Oscillator Spectrum. Each component is designed to provide different angles of market analysis, allowing you to customize the tool to your preferences.
---
### 1. Main Oscillator
- Purpose: The primary oscillator in this script merges short-, medium-, and long-term views of buying pressure and true range into a single line.
- Calculation: It weights each period’s contribution (e.g., a heavier focus on the short period if desired) and normalizes the result on a 0–100 scale, where higher readings may suggest more robust momentum. (like from the classic Ultimate Oscillator)
- Practical Use:
- Traders can watch for overbought/oversold conditions at user-defined thresholds (e.g., 70/30).
- It can also provide a straightforward momentum reading for those who prefer to see if momentum is rising, falling, or leveling off.
---
### 2. HMA of the Smoothed Oscillator
- What It Is: A Hull Moving Average (HMA) applied to the main oscillator values. The HMA is often more responsive than standard MAs, offering smoother lines while preserving relatively quick reaction to changes.
- How It Works:
- The script takes the oscillator’s output and processes it through a Hull MA calculation.
- The HMA’s slope and color can change more dynamically, highlighting sharper momentum shifts.
- Why It’s Useful:
- By smoothing out minor fluctuations, the HMA can highlight trends in the oscillator’s trajectory.
- If you see an extended run in the HMA slope, it may indicate a more persistent trend in momentum.
- Color Intensity:
- As the HMA continues in one direction for several bars, the script can intensify the color, signaling stronger or more sustained momentum in that direction.
- Sudden changes in color or slope can signal the start of a new momentum swing.
---
### 3. Gradient Fill
This script uses two gradient-based visual elements:
1. Shining/Layered Gradient on the Main Oscillator
- Purpose: Adds multiple layers around the oscillator line (above and below) to emphasize slope changes and highlight how quickly the oscillator is moving up or down.
- Color Changes:
- When the oscillator rises, it uses a color scheme (e.g., aqua/blue) that intensifies as the slope grows.
- When the oscillator declines, it uses a distinct color (e.g., red/pink).
- User Benefit: Makes it easier to see at a glance if momentum is accelerating or decelerating, beyond just the numerical reading.
2. Dynamic Cloud Fill (Between MAs)
- Purpose: Allows you to plot two moving averages (for example, a short-term Hull MA and a longer-term DEMA) and fill the area between them with a color gradient.
- Bullish vs. Bearish:
- When the short MA is above the long MA, the cloud might appear in a greenish hue.
- When the short MA is below the long MA, the cloud can switch to red or another color.
- Transparency/Intensity:
- The fill can get more opaque if the difference between the two MAs is large, indicating a stronger trend but a higher probability of a reversal.
- User Benefit: Helps visualize changes in trend or momentum across multiple time horizons, all within a single chart overlay.
---
### 4. Correlation Meter & Symbol Inputs
- What It Is: This feature looks at multiple user-selected symbols (e.g., BTC, ETH, BNB, etc.) and computes each symbol’s short-term slope. It then aggregates these slopes into an overall “trend” score.
- Inputs Configuration:
1. Ticker Inputs: You can specify up to five different tickers.
2. Timeframe: Decide whether to pull data from different chart timeframes for each symbol.
3. Slope Calculation: The script may compute, for instance, a 5-period SMA minus a 20-period SMA to gauge if each symbol is trending up or down.
- Market Trend Histogram:
- Displays a column that goes above/below zero depending on how many symbols are bullish or bearish.
- If more than three (out of five) symbols are bullish, the histogram can show a green bar at +1; if fewer than three are bullish, it can show red at –1.
- How to Use:
- Quick Glance: Lets you know if most correlated assets are aligning or diverging.
- Bar Coloring (Optional): If enabled, your main chart’s bars can reflect the aggregated correlation, turning green or red depending on the meter’s reading.
---
### 5. Advanced Metrics Table
- What It Is: An optional table displaying additional metrics for several cryptocurrencies (or any symbols you define).
- Metrics Included:
1. ROI (30D): Calculates return relative to the lowest price in a 30-day period.
2. Collateral Risk: Uses standard deviation to assess volatility (higher risk if standard deviation is large).
3. Liquidity Recovery: A rolling average of volume, aiming to show how liquidity flows might recover over time.
4. Weakening (Rate of Change): Reflects how quickly price is changing compared to previous bars.
5. Monetary Bias (SMA): A simple average of recent prices. If price is below this SMA, it might be seen as undervalued relative to the short term.
6. Risk Phase: Categorizes risk as low, medium, or high based on the standard deviation figure.
7. DCA Signal: Suggests “Accumulate” or “Do Not Accumulate” by checking if the current price is below or above the SMA.
- Why It’s Useful:
- Offers a concise view of multiple assets in one place—helpful for portfolio-level insight.
- DCA (Dollar-Cost Averaging) suggestions can guide longer-term strategies, while volatility (collateral risk) helps gauge how aggressive the price swings might be.
---
### 6. Other Vital Aspects
- Alerts & Notifications:
- The script can trigger alerts for various conditions—crossovers, divergence detections, overbought/oversold transitions, or correlation-based signals.
- Useful for automating watchlists or ensuring you don’t miss a key setup while away from the screen.
- Customization:
- Each module (oscillator settings, divergence detection, correlation meter, advanced metrics table, etc.) can be enabled or disabled based on your preferences.
- You can fine-tune parameters (e.g., periods, smoothing lengths, alert triggers) to align the indicator with different trading styles—scalping, swing, or position trading.
- Combining Features:
- One might watch the main oscillator for momentum extremes, confirm via the HMA slope, check if correlation supports the same bias, and look at the table for risk-phase validation.
- This multi-layer approach can help develop a more structured and informed trading view.
(Space for an example chart: “A fully configured layout showing oscillator, HMA, gradient cloud, correlation meter, and table all in use.”)
7. Money Flow Tracker
Purpose: The Money Flow Tracker adds a volume-based perspective to the indicator suite by incorporating the Money Flow Index (MFI), which assesses buying and selling pressure over a defined period. By smoothing the MFI using an exponential moving average (EMA), the feature highlights the directional flow of capital into and out of the market with greater clarity and reduced noise.
Dynamic Gradient Visualization:
The Money Flow Tracker enhances visual analysis with gradient fills that reflect the MFI’s relationship to the midline (50).
Above 50: A green gradient emerges, intensifying as the MFI moves higher, indicating stronger positive money flow.
Below 50: A red gradient appears, with deeper shades signifying increasing selling pressure.
Transparency dynamically adjusts based on the MFI’s proximity to the midline, making high-confidence zones (closer to 0 or 100) visually distinct.
Directional Sensitivity:
The Tracker emphasizes the importance of overbought (above 70) and oversold (below 30) zones. These thresholds help traders identify when an asset might be overextended, signaling potential reversals or trend continuations.
The inclusion of a midline (50) as a neutral zone helps gauge shifts between accumulation (money flowing in) and distribution (money flowing out).
Bar Integration:
By enabling bar coloring linked to the Money Flow Tracker, traders can visualize its impact directly on price bars.
Green bars reflect positive money flow (above 50), signaling bullish conditions.
Red bars indicate negative money flow (below 50), highlighting bearish sentiment.
Intensity adjustments ensure that recent signals are more visually prominent, while older signals gradually fade for a clean, non-cluttered chart.
Key Advantages:
Volume-Informed Context: Traditional oscillators often focus solely on price; the Money Flow Tracker incorporates volume, adding a crucial dimension for analyzing market behavior.
Adaptive Filtering: The EMA-smoothing feature ensures that sudden, insignificant spikes in volume don’t trigger false signals, providing a clearer and more actionable representation of money flow trends.
Early Warning System: Divergences between price movement and the Money Flow Tracker’s trends can signal potential turning points, helping traders anticipate reversals before they occur.
Practical Use Cases:
Trend Confirmation: Pair the Money Flow Tracker with the oscillator or HMA to confirm bullish or bearish trends. For example, a rising oscillator with positive money flow indicates strong buying interest.
Identifying Entry/Exit Zones: Use overbought/oversold conditions as entry/exit points, particularly when combined with other features like divergence detection.
Market Sentiment Analysis: The Tracker’s ability to dynamically assess buying and selling pressure provides a clear picture of market sentiment, helping traders adjust their strategies to align with broader trends.
By understanding these features—main oscillator readings, the HMA’s smoothing capabilities, gradient-based visual highlights, correlation insights, advanced metrics, and the money flow tracker—you can tailor Uptrick: Oscillator Spectrum to your specific needs, whether you’re focusing on quick trades, longer-term market moves, or broad portfolio health.
Originality of the “Uptrick: Oscillator Spectrum” Indicator
While it includes elements of standard momentum analysis, Uptrick: Oscillator Spectrum sets itself apart by adding an array of features that broaden the typical oscillator’s scope:
1. Slope Coloring & Layered Gradient Effects
- Beyond just plotting a single line, the indicator visually highlights momentum shifts using color changes and gradient fills.
- As the oscillator’s slope becomes steeper or flatter, these gradients intensify or fade, helping users see at a glance when momentum is accelerating, slowing, or reversing.
2. Mean Reversion & Divergence Detection
- The script offers optional logic for marking potential mean reversion points (e.g., overbought/oversold crossovers) and flagging divergences between price and the oscillator line.
- These divergence signals come with adjustable lookback parameters, giving traders control over how recent or extended the pivots should be for detection.
- This functionality can reveal subtle momentum discrepancies that a basic oscillator might overlook.
3. Integrated Multi-Asset Correlation Meter
- In addition to monitoring a single symbol, the indicator can fetch data for multiple tickers. It aggregates each symbol’s slope into a histogram showing whether the broader market (or a group of assets) leans bullish or bearish.
- This cross-market insight moves beyond standard “one-symbol, one-oscillator” usage, adding a bigger-picture perspective in one tool.
4. Advanced Metrics Table
- Users can enable a table that covers ROI calculations, volatility-based risk (“Collateral Risk”), liquidity checks, DCA signals, and more.
- Rather than just seeing an oscillator value, traders can view additional metrics for selected assets in one place, helping them judge overall market conditions or assess multiple instruments simultaneously.
5. Flexible Overlay & Bar Coloring
- Signals can be displayed directly on the price chart (Overlay True) or in a sub-window (Overlay False).
- Bars themselves may change color (e.g., green for bullish or red for bearish) according to different rules—signals, dynamic cloud fill, correlation meter states, etc.
- This adaptability allows traders to keep the chart as simple or as info-rich as they prefer.
6. Custom Smoothing Options & HMA Extensions
- The oscillator can be processed further with a Hull Moving Average (HMA) to reduce noise while still reacting quickly to market changes.
- Slope-based coloring on the HMA provides an additional layer of visual feedback, which is not common in a standard oscillator.
By blending traditional momentum checks with slope-based color feedback, mean reversion triggers, divergence signals, correlation analysis, and an optional metrics table, Uptrick: Oscillator Spectrum offers a more rounded approach than a typical oscillator. It integrates multiple market insights—both visual and analytical—into one script, giving users a broader toolkit for studying potential reversals, gauging momentum strength, and assessing multi-asset trends.
## Conclusion
Uptrick: Oscillator Spectrum brings together multiple layers of analysis—oscillator momentum, divergence detection, correlation insights, HMA smoothing, and more—into one adaptable toolkit. It aims to streamline your charting process by offering meaningful visual cues (such as gradient fills and bar color shifts), advanced tables for broader market data, and flexible alerts to keep you informed of potential setups.
Traders can choose the specific features that suit their style, whether they prefer to focus on raw oscillator signals, multi-ticker correlation, or smooth trend cues from the HMA. By centralizing these different methods in one place, Uptrick: Oscillator Spectrum can help users build more structured approaches to spotting trend shifts and extended conditions, while also remaining compatible with additional analysis techniques.
---
### Disclaimer
This script is provided for informational purposes only and does not constitute financial or investment advice. Past performance is not indicative of future results, and all trading involves risk. You should carefully consider your objectives, risk tolerance, and financial situation before making any trading decisions.

Watermark with dynamic variables [BM]█ OVERVIEW
This indicator allows users to add highly customizable watermark messages to their charts. Perfect for branding, annotation, or displaying dynamic chart information, this script offers advanced customization options including dynamic variables, text formatting, and flexible positioning.
█ CONCEPTS
Watermarks are overlay messages on charts. This script introduces placeholders — special keywords wrapped in % signs — that dynamically replace themselves with chart-related data. These watermarks can enhance charts with context, timestamps, or branding.
█ FEATURES
Dynamic Variables : Replace placeholders with real-time data such as bar index, timestamps, and more.
Advanced Customization : Modify text size, color, background, and alignment.
Multiple Messages : Add up to four independent messages per group, with two groups supported (A and B).
Positioning Options : Place watermarks anywhere on the chart using predefined locations.
Timezone Support : Display timestamps in a preferred timezone with customizable formats.
█ INPUTS
The script offers comprehensive input options for customization. Each Watermark (A and B) contains identical inputs for configuration.
Watermark settings are divided into two levels:
Watermark-Level Settings
These settings apply to the entire watermark group (A/B):
Show Watermark: Toggle the visibility of the watermark group on the chart.
Position: Choose where the watermark group is displayed on the chart.
Reverse Line Order: Enable to reverse the order of the lines displayed in Watermark A.
Message-Level Settings
Each watermark contains up to four configurable messages. These messages can be independently customized with the following options:
Message Content: Enter the custom text to be displayed. You can include placeholders for dynamic data.
Text Size: Select from predefined sizes (Tiny, Small, Normal, Large, Huge) or specify a custom size.
Text Alignment and Colors:
- Adjust the alignment of the text (Left, Center, Right).
- Set text and background colors for better visibility.
Format Time: Enable time formatting for this watermark message and configure the format and timezone. The settings for each message include message content, text size, alignment, and more. Please refer to Formatting dates and times for more details on valid formatting tokens.
█ PLACEHOLDERS
Placeholders are special keywords surrounded by % signs, which the script dynamically replaces with specific chart-related data. These placeholders allow users to insert dynamic content, such as bar information or timestamps, into watermark messages.
Below is the complete list of currently available placeholders:
bar_index , barstate.isconfirmed , barstate.isfirst , barstate.ishistory , barstate.islast , barstate.islastconfirmedhistory , barstate.isnew , barstate.isrealtime , chart.is_heikinashi , chart.is_kagi , chart.is_linebreak , chart.is_pnf , chart.is_range , chart.is_renko , chart.is_standard , chart.left_visible_bar_time , chart.right_visible_bar_time , close , dayofmonth , dayofweek , dividends.future_amount , dividends.future_ex_date , dividends.future_pay_date , earnings.future_eps , earnings.future_period_end_time , earnings.future_revenue , earnings.future_time , high , hl2 , hlc3 , hlcc4 , hour , last_bar_index , last_bar_time , low , minute , month , ohlc4 , open , second , session.isfirstbar , session.isfirstbar_regular , session.islastbar , session.islastbar_regular , session.ismarket , session.ispostmarket , session.ispremarket , syminfo.basecurrency , syminfo.country , syminfo.currency , syminfo.description , syminfo.employees , syminfo.expiration_date , syminfo.industry , syminfo.main_tickerid , syminfo.mincontract , syminfo.minmove , syminfo.mintick , syminfo.pointvalue , syminfo.prefix , syminfo.pricescale , syminfo.recommendations_buy , syminfo.recommendations_buy_strong , syminfo.recommendations_date , syminfo.recommendations_hold , syminfo.recommendations_sell , syminfo.recommendations_sell_strong , syminfo.recommendations_total , syminfo.root , syminfo.sector , syminfo.session , syminfo.shareholders , syminfo.shares_outstanding_float , syminfo.shares_outstanding_total , syminfo.target_price_average , syminfo.target_price_date , syminfo.target_price_estimates , syminfo.target_price_high , syminfo.target_price_low , syminfo.target_price_median , syminfo.ticker , syminfo.tickerid , syminfo.timezone , syminfo.type , syminfo.volumetype , ta.accdist , ta.iii , ta.nvi , ta.obv , ta.pvi , ta.pvt , ta.tr , ta.vwap , ta.wad , ta.wvad , time , time_close , time_tradingday , timeframe.isdaily , timeframe.isdwm , timeframe.isintraday , timeframe.isminutes , timeframe.ismonthly , timeframe.isseconds , timeframe.isticks , timeframe.isweekly , timeframe.main_period , timeframe.multiplier , timeframe.period , timenow , volume , weekofyear , year
█ HOW TO USE
1 — Add the Script:
Apply "Watermark with dynamic variables " to your chart from the TradingView platform.
2 — Configure Inputs:
Open the script settings by clicking the gear icon next to the script's name.
Customize visibility, message content, and appearance for Watermark A and Watermark B.
3 — Utilize Placeholders:
Add placeholders like %bar_index% or %timenow% in the "Watermark - Message" fields to display dynamic data.
Empty lines in the message box are reflected on the chart, allowing you to shift text up or down.
Using \n in the message box translates to a new line on the chart.
4 — Preview Changes:
Adjust settings and view updates in real-time on your chart.
█ EXAMPLES
Branding
DodgyDD's charts
Debugging
█ LIMITATIONS
Only supports variables defined within the script.
Limited to four messages per watermark.
Visual alignment may vary across different chart resolutions or zoom levels.
Placeholder parsing relies on correct input formatting.
█ NOTES
This script is designed for users seeking enhanced chart annotation capabilities. It provides tools for dynamic, customizable watermarks but is not a replacement for chart objects like text labels or drawings. Please ensure placeholders are properly formatted for correct parsing.
Additionally, this script can be a valuable tool for Pine Script developers during debugging . By utilizing dynamic placeholders, developers can display real-time values of variables and chart data directly on their charts, enabling easier troubleshooting and code validation.
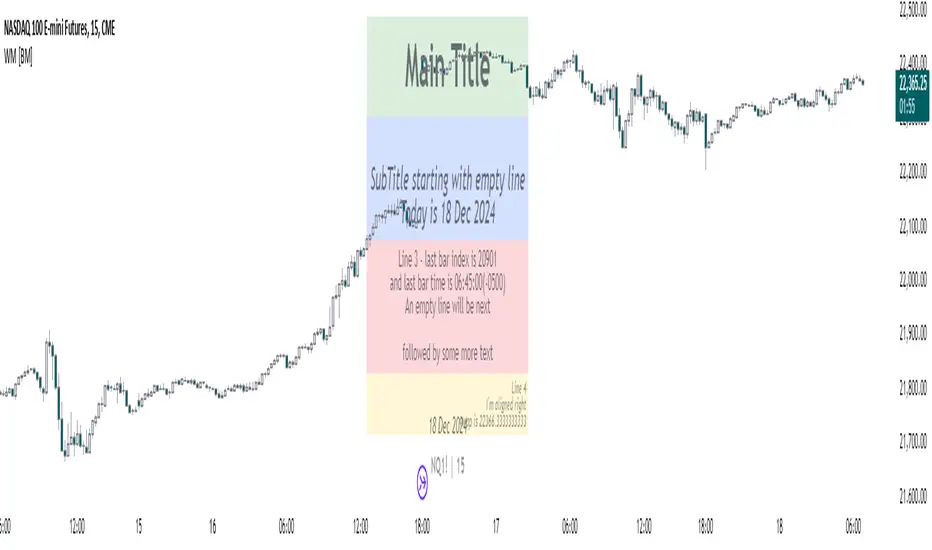
MoonFlag BTC Daily Swing PredictorThis script mainly works on BTC on the daily timeframe. Other coins also show similar usefulness with this script however, BTC on the daily timeframe is the main design for this script.
(Please note this is not trading advice this is just comments about how this indicator works.)
This script is predictive. It colors the background yellow when the script calculates a large BTC swing is potentially about to happen. It does not predict in which direction the swing will occur but it leads the price action so can be useful for leveraged trades. When the background gets colored with vertical yellow lines - this shows that a largish price swing is probably going to occur.
The scripts also shades bands around the price action that are used to estimate an acceptable volatility at any given time. If the bands are wide that means price action is volatile and large swings are not easily predicted. Over time, with reducing volatility, these price action bands narrow and then at a set point or percentage (%) which can be set in the script settings, the background gets colored yellow. This indicates present price action is not volatile and a large price swing is potentially going to happen in the near future. When price action breaks through the narrowing bands, the background is no longer presented because this is seen as an increase in volatility and a considerable portion of the time, a large sudden drop in price action or momentous gain in price is realized.
This indicator leads price action. It predicts that a swing is possibly going to happen in the near future. As the indicator works on the BTC daily, this means on a day-to-day basis if the bands continually narrow - a breakout is more likely to happen. In order to see how well this indicator works, have a look at the results on the screenshot provided. Note the regions where vertical yellow lines are present on the price action - and then look after these to see if a sizeable swing in price has occurred.
To use this indicator - wait until yellow vertical lines are presented on the BTC daily. Then use your experience to determine which way the price action might swing and consider entering a trade or leveraged trade in this direction. Alternatively wait a while to see in which direction the break-out occurs and considering and attempt to trade with this. Sometimes swings can be unexpected and breakout in one direction before then swinging much larger in the other. Its important to remember/consider that this indicator works on the BTC daily timeframe, so any consideration of entering a trade should be expected to cover a duration over many days or weeks, or possibly months. A large swing is only estimated every several plus months.
Most indicators are based on moving averages. A moving average is not predictive in the sense in that it lags price actions. This indicator creates bands that are based on the momentum of the price action. A change in momentum of price action therefore causes the bands to widen. When the bands narrow this means that the momentum of the price action is steady and price action volatility has converged/reduced over time. With BTC this generally means that a large swing in price action is going to occur as momentum in price action then pick-up again in one direction or another. Trying to view this using moving averages is not easy as a moving average lags price action which means that it is difficult to predict any sudden movements in price action ahead of when they might occur. Although, moving averages will converge over time in a similar manner as the bands calculated by this script. This script however, uses the price action momentum in a predictive manner to estimate where the price action might go based on present price momentum. This script therefore reacts to reduced volatility in price action much faster than a set of moving averages over various timescales can achieve.
MoonFlag

Dividend Calendar (Zeiierman)█ Overview
The Dividend Calendar is a financial tool designed for investors and analysts in the stock market. Its primary function is to provide a schedule of expected dividend payouts from various companies.
Dividends, which are portions of a company's earnings distributed to shareholders, represent a return on their investment. This calendar is particularly crucial for investors who prioritize dividend income, as it enables them to plan and manage their investment strategies with greater effectiveness. By offering a comprehensive overview of when dividends are due, the Dividend Calendar aids in informed decision-making, allowing investors to time their purchases and sales of stocks to optimize their dividend income. Additionally, it can be a valuable tool for forecasting cash flow and assessing the financial health and dividend-paying consistency of different companies.
█ How to Use
Dividend Yield Analysis:
By tracking dividend growth and payouts, traders can identify stocks with attractive dividend yields. This is particularly useful for income-focused investors who prioritize steady cash flow from their investments.
Income Planning:
For those relying on dividends as a source of income, the calendar helps in forecasting income.
Trend Identification:
Analyzing the growth rates of dividends helps in identifying long-term trends in a company's financial health. Consistently increasing dividends can be a sign of a company's strong financial position, while decreasing dividends might signal potential issues.
Portfolio Diversification:
The tool can assist in diversifying a portfolio by identifying a range of dividend-paying stocks across different sectors. This can help mitigate risk as different sectors may react differently to market conditions.
Timing Investments:
For those who follow a dividend capture strategy, this indicator can be invaluable. It can help in timing the buying and selling of stocks around their ex-dividend dates to maximize dividend income.
█ How it Works
This script is a comprehensive tool for tracking and analyzing stock dividend data. It calculates growth rates, monthly and yearly totals, and allows for custom date handling. Structured to be visually informative, it provides tables and alerts for the easy monitoring of dividend-paying stocks.
Data Retrieval and Estimation: It fetches dividend payout times and amounts for a list of stocks. The script also estimates future values based on historical data.
Growth Analysis: It calculates the average growth rate of dividend payments for each stock, providing insights into dividend consistency and growth over time.
Summation and Aggregation: The script sums up dividends on a monthly and yearly basis, allowing for a clear view of total payouts.
Customization and Alerts: Users can input custom months for dividend tracking. The script also generates alerts for upcoming or current dividend payouts.
Visualization: It produces various tables and visual representations, including full calendar views and income tables, to display the dividend data in an easily understandable format.
█ Settings
Overview:
Currency:
Description: This setting allows the user to specify the currency in which dividend values are displayed. By default, it's set to USD, but users can change it to their local currency.
Impact: Changing this value alters the currency denomination for all dividend values displayed by the script.
Ex-Date or Pay-Date:
Description: Users can select whether to show the Ex-dividend day or the Actual Payout day.
Impact: This changes the reference date for dividend data, affecting the timing of when dividends are shown as due or paid.
Estimate Forward:
Description: Enables traders to predict future dividends based on historical data.
Impact: When enabled, the script estimates future dividend payments, providing a forward-looking view of potential income.
Dividend Table Design:
Description: Choose between viewing the full dividend calendar, just the cumulative monthly dividend, or a summary view.
Impact: This alters the format and extent of the dividend data displayed, catering to different levels of detail a user might require.
Show Dividend Growth:
Description: Users can enable dividend growth tracking over a specified number of years.
Impact: When enabled, the script displays the growth rate of dividends over the selected number of years, providing insight into dividend trends.
Customize Stocks & User Inputs:
This setting allows users to customize the stocks they track, the number of shares they hold, the dividend payout amount, and the payout months.
Impact: Users can tailor the script to their specific portfolio, making the dividend data more relevant and personalized to their investments.
-----------------
Disclaimer
The information contained in my Scripts/Indicators/Ideas/Algos/Systems does not constitute financial advice or a solicitation to buy or sell any securities of any type. I will not accept liability for any loss or damage, including without limitation any loss of profit, which may arise directly or indirectly from the use of or reliance on such information.
All investments involve risk, and the past performance of a security, industry, sector, market, financial product, trading strategy, backtest, or individual's trading does not guarantee future results or returns. Investors are fully responsible for any investment decisions they make. Such decisions should be based solely on an evaluation of their financial circumstances, investment objectives, risk tolerance, and liquidity needs.
My Scripts/Indicators/Ideas/Algos/Systems are only for educational purposes!

Rolling VWAP█ OVERVIEW
This indicator displays a Rolling Volume-Weighted Average Price. Contrary to VWAP indicators which reset at the beginning of a new time segment, RVWAP calculates using a moving window defined by a time period (not a simple number of bars), so it never resets.
█ CONCEPTS
If you are not already familiar with VWAP, our Help Center will get you started.
The typical VWAP is designed to be used on intraday charts, as it resets at the beginning of the day. Such VWAPs cannot be used on daily, weekly or monthly charts. Instead, this rolling VWAP uses a time period that automatically adjusts to the chart's timeframe. You can thus use RVWAP on any chart that includes volume information in its data feed.
Because RVWAP uses a moving window, it does not exhibit the jumpiness of VWAP plots that reset. You can see the more jagged VWAP on the chart above. We think both can be useful to traders; up to you to decide which flavor works for you.
█ HOW TO USE IT
Load the indicator on an active chart (see the Help Center if you don't know how).
Time period
By default, the script uses an auto-stepping mechanism to adjust the time period of its moving window to the chart's timeframe. The following table shows chart timeframes and the corresponding time period used by the script. When the chart's timeframe is less than or equal to the timeframe in the first column, the second column's time period is used to calculate RVWAP:
Chart Time
timeframe period
1min 🠆 1H
5min 🠆 4H
1H 🠆 1D
4H 🠆 3D
12H 🠆 1W
1D 🠆 1M
1W 🠆 3M
You can use the script's inputs to specify a fixed time period, which you can express in any combination of days, hours and minutes.
By default, the time period currently used is displayed in the lower-right corner of the chart. The script's inputs allow you to hide the display or change its size and location.
Minimum Window Size
This input field determines the minimum number of values to keep in the moving window, even if these values are outside the prescribed time period. This mitigates situations where a large time gap between two bars would cause the time window to be empty, which can occur in non-24x7 markets where large time gaps may separate contiguous chart bars, namely across holidays or trading sessions. For example, if you were using a 1D time period and there is a two-day gap between two bars, then no chart bars would fit in the moving window after the gap. The default value is 10 bars.
█ NOTES
If you are interested in VWAP indicators, you may find the VWAP Auto Anchored built-in indicator worth a try.
For Pine Script™ coders
The heart of this script's calculations uses the `totalForTimeWhen()` function from the ConditionalAverages library published by PineCoders . It works by maintaining an array of values included in a time period, but without a for loop requiring a lookback from the current bar, so it is much more efficient.
We write our Pine Script™ code using the recommendations in the User Manual's Style Guide .
Look first. Then leap.
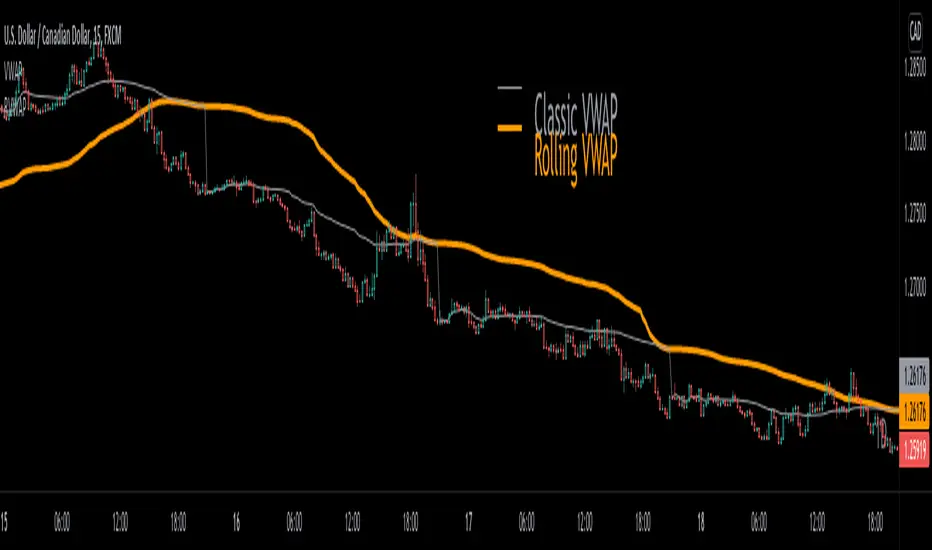
Volume Spike Retracement█ OVERVIEW
-Following many people's request to add "Volume" mode again in my "Institutional OrderBlock Pressure" script. I decided to release an improved
and full-fledged script. This will be the last OB/Retracement script I will release as we have explored every possible way to find them.
█ HOW TO INTERPRET?
-The script uses the the 0.5 Pivot and the maximum value set for Volume Length to find 'Peak Volume'. Once these conditions are met,
the script starts creating a Retracement Line.
-By default, the Volume Length value is set to 89, which works well with most Timeframes following the OrderBlocks/Retracements
logic used in my scripts.
-You have the option to set Alerts when the "Volume Spike Limit" is reached or when a Price Crossing with a Line occurs.
█ NOTES
- Yes Alerts appear instantly. Moreover, they are not 'confirmed', you must ALWAYS wait for confirmation before making a choice.
Good Trade everyone and remember, risk management remains the most important!
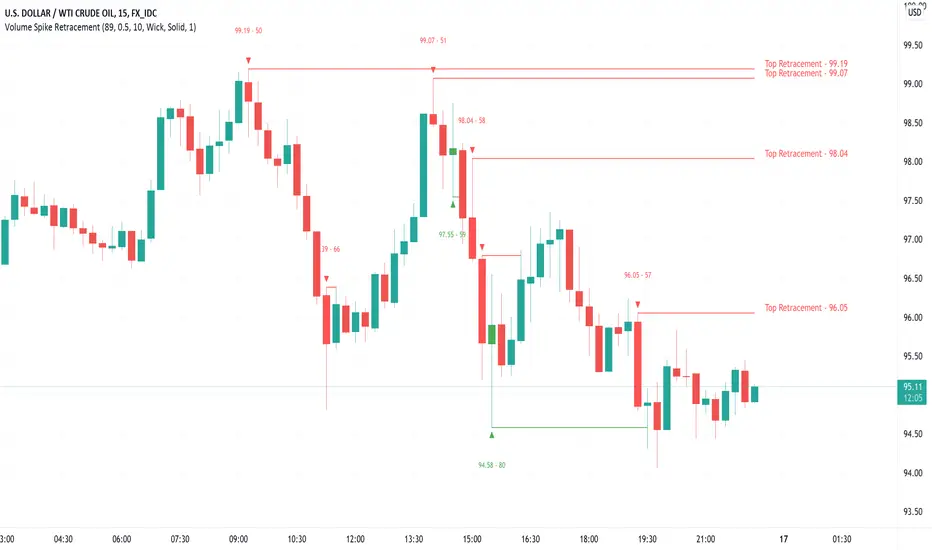
Auto Harmonic Patterns - V2Hello traders. After getting good response to my earlier Harmonic patterns scripts, decided to deep dive a bit and make it bit more interesting and detailed.
Before I explain further on the script, few important things to note:
The script is very intensive and may often timeout or give memory error. If that happens, just reload the script. It may not work on smaller timeframes due to same reason. At this point, we cannot do much about it.
This should not be considered as strategy - but as a tool to make your harmonic based trades. Options are available to set your entry, stop and target levels based on your trading methods.
If there is timeout - try reducing the scope by disabling few zigzags and reducing Max depth from the settings.
Script does not show historical patterns. It will only show patterns which are currently in trade. This is done to reduce errors due to number of lines and labels. To track past patterns, you can either replay previous bars or use stats table.
After lots of deliberation, this script is released as protected script instead of invite only. Use it well :)
OVERVIEW
This script combines earlier two scripts defined on harmonic patterns:
Multi-ZigZag-Harmonic-Patterns
Multi-Level-ZigZag-Harmonic-Patterns
Merging these two the present script allows up to 4 Zigzags to be used and each zigzag comes with one multi level Zigzag. Logic of deriving multi level zigzag is described here: Multi-Level-Zigzag
On top of that each combination scans last 11 pivots (Max Depth) with all permutation combinations to come up with better pattern recognition. So, the complexity of the scan is 8 * (MaxDepth-4)!/2
In order to speed up the execution, you can chose to enable only the zigzags you are looking to trade instead of allowing all 4. Multi level zigzags cannot be enabled/disabled separately at this point.
INPUT PARAMETERS
Target and Stops
Entry Ratio : Minimal retracement from AD or CD (whichever is max) to enter into order
Stop Ratio : Retracement or extension from AC or AD (whichever is max) to stop or invalidate the trade. Negative values mean that stops are placed beyond D away from A/C whereas positive valus mean stops are placed between A/C and D. Please note Stop Ratio should be lesser than Entry Ratio. Wider the better for longevity of trade.
Target Ratios: Different points where profits can be taken. This is not optimized for strategy or pattern. To be used as per individual trading method.
Trailing Start Stage: This tells after what stage to start trailing stop loss. Trail will be based on difference between past subsequent levels. For example, if instrument is trading beyond Target 4, trail distance will be target4-target3
Pattern detection settings
Error Percent : Error threshold to be allowed for pattern recognition
Max Depth : Number of last pivots to consider for scanning patterns with m X n permutation. Increased numbers show more patterns but also slows down the script and may even lead to timeout.
Wait For Confirmation : Pattern recognition only happens on confirmed zigzags. Stats will show higher success rates and lesser patterns if this option is selected. That is because, there will be lag in identifying the patterns as confirming zigzags takes few bars.
Ignore if Entry Crossed : Only effective when Wait For Confirmation is enabled. If price has gone beyond entry when pattern has formed, system will ignore the pattern and do not try to plot it on charts.
Stats and Display
Show Trade Stats, Open Trades Stat Position, Closed Trades Stat Position can be used to display trade statistics and set different positions for tables display
Show Targets : Display/Hide target and stop levels
Show XABCD : Display/Hide XABCD marking on patterns
Show Ratios : Display/Hide harmonic ratios used for pattern recognition
Zigzags ( 1 - 4 )
L1 Length is primary zigzag length.
L2 Length is for deriving multi level zigzag based on L1
Patterns
Allows enabling and disabling several patterns. List includes:
Classic Patterns
Gartley
Bat
Butterfly
Crab
Deep Crab
Cypher
Shark
NenStar
Anti Patterns
Anti NenStar
Anti Shark
Anti Cypher
Anti Shark
Anti Crab
Anti Butterfly
Anti Bat
Anti Gartley
Navarro 200
Comprehensive list of patterns are listed here: Complete List of Harmonic Pattern Ratios
TRADE STATISTICS
Open Trade Stats consists of following fields
Zigzag - Zigzag length and level 2 length
Status - Current status of the trade. This includes - Awaiting Entry, In Trade, Target<1-4> Reached
X, A, B, C, D - price levels of X, A, B, C, D
Entry, Stop and Target Levels - These are same as what is shown on chart for present trades but presented in tabular way for better readability in case there are more number of trades.
Rows will have green background on bullish trades and red background color for bearish trades. Bullish and bearish colors can be set in Generic Color input settings. Text Color will be same as Zigzag line color which can be set in settings.
Closed Trade Stats consists of following fields
Overridden - these are patterns which are formed but overridden by other pattern based on the same XABC but with different D with better risk reward. Pattern is overridden only if entry/stop is not reached
Failed - These are the patterns which are successfully formed. But, price failed to hit entry before hitting stop. Hence, these signals are not taken as trade.
Stopped - These are the signals where price successfully hit Entry. But, failed to reach any of the targets before hitting Stop or Trailing Stop (If Trail Start Stage is set to Entry)
Target(1-4) - These numbers imply number of trades which successfully hit the respective target level but failed to hit next target level (Except target 4 which is the last target level)
Close stats show numbers based on Bullish and Bearish signals generated. It also shows numbers based on the zigzag length and level 2 length.
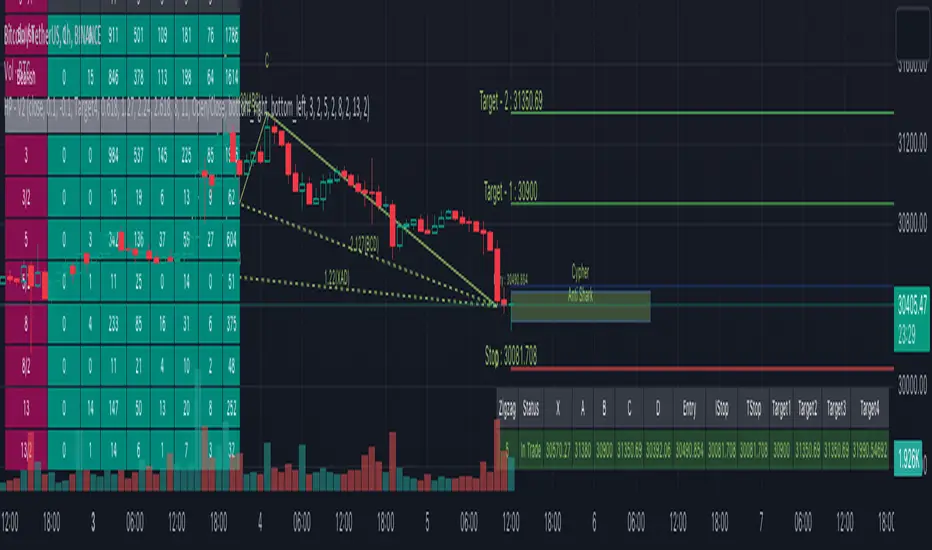
Pinescript - Common Label & Line Array Functions Library by RRBPinescript - Common Label & Line Array Functions Library by RagingRocketBull 2021
Version 1.0
This script provides a library of common array functions for arrays of label and line objects with live testing of all functions.
Using this library you can easily create, update, delete, join label/line object arrays, and get/set properties of individual label/line object array items.
You can find the full list of supported label/line array functions below.
There are several libraries:
- Common String Functions Library
- Standard Array Functions Library
- Common Fixed Type Array Functions Library
- Common Label & Line Array Functions Library
- Common Variable Type Array Functions Library
Features:
- 30 array functions in categories create/update/delete/join/get/set with support for both label/line objects (45+ including all implementations)
- Create, Update label/line object arrays from list/array params
- GET/SET properties of individual label/line array items by index
- Join label/line objects/arrays into a single string for output
- Supports User Input of x,y coords of 5 different types: abs/rel/rel%/inc/inc% list/array, auto transforms x,y input into list/array based on type, base and xloc, translates rel into abs bar indexes
- Supports User Input of lists with shortened names of string properties, auto expands all standard string properties to their full names for use in functions
- Live Output for all/selected functions based on User Input. Test any function for possible errors you may encounter before using in script.
- Output filters: hide all excluded and show only allowed functions using a list of function names
- Output Panel customization options: set custom style, color, text size, and line spacing
Usage:
- select create function - create label/line arrays from lists or arrays (optional). Doesn't affect the update functions. The only change in output should be function name regardless of the selected implementation.
- specify num_objects for both label/line arrays (default is 7)
- specify common anchor point settings x,y base/type for both label/line arrays and GET/SET items in Common Settings
- fill lists with items to use as inputs for create label/line array functions in Create Label/Line Arrays section
- specify label/line array item index and properties to SET in corresponding sections
- select label/line SET function to see the changes applied live
Code Structure:
- translate x,y depending on x,y type, base and xloc as specified in UI (required for all functions)
- expand all shortened standard property names to full names (required for create/update* from arrays and set* functions, not needed for create/update* from lists) to prevent errors in label.new and line.new
- create param arrays from string lists (required for create/update* from arrays and set* functions, not needed for create/update* from lists)
- create label/line array from string lists (property names are auto expanded) or param arrays (requires already expanded properties)
- update entire label/line array or
- get/set label/line array item properties by index
Transforming/Expanding Input values:
- for this script to work on any chart regardless of price/scale, all x*,y* are specified as % increase relative to x0,y0 base levels by default, but user can enter abs x,price values specific for that chart if necessary.
- all lists can be empty, contain 1 or several items, have the same/different lengths. Array Length = min(min(len(list*)), mum_objects) is used to create label/line objects. Missing list items are replaced with default property values.
- when a list contains only 1 item it is duplicated (label name/tooltip is also auto incremented) to match the calculated Array Length
- since this script processes user input, all x,y values must be translated to abs bar indexes before passing them to functions. Your script may provide all data internally and doesn't require this step.
- at first int x, float y arrays are created from user string lists, transformed as described below and returned as x,y arrays.
- translated x,y arrays can then be passed to create from arrays function or can be converted back to x,y string lists for the create from lists function if necessary.
- all translation logic is separated from create/update/set functions for the following reasons:
- to avoid redundant code/dependency on ext functions/reduce local scopes and to be able to translate everything only once in one place - should be faster
- to simplify internal logic of all functions
- because your script may provide all data internally without user input and won't need the translation step
- there are 5 types available for both x,y: abs, rel, rel%, inc, inc%. In addition to that, x can be: bar index or time, y is always price.
- abs - absolute bar index/time from start bar0 (x) or price (y) from 0, is >= 0
- rel - relative bar index/time from cur bar n (x) or price from y0 base level, is >= 0
- rel% - relative % increase of bar index/time (x) or price (y) from corresponding base level (x0 or y0), can be <=> 0
- inc - relative increment (step) for each new level of bar index/time (x) or price (y) from corresponding base level (x0 or y0), can be <=> 0
- inc% - relative % increment (% step) for each new level of bar index/time (x) or price (y) from corresponding base level (x0 or y0), can be <=> 0
- x base level >= 0
- y base level can be 0 (empty) or open, close, high, low of cur bar
- single item x1_list = "50" translates into:
- for x type abs: "50, 50, 50 ..." num_objects times regardless of xloc => x = 50
- for x type rel: "50, 50, 50 ... " num_objects times => x = x_base + 50
- for x type rel%: "50%, 50%, 50% ... " num_objects times => x_base * (1 + 0.5)
- for x type inc: "0, 50, 100 ... " num_objects times => x_base + 50 * i
- for x type inc%: "0%, 50%, 100% ... " num_objects times => x_base * (1 + 0.5 * i)
- when xloc = xloc.bar_index each rel*/inc* value in the above list is then subtracted from n: n - x to convert rel to abs bar index, values of abs type are not affected
- x1_list = "0, 50, 100, ..." of type rel is the same as "50" of type inc
- x1_list = "50, 50, 50, ..." of type abs/rel/rel% produces a sequence of the same values and can be shortened to just "50"
- single item y1_list = "2" translates into (ragardless of yloc):
- for y type abs: "2, 2, 2 ..." num_objects times => y = 2
- for y type rel: "2, 2, 2 ... " num_objects times => y = y_base + 2
- for y type rel%: "2%, 2%, 2% ... " num_objects times => y = y_base * (1 + 0.02)
- for y type inc: "0, 2, 4 ... " num_objects times => y = y_base + 2 * i
- for y type inc%: "0%, 2%, 4% ... " num_objects times => y = y_base * (1 + 0.02 * i)
- when yloc != yloc.price all calculated values above are simply ignored
- y1_list = "0, 2, 4" of type rel% is the same as "2" with type inc%
- y1_list = "2, 2, 2" of type abs/rel/rel% produces a sequence of the same values and can be shortened to just "2"
- you can enter shortened property names in lists. To lookup supported shortened names use corresponding dropdowns in Set Label/Line Array Item Properties sections
- all shortened standard property names must be expanded to full names (required for create/update* from arrays and set* functions, not needed for create/update* from lists) to prevent errors in label.new and line.new
- examples of shortened property names that can be used in lists: bar_index, large, solid, label_right, white, left, left, price
- expanded to their corresponding full names: xloc.bar_index, size.large, line.style_solid, label.style_label_right, color.white, text.align_left, extend.left, yloc.price
- all expanding logic is separated from create/update* from arrays and set* functions for the same reasons as above, and because param arrays already have different types, implying the use of final values.
- all expanding logic is included in the create/update* from lists functions because it seemed more natural to process string lists from user input directly inside the function, since they are already strings.
Creating Label/Line Objects:
- use study max_lines_count and max_labels_count params to increase the max number of label/line objects to 500 (+3) if necessary. Default number of label/line objects is 50 (+3)
- all functions use standard param sequence from methods in reference, except style always comes before colors.
- standard label/line.get* functions only return a few properties, you can't read style, color, width etc.
- label.new(na, na, "") will still create a label with x = n-301, y = NaN, text = "" because max default scope for a var is 300 bars back.
- there are 2 types of color na, label color requires color(na) instead of color_na to prevent error. text_color and line_color can be color_na
- for line to be visible both x1, x2 ends must be visible on screen, also when y1 == y2 => abs(x1 - x2) >= 2 bars => line is visible
- xloc.bar_index line uses abs x1, x2 indexes and can only be within 0 and n ends, where n <= 5000 bars (free accounts) or 10000 bars (paid accounts) limit, can't be plotted into the future
- xloc.bar_time line uses abs x1, x2 times, can't go past bar0 time but can continue past cur bar time into the future, doesn't have a length limit in bars.
- xloc.bar_time line with length = exact number of bars can be plotted only within bar0 and cur bar, can't be plotted into the future reliably because of future gaps due to sessions on some charts
- xloc.bar_index line can't be created on bar 0 with fixed length value because there's only 1 bar of horiz length
- it can be created on cur bar using fixed length x < n <= 5000 or
- created on bar0 using na and then assigned final x* values on cur bar using set_x*
- created on bar0 using n - fixed_length x and then updated on cur bar using set_x*, where n <= 5000
- default orientation of lines (for style_arrow* and extend) is from left to right (from bar 50 to bar 0), it reverses when x1 and x2 are swapped
- price is a function, not a line object property
Variable Type Arrays:
- you can't create an if/function that returns var type value/array - compiler uses strict types and doesn't allow that
- however you can assign array of any type to another array of any type creating an arr pointer of invalid type that must be reassigned to a matching array type before used in any expression to prevent error
- create_any_array2 uses this loophole to return an int_arr pointer of a var type array
- this works for all array types defined with/without var keyword and doesn't work for string arrays defined with var keyword for some reason
- you can't do this with var type vars, only var type arrays because arrays are pointers passed by reference, while vars are actual values passed by value.
- you can only pass a var type value/array param to a function if all functions inside support every type - otherwise error
- alternatively values of every type must be passed simultaneously and processed separately by corresponding if branches/functions supporting these particular types returning a common single type result
- get_var_types solves this problem by generating a list of dummy values of every possible type including the source type, tricking the compiler into allowing a single valid branch to execute without error, while ignoring all dummy results
Notes:
- uses Pinescript v3 Compatibility Framework
- uses Common String Functions Library, Common Fixed Type Array Functions Library, Common Variable Type Array Functions Library
- has to be a separate script to reduce the number of local scopes/compiled file size, can't be merged with another library.
- lets you live test all label/line array functions for errors. If you see an error - change params in UI
- if you see "Loop too long" error - hide/unhide or reattach the script
- if you see "Chart references too many candles" error - change x type or value between abs/rel*. This can happen on charts with 5000+ bars when a rel bar index x is passed to label.new or line.new instead of abs bar index n - x
- create/update_label/line_array* use string lists, while create/update_label/line_array_from_arrays* use array params to create label/line arrays. "from_lists" is dropped to shorten the names of the most commonly used functions.
- create_label/line_array2,4 are preferable, 5,6 are listed for pure demonstration purposes only - don't use them, they don't improve anything but dramatically increase local scopes/compiled file size
- for this reason you would mainly be using create/update_label/line_array2,4 for list params or create/update_label/line_array_from_arrays2 for array params
- all update functions are executed after each create as proof of work and can be disabled. Only create functions are required. Use update functions when necessary - when list/array params are changed by your script.
- both lists and array item properties use the same x,y_type, x,y_base from common settings
- doesn't use pagination, a single str contains all output
- why is this so complicated? What are all these functions for?
- this script merges standard label/line object methods with standard array functions to create a powerful set of label/line object array functions to simplify manipulation of these arrays.
- this library also extends the functionality of Common Variable Type Array Functions Library providing support for label/line types in var type array functions (any_to_str6, join_any_array5)
- creating arrays from either lists or arrays adds a level of flexibility that comes with complexity. It's very likely that in your script you'd have to deal with both string lists as input, and arrays internally, once everything is converted.
- processing user input, allowing customization and targeting for any chart adds a whole new layer of complexity, all inputs must be translated and expanded before used in functions.
- different function implementations can increase/reduce local scopes and compiled file size. Select a version that best suits your needs. Creating complex scripts often requires rewriting your code multiple times to fit the limits, every line matters.
P.S. Don't rely too much on labels, for too often they are fables.
List of functions*:
* - functions from other libraries are not listed
1. Join Functions
Labels
- join_label_object(label_, d1, d2)
- join_label_array(arr, d1, d2)
- join_label_array2(arr, d1, d2, d3)
Lines
- join_line_object(line_, d1, d2)
- join_line_array(arr, d1, d2)
- join_line_array2(arr, d1, d2, d3)
Any Type
- any_to_str6(arr, index, type)
- join_any_array4(arr, d1, d2, type)
- join_any_array5(arr, d, type)
2. GET/SET Functions
Labels
- label_array_get_text(arr, index)
- label_array_get_xy(arr, index)
- label_array_get_fields(arr, index)
- label_array_set_text(arr, index, str)
- label_array_set_xy(arr, index, x, y)
- label_array_set_fields(arr, index, x, y, str)
- label_array_set_all_fields(arr, index, x, y, str, xloc, yloc, label_style, label_color, text_color, text_size, text_align, tooltip)
- label_array_set_all_fields2(arr, index, x, y, str, xloc, yloc, label_style, label_color, text_color, text_size, text_align, tooltip)
Lines
- line_array_get_price(arr, index, bar)
- line_array_get_xy(arr, index)
- line_array_get_fields(arr, index)
- line_array_set_text(arr, index, width)
- line_array_set_xy(arr, index, x1, y1, x2, y2)
- line_array_set_fields(arr, index, x1, y1, x2, y2, width)
- line_array_set_all_fields(arr, index, x1, y1, x2, y2, xloc, extend, line_style, line_color, width)
- line_array_set_all_fields2(arr, index, x1, y1, x2, y2, xloc, extend, line_style, line_color, width)
3. Create/Update/Delete Functions
Labels
- delete_label_array(label_arr)
- create_label_array(list1, list2, list3, list4, list5, d)
- create_label_array2(x_list, y_list, str_list, xloc_list, yloc_list, style_list, color1_list, color2_list, size_list, align_list, tooltip_list, d)
- create_label_array3(x_list, y_list, str_list, xloc_list, yloc_list, style_list, color1_list, color2_list, size_list, align_list, tooltip_list, d)
- create_label_array4(x_list, y_list, str_list, xloc_list, yloc_list, style_list, color1_list, color2_list, size_list, align_list, tooltip_list, d)
- create_label_array5(x_list, y_list, str_list, xloc_list, yloc_list, style_list, color1_list, color2_list, size_list, align_list, tooltip_list, d)
- create_label_array6(x_list, y_list, str_list, xloc_list, yloc_list, style_list, color1_list, color2_list, size_list, align_list, tooltip_list, d)
- update_label_array2(label_arr, x_list, y_list, str_list, xloc_list, yloc_list, style_list, color1_list, color2_list, size_list, align_list, tooltip_list, d)
- update_label_array4(label_arr, x_list, y_list, str_list, xloc_list, yloc_list, style_list, color1_list, color2_list, size_list, align_list, tooltip_list, d)
- create_label_array_from_arrays2(x_arr, y_arr, str_arr, xloc_arr, yloc_arr, style_arr, color1_arr, color2_arr, size_arr, align_arr, tooltip_arr, d)
- create_label_array_from_arrays4(x_arr, y_arr, str_arr, xloc_arr, yloc_arr, style_arr, color1_arr, color2_arr, size_arr, align_arr, tooltip_arr, d)
- update_label_array_from_arrays2(label_arr, x_arr, y_arr, str_arr, xloc_arr, yloc_arr, style_arr, color1_arr, color2_arr, size_arr, align_arr, tooltip_arr, d)
Lines
- delete_line_array(line_arr)
- create_line_array(list1, list2, list3, list4, list5, list6, d)
- create_line_array2(x1_list, y1_list, x2_list, y2_list, xloc_list, extend_list, style_list, color_list, width_list, d)
- create_line_array3(x1_list, y1_list, x2_list, y2_list, xloc_list, extend_list, style_list, color_list, width_list, d)
- create_line_array4(x1_list, y1_list, x2_list, y2_list, xloc_list, extend_list, style_list, color_list, width_list, d)
- create_line_array5(x1_list, y1_list, x2_list, y2_list, xloc_list, extend_list, style_list, color_list, width_list, d)
- create_line_array6(x1_list, y1_list, x2_list, y2_list, xloc_list, extend_list, style_list, color_list, width_list, d)
- update_line_array2(line_arr, x1_list, y1_list, x2_list, y2_list, xloc_list, extend_list, style_list, color_list, width_list, d)
- update_line_array4(line_arr, x1_list, y1_list, x2_list, y2_list, xloc_list, extend_list, style_list, color_list, width_list, d)
- create_line_array_from_arrays2(x1_arr, y1_arr, x2_arr, y2_arr, xloc_arr, extend_arr, style_arr, color_arr, width_arr, d)
- update_line_array_from_arrays2(line_arr, x1_arr, y1_arr, x2_arr, y2_arr, xloc_arr, extend_arr, style_arr, color_arr, width_arr, d)

TradeChartist Volatility Trader ™TradeChartist Volatility Trader is a Price Volatility based Trend indicator that uses simple to visualize Volatility steps and a Volatility Ribbon to trade volatility breakouts and price action based on lookback length.
===================================================================================================================
Features of ™TradeChartist Volatility Trader
======================================
The Volatility steps consists of an Upper band, a Lower band and a Mean price line that are used for detecting the breakouts and also used in plotting the Volatility Ribbon based on the price action. The Mean Line is colour coded based on Bull/Bear Volatility and exhaustion based on Price action trend.
In addition to the system of Volatility Steps and Volatility Ribbon, ™TradeChartist Volatility Trader also plots Bull and Bear zones based on high probability volatility breakouts and divides the chart into Bull and Bear trade zones.
Use of External Filter is also possible by connecting an Oscillatory (like RSI, MACD, Stoch or any Oscillator) or a non-Oscillatory (Moving Average, Supertrend, any price scale based plots) Signal to confirm the Bull and Bear Trade zones. When the indicator detects the Volatility breakouts, it also checks if the connected external signal agrees with the trend before generating the Bull/Bear entries and plotting the trade zones.
Alerts can be created for Long and Short entries using Once per bar close .
===================================================================================================================
Note:
Higher the lookback length, higher the Risk/Reward from the trade zones.
This indicator does not repaint , but on the alert creation, a potential repaint warning would appear as the script uses security function. Users need not worry as this is normal on scripts that employs security functions. For trust and confidence using the indicator, users can do bar replay to check the plots/trade entries time stamps to make sure the plots and entries stay in the same place.
™TradeChartist Volatility Trader can be connected to ™TradeChartist Plug and Trade to generate Trade Entries, Targets etc by connecting Volatility Trader's Trend Identifier as Oscillatory Signal to Plug and Trade.
===================================================================================================================
Best Practice: Test with different settings first using Paper Trades before trading with real money
===================================================================================================================
This is not a free to use indicator. Get in touch with me (PM me directly if you would like trial access to test the indicator)
Premium Scripts - Trial access and Information
Trial access offered on all Premium scripts.
PM me directly to request trial access to the scripts or for more information.
===================================================================================================================
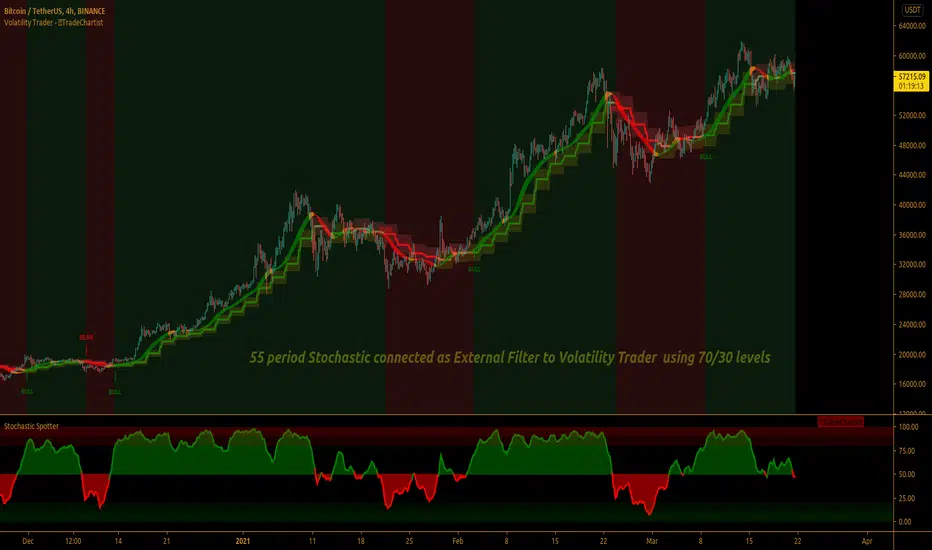
TFi Pivot Reversal V3The Pivot Reversal Study uses pivot points to create a support and resistance level; based on this levels the script creates virtual stop-market orders to catch the trend if the price is crossing the pivot lines.
A "Pyramiding" input allows to configure up to 3 entries; the script enters an additional position if the price falls by a configurable percentage amount (long), the reverse to short orders.
A configurable profit-target and stop-loss is being used to exit an open position.
An optional Moving Average filter can be used to enable only long or short positions.
The script renders a status box at the last bar, which shows the current position status and result of the built-in trading simulation results.
It shows the following statistic values:
current position PnL - also background turns green if position is in profit and red if in loss
the percentage distance to the profit-target and stop-loss level
the overall number of wins and losses and the win/loss ratio
the overall profit and loss amount (assuming a quantity of 1)
the net-profit and profit-ratio
For the correct simulation of entry/exit prices, the script contains inputs for a percentage entry and exit slippage.
The study also creates configurable alerts, which follow the exact position of the entry/exit markers. The default alert messages contain trading instruction to execute orders via Alertatron; but the message content can be replaced if configuring the alert in the Tradingview environment.
The script was mainly backtested with crypto-coins, e.g. XBTUSD at 15min timeframe. But the script also works with any other type of security and timeframe.
How to access
This strategy is a "Invite Only" script. You can can subscribe or purchase the strategy; please use the link below or send me a message via Tradingview to obtain access to the strategy and study script.
For enabling the script in your Tradingview chart window, click on "Indicators" and select "Invite-Only Scripts".
Full list of alerts
'Alertatron Exit' ... Exit all open positions.
'Alertatron Enter Long' ... Enter long position, w/o stop-loss being used.
'Alertatron Enter Short' ... Enter short position, w/o stop-loss being used.
'Alertatron Enter Long SL' ... Enter long position, w/ stop-loss being used.
'Alertatron Enter Short SL' ... Enter short position, w/ stop-loss being used.
Full list of parameters
"Pivot Left Bars" ... Number of bars on the left of the pivot point - used for pivot /peak detection.
"Pivot Right Bars" ... Number of bars on the right of the pivot point - used for pivot /peak detection.
"MA Filter Fast" ... Moving Average filter fast period.
"MA Filter Slow" ... Moving Average filter slow period.
"Profit Target Option" ... Configure the profit-target either as a fix percentage value or an ATR.
"Profit Target " ... Fix percentage profit-target.
"Profit ATR Period" ... ATR profit-target period.
"Profit ATR Factor" ... ATR profit-target factor/multiplier.
"Stop Loss Option" ... Configure the stop-loss either as a fix percentage value or disable the stop-loss completely.
"Stop Loss " ... Fix percentage stop-loss.
"Rebuy Loss " ... Percentage loss of the initial position before script enter a nw position in the same direction.
"Pyramiding" ... Maximum number of positions.
"Show MA Plots" ... Show/hide Moving average plots.
"Slippage Entry " ... Percentage slippage for entering a position.
"Slippage Exit " ... Percentage slippage for exiting a position.
"Statistic Label" ... Defines the position of the statistic label relatively to the last bar in the chart.
"Backtest Start" ... Backtest start time; area outside this timeframe will be grayed out.
"Backtest Stop" ... Backtest stop time; area outside this timeframe will be grayed out.
"Backtest Mode" ... Closes the currently opened position if chart switches to last bar; please only enable if backtesting, otherwise it leads to unwanted alerts.
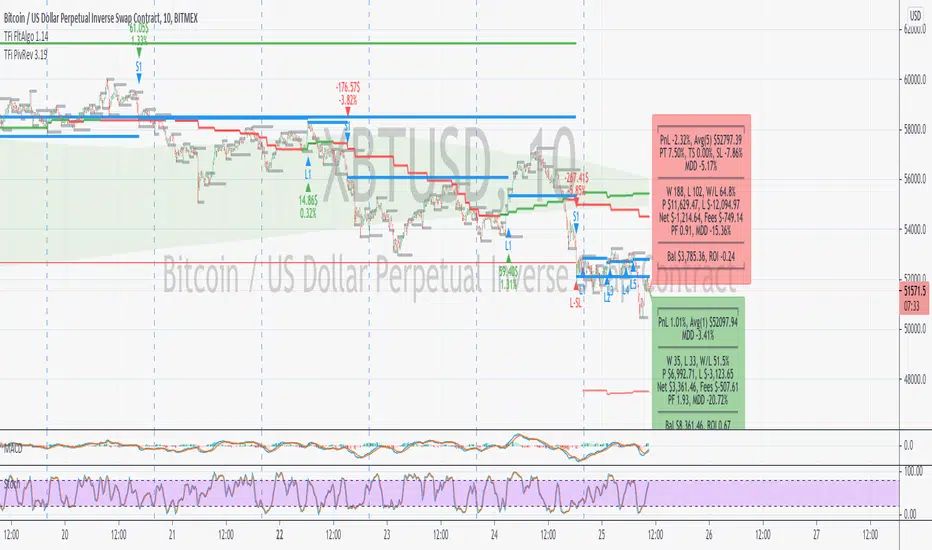
TradeChartist Tracker™𝗧𝗿𝗮𝗱𝗲𝗖𝗵𝗮𝗿𝘁𝗶𝘀𝘁 𝗧𝗿𝗮𝗰𝗸𝗲𝗿 is an essential real-time multi Indicator tracking toolkit that can be plotted as a standalone Indicator plot, a multi symbol tracker/screener for upto 10 different symbols and a visual scorecard for upto 5 different symbols. The indicators included in the tracker are Stochastic Oscillator, RSI, CCI, 15 different Moving Averages, MACD, Bollinger Bands %B (including Bollinger Bands and Breakout Signals), Ichimoku Cloud (including Breakout signals), Donchian Channels Oscillator (including Donchian Channels and Breakout Signals), Net Volume and Heikin Ashi Trend.
===================================================================================================================
™𝗧𝗿𝗮𝗱𝗲𝗖𝗵𝗮𝗿𝘁𝗶𝘀𝘁 𝗧𝗿𝗮𝗰𝗸𝗲𝗿 𝗨𝘀𝗲𝗿 𝗠𝗮𝗻𝘂𝗮𝗹
=====================================
™TradeChartist Tracker Plot Types
==============================
1. Indicator plot of Chart Symbol on its own , chosen from the 𝗜𝗻𝗱𝗶𝗰𝗮𝘁𝗼𝗿 𝗧𝘆𝗽𝗲 dropdown, enabling 𝐃𝐢𝐬𝐩𝐥𝐚𝐲 𝐈𝐧𝐝𝐢𝐜𝐚𝐭𝐨𝐫 𝐏𝐥𝐨𝐭 (𝐝𝐢𝐬𝐚𝐛𝐥𝐞𝐬 𝐓𝐫𝐚𝐜𝐤𝐞𝐫/𝐒𝐜𝐨𝐫𝐞𝐜𝐚𝐫𝐝).
In this example Daily chart of XRP-USDT, 55 period Stochastic is tracked for the chart symbol XRP-USDT.
2. Indicator plot of a Symbol different from the Chart Symbol , chosen from the 𝗜𝗻𝗱𝗶𝗰𝗮𝘁𝗼𝗿 𝗧𝘆𝗽𝗲 dropdown by enabling Tʀᴀᴄᴋ ᴀɴᴏᴛʜᴇʀ Sʏᴍʙᴏʟ's Iɴᴅɪᴄᴀᴛᴏʀ and entering the symbol name in the Sʏᴍʙᴏʟ ᴛᴏ Tʀᴀᴄᴋ input box, whilst keeping 𝐃𝐢𝐬𝐩𝐥𝐚𝐲 𝐈𝐧𝐝𝐢𝐜𝐚𝐭𝐨𝐫 𝐏𝐥𝐨𝐭 (𝐝𝐢𝐬𝐚𝐛𝐥𝐞𝐬 𝐓𝐫𝐚𝐜𝐤𝐞𝐫/𝐒𝐜𝐨𝐫𝐞𝐜𝐚𝐫𝐝) enabled.
In this example Daily chart of XRP-USDT, 55 period Stochastic is tracked for the BTC-USD (different from chart symbol XRP-USDT).
3. Tracker Plot of up to 10 Multiple Symbol Trackers for the Indicator chosen from the 𝗜𝗻𝗱𝗶𝗰𝗮𝘁𝗼𝗿 𝗧𝘆𝗽𝗲 dropdown, by disabling 𝐃𝐢𝐬𝐩𝐥𝐚𝐲 𝐈𝐧𝐝𝐢𝐜𝐚𝐭𝐨𝐫 𝐏𝐥𝐨𝐭 (𝐝𝐢𝐬𝐚𝐛𝐥𝐞𝐬 𝐓𝐫𝐚𝐜𝐤𝐞𝐫/𝐒𝐜𝐨𝐫𝐞𝐜𝐚𝐫𝐝) and by entering the number of trackers required in the 𝐍𝐮𝐦𝐛𝐞𝐫 𝐨𝐟 𝐓𝐫𝐚𝐜𝐤𝐞𝐫𝐬 input box under 𝗧𝗿𝗮𝗰𝗸𝗲𝗿 𝗣𝗹𝗼𝘁𝘀 section. Upto 10 Symbols can be tracked and can be input by the user in the input boxes from Sʏᴍʙᴏʟ 1,...Sʏᴍʙᴏʟ 10 . 𝐃𝐢𝐬𝐩𝐥𝐚𝐲 𝐈𝐧𝐝𝐢𝐜𝐚𝐭𝐨𝐫 𝐏𝐥𝐨𝐭 (𝐝𝐢𝐬𝐚𝐛𝐥𝐞𝐬 𝐓𝐫𝐚𝐜𝐤𝐞𝐫/𝐒𝐜𝐨𝐫𝐞𝐜𝐚𝐫𝐝) must be disabled for this plot type.
In this example Daily chart of Crypto Total Market Cap, Bollinger Bands %B is tracked for the chart symbol + 10 other Crypto symbols using Multi Symbol Trackers
4. Visual Scorecards of up to 5 Symbols for 8 indicators (all except Net Volume and HA Trend) can be plotted with real-time data by enabling 𝗗𝗶𝘀𝗽𝗹𝗮𝘆 𝗩𝗶𝘀𝘂𝗮𝗹 𝗦𝗰𝗼𝗿𝗲𝗰𝗮𝗿𝗱 - (𝟓 𝐓𝐫𝐚𝐜𝐤𝐞𝐫𝐬 𝐋𝐢𝐦𝐢𝐭). 𝐃𝐢𝐬𝐩𝐥𝐚𝐲 𝐈𝐧𝐝𝐢𝐜𝐚𝐭𝐨𝐫 𝐏𝐥𝐨𝐭 (𝐝𝐢𝐬𝐚𝐛𝐥𝐞𝐬 𝐓𝐫𝐚𝐜𝐤𝐞𝐫/𝐒𝐜𝐨𝐫𝐞𝐜𝐚𝐫𝐝) must be disabled for this plot type.
For the same example Daily chart of Crypto Total Market Cap as above, Visual Scorecard is plotted for 5 Symbols as shown.
5. Indicator Tracker labels can be plotted on Price chart by overlaying the Tracker on main chart and by switching from Separate Tracker Pane - Default to Tracker Labels only on Price Scale in the Lᴀʙᴇʟs Dɪsᴘʟᴀʏ Tʏᴘᴇ dropdown box.
In this example chart of 1hr XLM-USDT, Tracker labels of 55 EMA are plotted for 10 different symbols along with the 55 EMA plot of XLM-USDT.
Indicator plot that doesn't fit on price scale can be visualised using a second Tracker added to chart as shown in the ETH-USDT example below tracking Net Volume.
===================================================================================================================
𝗜𝗻𝗱𝗶𝗰𝗮𝘁𝗼𝗿𝘀 𝗜𝗻𝗰𝗹𝘂𝗱𝗲𝗱 𝗶𝗻 ™𝗧𝗿𝗮𝗱𝗲𝗖𝗵𝗮𝗿𝘁𝗶𝘀𝘁 𝗧𝗿𝗮𝗰𝗸𝗲𝗿
==============================================
1. Stochastic Oscillator
2. RSI
3. CCI
4. MA - (15 types included)
5. MACD
6. Bollinger Bands %B + Optional plots of Bollinger Bands and Breakout Signals
7. Ichimoku Cloud Oscillator + Optional plots of Ichimoku Cloud and Breakout Signals
8. Donchian Channels + Optional plots of Donchian Channels and Breakout Signals
9. Net Volume
10. Heikin Ashi Trend
All of the above indicators can be plotted as independent plots of the Chart Symbol or of a different symbol by enabling 𝐃𝐢𝐬𝐩𝐥𝐚𝐲 𝐈𝐧𝐝𝐢𝐜𝐚𝐭𝐨𝐫 𝐏𝐥𝐨𝐭 (𝐝𝐢𝐬𝐚𝐛𝐥𝐞𝐬 𝐓𝐫𝐚𝐜𝐤𝐞𝐫/𝐒𝐜𝐨𝐫𝐞𝐜𝐚𝐫𝐝). Some Oscillators have the option of Pʟᴏᴛ Sᴛʏʟᴇ under their relevant sections, and can be plotted as line, area or a histogram.
Oscillators 1-8 (except 4) require source price, lookback length and smoothing (where available) for the indicator plot. The colour of the tracker blocks is based on the Upper/Lower bands (where available), specified by the user in the respective sections. For example, if the RSI indicator is chosen to be plotted with Upper band at 60 and Lower band at 40, the tracker blocks and the Indicator plot paint the values between 40 and 60 in neutral colour which can be changed from the settings.
Multi Window BTC-USDT 1hr example chart below with various indicators from ™TradeChartist Tracker.
Note: The tracker colour is exactly colour of the Indicator Plot. The Visual Scorecard , however uses the mid values and doesn't take into account the bands specified by the user. For example, RSI score is green on the Visual Scorecard as long as RSI is above 50 and doesn't get affected by the user specified upper/lower band and this applies to all Oscillators. This is shown in the 1hr BTC-USDT chart below.
Moving Averages (MA) and MACD
------------------------------------------------------
Tracker plots and tracks one of 15 Moving Averages that can be chosen from the MA ᴛʏᴘᴇ and by specifying the MA Lᴇɴɢᴛʜ .
MACD uses EMA as default for calculating the MACD plots and Tracker data using Fᴀsᴛ Lᴇɴɢᴛʜ , Sʟᴏᴡ Lᴇɴɢᴛʜ and Sᴍᴏᴏᴛʜɪɴɢ . To experiment or use a different Moving Average to calculate MACD, disable 𝐔𝐬𝐞 𝐄𝐌𝐀 (Uɴᴄʜᴇᴄᴋ ᴛᴏ ᴜsᴇ MA ғʀᴏᴍ ᴀʙᴏᴠᴇ) and select the required Moving Average from MA ᴛʏᴘᴇ drop down of the 𝟰. 𝗠𝗼𝘃𝗶𝗻𝗴 𝗔𝘃𝗲𝗿𝗮𝗴𝗲 section.
Bollinger Bands %B + Optional plots of Bollinger Bands and Breakout Signals
---------------------------------------------------------------------------------------------------------------------------
Bollinger Bands %B is a companion oscillator for Bollinger Bands and helps depict where the price is, in relation to the Bollinger Bands. To plot the actual Bollinger Bands, enable Dɪsᴘʟᴀʏ Bᴏʟʟɪɴɢᴇʀ Bᴀɴᴅs and to plot the Bollinger Bands Breakout Signals, enable Sʜᴏᴡ BB Bʀᴇᴀᴋᴏᴜᴛ Sɪɢɴᴀʟs , with 𝐃𝐢𝐬𝐩𝐥𝐚𝐲 𝐈𝐧𝐝𝐢𝐜𝐚𝐭𝐨𝐫 𝐏𝐥𝐨𝐭 (𝐝𝐢𝐬𝐚𝐛𝐥𝐞𝐬 𝐓𝐫𝐚𝐜𝐤𝐞𝐫/𝐒𝐜𝐨𝐫𝐞𝐜𝐚𝐫𝐝) enabled.
Ichimoku Cloud Oscillator + Optional plots of Ichimoku Cloud and Breakout Signals
------------------------------------------------------------------------------------------------------------------------------------
Ichimoku Cloud Oscillator helps visualize the current price in relation to the breakout support/resistance of the Ichimoku Cloud using strict Ichimoku Cloud criteria (including Chikou Span agreeing with the breakout etc.). To plot the actual Ichimoku Cloud, enable Dɪsᴘʟᴀʏ Iᴄʜɪᴍᴏᴋᴜ Cʟᴏᴜᴅ and to plot the Kumo Breakout Signals, enable Sʜᴏᴡ Kᴜᴍᴏ Bʀᴇᴀᴋᴏᴜᴛ Sɪɢɴᴀʟs , with 𝐃𝐢𝐬𝐩𝐥𝐚𝐲 𝐈𝐧𝐝𝐢𝐜𝐚𝐭𝐨𝐫 𝐏𝐥𝐨𝐭 (𝐝𝐢𝐬𝐚𝐛𝐥𝐞𝐬 𝐓𝐫𝐚𝐜𝐤𝐞𝐫/𝐒𝐜𝐨𝐫𝐞𝐜𝐚𝐫𝐝) enabled.
Cloud Settings form the fundamental factor for this indicator to detect the breakouts. The settings for the Ichimoku Cloud is Automatic (detects right settings for the symbol type) by default, but this can be changed to Classic or 24/7 Crypto , based on the user preference from the settings under 𝐂𝐥𝐨𝐮𝐝 𝐓𝐲𝐩𝐞, which also includes a manual input option. Ichimoku traders can experiment different settings combinations under manual settings to suit their trading frequency and timeframe traded.
Donchian Channels + Optional plots of Donchian Channels and Breakout Signals
-------------------------------------------------------------------------------------------------------------------------------
Donchian Channels comprises of three plots - a upper band, a lower band and a mean line (or mid line of the channel). The upper band is based on highest high of N periods specified by the user and the lower band is based on the lowest low of N periods specified by the user. These channels help spot price breaching high or low of last N periods clearly, thereby aiding the trader to understand the price action of any symbol better on any given timeframe.
Donchian Channels Oscillator helps visualize the current price in relation to the Mean line of the Donchian Channels of user specified lookback period (specified in the Dᴏɴᴄʜɪᴀɴ Cʜᴀɴɴᴇʟ Lᴇɴɢᴛʜ input box). The sensitivity of the oscillator can be adjusted using smoothing factor in the Sᴍᴏᴏᴛʜɪɴɢ input box. To plot the actual Donchian Channels, enable Dɪsᴘʟᴀʏ Dᴏɴᴄʜɪᴀɴ Cʜᴀɴɴᴇʟs and to plot the Donchian Channels Breakout Signals, enable Sʜᴏᴡ DC Bʀᴇᴀᴋᴏᴜᴛ Sɪɢɴᴀʟs , with 𝐃𝐢𝐬𝐩𝐥𝐚𝐲 𝐈𝐧𝐝𝐢𝐜𝐚𝐭𝐨𝐫 𝐏𝐥𝐨𝐭 (𝐝𝐢𝐬𝐚𝐛𝐥𝐞𝐬 𝐓𝐫𝐚𝐜𝐤𝐞𝐫/𝐒𝐜𝐨𝐫𝐞𝐜𝐚𝐫𝐝) enabled.
Note: Using smoothing factor more than 1 doesn't reflect the actual Donchian Channels Mean line and also impacts the Tracker block colours.
Net Volume and Heikin Ashi Trend
-------------------------------------------------------
Net Volume and Heikin Ashi Trend can be tracked and plotted for up to 10 symbols in addition to the chart symbol, but both Net Volume and Heikin Ashi Trend are not included in the Visual Scorecard. Since the colour of the Net Volume depends on candle being bullish or bearish, it can help the user visualize if the current candle close of the symbol tracked is above or below the symbols's candle open.
Note: Bar Replay doesn't update the bar by bar indicator plot for historic bars for symbols other than the chart symbol. However, the Indicator Plot is perfectly usable for the realtime bar as data updates for both the Trackers and the Scorecard in realtime.
===================================================================================================================
𝗩𝗶𝘀𝘂𝗮𝗹 𝗦𝗰𝗼𝗿𝗲𝗰𝗮𝗿𝗱
=================
Visual Scorecard plots a green Bull or a red Bear Score colour plot for each Indicator from RSI to Donchian Channels Oscillator against every symbol tracked for up to 5 symbols max (First 5 symbols under 𝗧𝗿𝗮𝗰𝗸𝗲𝗿 𝗣𝗹𝗼𝘁𝘀 section). The gap between the scores can be adjusted using gap factor under Gᴀᴘ Fᴀᴄᴛᴏʀ ʙᴇᴛᴡᴇᴇɴ Sᴄᴏʀᴇs dropdown.
Visual Scorecard scoring method
----------------------------------------------------
RSI > 50 - 🟢
RSI < 50 - 🔴
Stoch > 50 - 🟢
Stoch < 50 - 🔴
CCI > 0 - 🟢
CCI < 0 - 🔴
Close price above MA plot - 🟢
Close price below MA plot - 🔴
MACD > 0 - 🟢
MACD < 0 - 🔴
Bollinger Bands %B > 50 - 🟢
Bollinger Bands %B < 50 - 🔴
Ichimoku Bullish Kumo Trend - 🟢
Ichimoku Bearish Kumo Trend - 🔴
Donchian Channels Oscillator > 0 (or close price above DC Mean Line) - 🟢
Donchian Channels Oscillator < 0 (or close price below DC Mean Line) - 🔴
Note: Bar Replay doesn't update the bar by bar scores/tracker data for historic bars for symbols other than the chart symbol. However, the Scorecard is perfectly usable for the realtime bar as data updates for both the Trackers and the Scorecard in realtime.
===================================================================================================================
𝗠𝘂𝗹𝘁𝗶 𝗦𝘆𝗺𝗯𝗼𝗹 𝗧𝗿𝗮𝗰𝗸𝗲𝗿𝘀/𝗟𝗮𝗯𝗲𝗹𝘀
=============================
Multi Symbol Tracker blocks continuously track the real-time indicator data of up to 10 symbols (in addition to the chart symbol) based on the number of Symbol Trackers preferred in the 𝐍𝐮𝐦𝐛𝐞𝐫 𝐨𝐟 𝐒𝐲𝐦𝐛𝐨𝐥 𝐓𝐫𝐚𝐜𝐤𝐞𝐫𝐬 (𝟎-𝟏𝟎) input box under the 𝗧𝗿𝗮𝗰𝗸𝗲𝗿 𝗣𝗹𝗼𝘁𝘀 section, and plots Bull, Bear and Neutral colour coded blocks based on both the indicator selected and settings preferred by the user under the relevant indicator section.
Multi Symbol Tracker Labels also continuously track the real-time indicator data in addition to the last close price (if 𝐒𝐡𝐨𝐰 𝐏𝐫𝐢𝐜𝐞 is enabled under 𝗧𝗿𝗮𝗰𝗸𝗲𝗿 𝗣𝗹𝗼𝘁𝘀 section), which helps user see the real-time changes in the indicator values and price changes of the symbols tracked.
The Tracker Label colours are exactly the same as the Tracker Block colours and are filtered based on the user preferred bands on the Oscillator values. This is slightly different to the Visual Scorecard Colour coding as the range between the user preferred bands is colour coded in a neutral colour, whereas the Scorecard uses only Bull and Bear Colours as explained in the 𝗩𝗶𝘀𝘂𝗮𝗹 𝗦𝗰𝗼𝗿𝗲𝗰𝗮𝗿𝗱 heading above. For example, if the user prefers RSI upper band of 60 and lower band of 40, the range between the values of 40 and 60 will be colour coded in neutral colour which can be changed from the 𝗨𝘀𝗲𝗳𝘂𝗹 𝗘𝘅𝘁𝗿𝗮𝘀 section of the indicator settings.
Note 1: Default settings are based on the Oscillator mid values and hence the Tracker Blocks match with the Visual Scorecard colour codes. Using Upper and Lower bands for oscillators help spot the oversold and overbought zones and also helps spot breakout threshold based on Indicator values specified by the user. Example chart with visual depiction below using RSI.
Note 2: Bar Replay doesn't update the bar by bar scores/tracker data for historic bars for symbols other than the chart symbol. However, the Tracker blocks/labels are perfectly usable for the realtime bar as data updates for both the Trackers and the Scorecard in realtime.
===================================================================================================================
Frequently Asked Questions
========================
Q: When I load the ™TradeChartist Tracker, why are the values in the labels blurred sometimes?
A: This happens occasionally as shown in the chart below, when the script is loaded for the first time or when a different setting is used.
To resolve this, just hide and unhide the script using the 👁 next to the Indicator title. If it is not visible, just hover the mouse/crosshair over the Indicator Title and it will be visible.
Q: Why does the indicator plot, tracker blocks and labels of Symbols being tracked, not update when I use Bar Replay?
A: As explained in the relevant sections above, historic data for bars and indicators other than chart symbol doesn't update on bar replay. But the chart symbol data does update for every bar on bar replay. This doesn't affect the real-time values and block colours for the symbols tracked.
Q: Can I track real-time values of a currently trading symbol when I'm on a symbol chart that is inactive? For example, can I see labels with real-time BTC values on a Sunday when I'm on a SPX chart when its not in session?
A: Simple answer is no. This is because, the plots are based on bar times of the chart and the symbols are tracked based on the bar time. So if the SPX session ended on Friday, the last known value of the BTC labels will be from Friday and hence it is always recommended to track symbols from a symbol chart that is in session.
Q: Does ™TradeChartist Tracker repaint?
A: This indicator doesn't repaint but it is not recommended to trade a different symbol from the chart based on the real-time data alone without checking if the current symbol chart is in session as inactive price chart will not have updated data on symbols tracked. Also, bar replay doesn't work on data pulled from external symbol data than the chart symbol, but signals confirmed at candle close and confirmed by Tracker blocks with appropriate colour code will be in agreement with the respective indicator and can be double checked for building trust and confidence on the indicator.
Q: Can ™TradeChartist Tracker be connected to other indicators as external source?
A: Yes. ™TradeChartist Tracker can be connected to another script and there are several use cases in doing so. A couple of examples are shown below.
1. ™TradeChartist Tracker 's Bollinger Bands %B 𝗜𝗻𝗱𝗶𝗰𝗮𝘁𝗼𝗿 𝗣𝗹𝗼𝘁 connected to ™TradeChartist Plotter to plot Divergences on the 4hr XAU-USD main price chart.
2. ™TradeChartist Tracker 's 𝐁𝐫𝐞𝐚𝐤𝐨𝐮𝐭 𝐓𝐫𝐞𝐧𝐝 𝐈𝐝𝐞𝐧𝐭𝐢𝐟𝐢𝐞𝐫 connected to ™TradeChartist Plug and Trade as Oscillatory Signal with 0/0 to generate trade signals with Targets and performance information on trades.
More Example Charts
==================
===================================================================================================================
Best Practice: Test with different settings first using Paper Trades before trading with real money
===================================================================================================================
This is not a free to use indicator. Get in touch with me (PM me directly if you would like trial access to test the indicator)
Premium Scripts - Trial access and Information
Trial access offered on all Premium scripts.
PM me directly to request trial access to the scripts or for more information.
===================================================================================================================
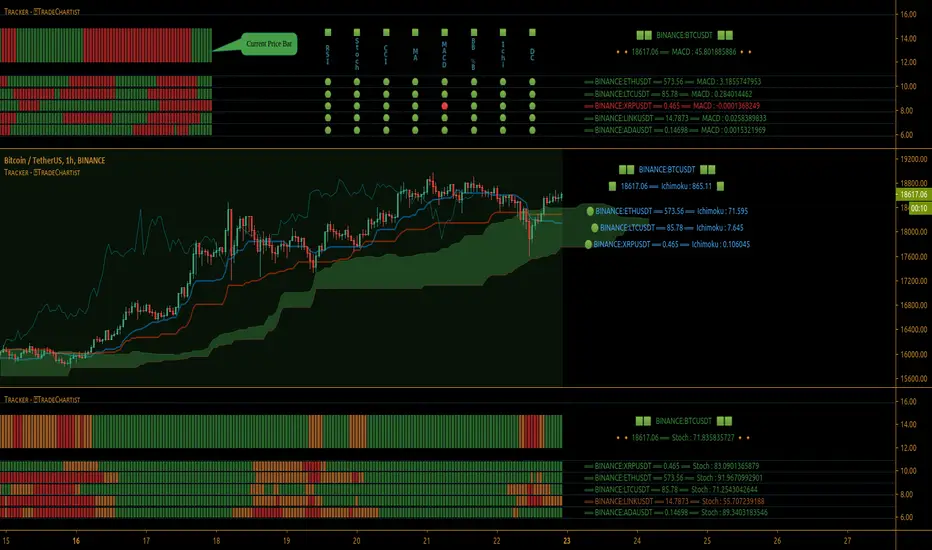
Malaysia Structured Warrants (Local Equities) ScreenerThis is an indicator script that showed the various performance of numerous companies call/put warrants that was issued by investment bank and institutions with limited numbers of warrants showed within the script.
This script was built to monitor and observe the past and current trend on all of the call/put warrants linked securities listed in Bursa Malaysia in term of the premium percentage , gearing ratio , unit price , periodic volume and time to maturity (still under process).
Besides, it was built to utilize users time to review the basic data regarding with those call/put warrants as the script will show numbers of them instead of requiring changing on graph to observe each basic data.
To simplify it , it is somehow like the KLSE Screener Warrant Side but this script has all the previous records and data that can be view in glance and download in the format of CSV (only in premium account).
To example used is UWC , but this script can apply to any malaysia stock that have the call warrants (like SUPERMX , MYEG , MI, FGV ,TOPGLOV and etc.)
It is still a prototype and manual update with newly issued of call/put warrants are required to add within this script time by time. There are also few technical issues regarding with this scripts as the labels are most times which i have contact with the customer service regarding this problem.
Overall, I speak as the author and copyright owner of this scripts, this script wouldn’t update by itself when new relevant structured warrants are issued but the update should provide based on my personal time planning.
Author : J.L.Z.H
You are free to leave your tradingview id below if you like to have a few days of access permission.