GARCH Range PredictorThis was inspired by deltatrendtrading's video on GARCH models to predict daily trading ranges and identify favorable trading conditions. Based on advanced volatility forecasting techniques, it predicts whether a trading day's true range will exceed a threshold, helping traders decide when to trade or skip a session.
Key Features
GARCH(1,1) Volatility Modeling: Uses log-transformed true ranges with exponential moving average centering
Forward-Looking Predictions: Makes predictions at session start before the day unfolds
Dynamic or Static Thresholds: Choose between fixed dollar thresholds or adaptive 20-day averages
Accuracy Tracking: Monitors prediction accuracy with overall and recent (20-day) hit rates
Visual Session Boxes: Colors trading sessions green (trade) or red (skip) based on predictions
Real-Time Statistics: Displays current predictions, thresholds, and performance metrics
How It Works
Data Transformation: Log-transforms daily true ranges and centers them using an EMA
Variance Modeling: Updates GARCH variance using: σ²ₜ = ω + α(residual²) + β(σ²ₜ₋₁)
Prediction Generation: Back-transforms log predictions to dollar values
Signal Generation: Compares predictions to threshold to generate trade/skip signals
Performance Tracking: Validates predictions against actual outcomes
Parameters
GARCH Parameters (ω, α, β): Control volatility persistence and mean reversion
EMA Period: Smoothing period for log range centering
Threshold Settings: Static dollar amount or dynamic multiplier of recent averages
Session Time: Define regular trading hours for analysis
Best Use Cases
Breakout and momentum strategies that perform better on high-range days
Risk management by avoiding low-volatility sessions
Futures day trading (optimized for MNQ/NQ detection)
Any strategy where daily range impacts profitability
Important Notes
Requires 5+ sessions for initialization and warm-up
Accuracy depends heavily on proper parameter tuning for your specific instrument
Default parameters may need adjustment for different markets
Monitor the hit rate to validate effectiveness on your timeframe
스크립트에서 "session"에 대해 찾기

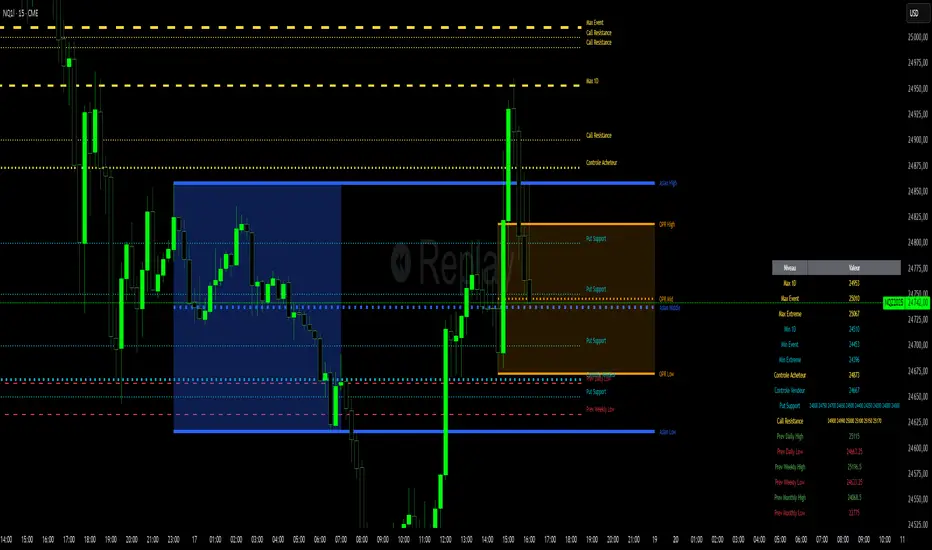
Niv Deal + Previ D W M + OPR + Asian🧭 Indicator Description (English)
Name: Niveaux Dealers + Previous D/W/M Auto + OPR + Asian Session
Platform: TradingView (Pine Script v6)
Type: Multi-module visual indicator for market structure and session ranges
🧩 Overview
This indicator combines three complementary modules to help traders visualize key market levels, opening ranges, and session dynamics — all in one comprehensive tool.
It is designed primarily for index and futures trading (e.g. NQ, ES, DAX), but can be applied to any market or timeframe.
MODULE 1 — Dealers Levels + Previous High/Low (Auto)
This first module automatically extracts and plots custom Dealer Levels and Previous Period Levels.
It can parse manually entered price levels (from a single text input) such as daily max/min, control levels, put supports, and call resistances — then draw horizontal lines and labels on the chart.
Features:
One text input for all dealer levels (easy copy-paste format).
Automatic parsing of prices from text (ignores irrelevant characters).
Groups of levels:
Maxima (Max 1D / Event / Extreme)
Minima (Min 1D / Event / Extreme)
Buyer/Seller Controls
Put Supports and Call Resistances
Independent color, style, and width for each line.
Transparent rectangular labels positioned perfectly on the levels.
Previous Daily, Weekly, and Monthly High/Low levels added automatically.
Optional summary table showing all levels and values in real time.
MODULE 2 — OPR (Opening Price Range)
The second module highlights the Opening Price Range, defined by the first 15 minutes (or any chosen period) of the trading session.
Features:
Fully configurable start and end time (local chart timezone).
Displays:
High, Low, and Midline (median)
Optional rectangle between high/low
Optional labels on each line
Independent color, line style, and thickness.
Works perfectly with non-standard sessions (e.g. 13:30–22:00 UTC for U.S. futures).
Uses local chart time instead of exchange time for intuitive control.
MODULE 3 — Asian Session Range
The third module draws the Asian trading session range, automatically detecting price action between configurable hours (default 17:00 → 01:00).
Features:
Adjustable start and end time (supports overnight sessions).
Plots Asian High, Asian Low, and Asian Middle (mid-range line).
Highlights the Asian box area with semi-transparent color.
Optional labels at the end of each level.
Fully synchronized with the chart’s local timezone (same logic as OPR).
Simple toggle to enable or disable the entire Asian module.
⚙️ Customization & Display
Each module can be toggled independently.
Colors, line styles (solid, dashed, dotted), and thickness are customizable.
Label visibility and extensions (left/right) can be adjusted.
The indicator is lightweight and optimized for real-time performance.
💡 Use Case
Traders can use this multi-module setup to:
Identify dealer reaction zones and institutional levels.
Track previous highs/lows for potential liquidity sweeps.
Monitor session ranges (Opening and Asian) for volatility shifts.
Combine all three perspectives (Dealer, Session, Historical) into one unified view.
Would you like me to rewrite this description in TradingView publication form
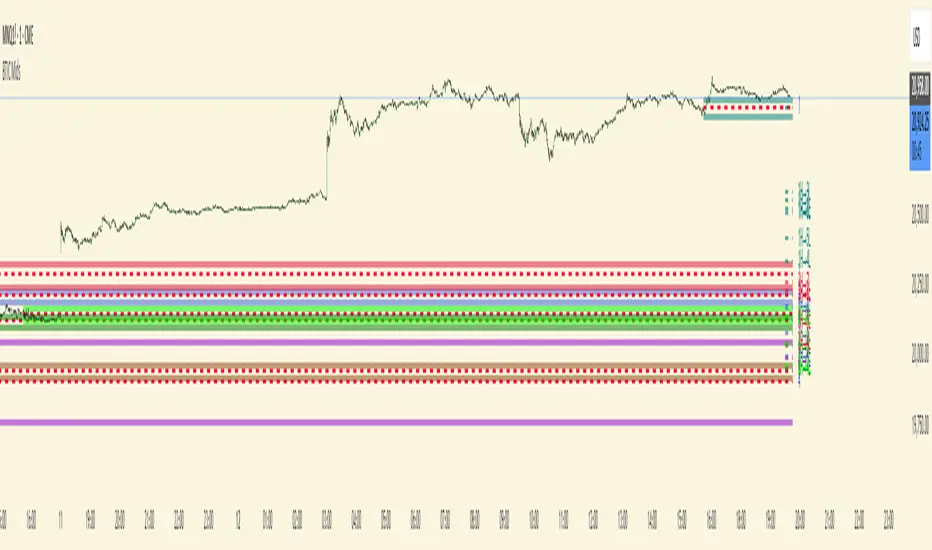
Total Points Range by exp3rtsThis indicator measures and displays the true intraday movement of a market by approximating tick-level activity using 1-second data aggregation. Instead of only looking at net candle movement, it sums every price change during a session, giving traders a more accurate picture of market effort and volatility.
Total Points Moved (TPM) – Captures the full distance traveled by price, not just the net gain/loss.
Bullish vs. Bearish Movement – Separates upward and downward moves so you can see who dominated the session.
Custom Sessions – Define your own session start/end times and time zone for precise tracking.
End-of-Session Summary – Automatically plots a label at session completion with totals for TPM, bullish, and bearish movement.
Visual Session Highlighting – Background shading makes it easy to see when the chosen session is active.
This tool is useful for:
Understanding the true effort vs. result of price movement
Comparing volatility across sessions
Identifying whether bulls or bears contributed more to market swings
Supporting order flow and tick-based trading strategies

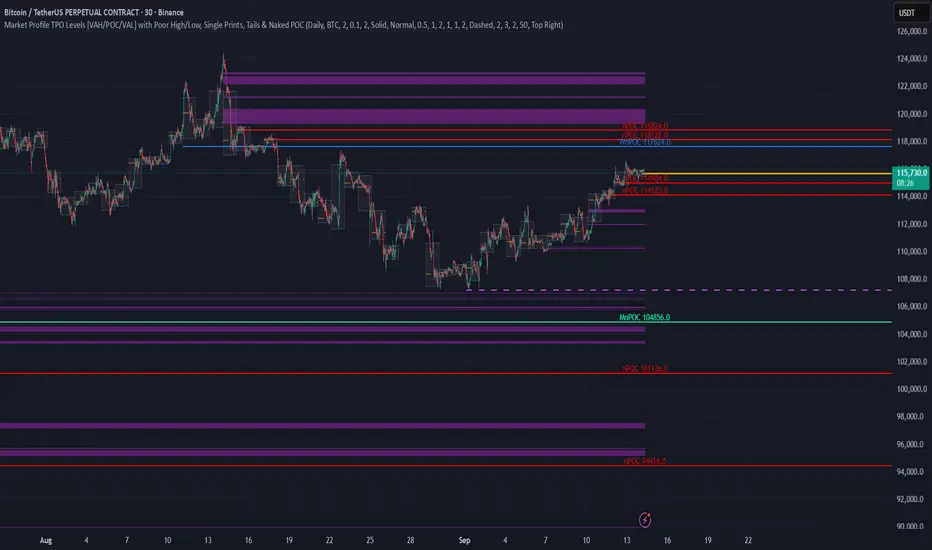
TPO Levels [VAH/POC/VAL] with Poor H/L, Single Prints & NPOCs### 🎯 Advanced Market Profile & Key Level Analysis
This script is a unique and comprehensive technical analysis tool designed to help traders understand market structure, value, and key liquidity levels using the principles of **Auction Market Theory** and **Market Profile**.
This script is unique (and shouldn't be censored) because :
It allows large history of levels to be displayed
Accurate as possible tick size
Doesn't draw a profile but only the actual levels
Supports multi-timeframe levels even on the daily mode giving macro context
There is no indicator out there that does it
While these concepts are universal, this indicator was built primarily for the dynamic, 24/7 nature of the **cryptocurrency market**. It helps you move beyond simple price action to understand *why* the market is moving, which is especially crucial in the volatile crypto space.
### ## 📊 The Concepts Behind the Calculations
To use this script effectively, it's important to understand the core concepts it is built upon. The entire script is self-contained and does not require other indicators.
* **What is Market Profile?**
Market Profile is a unique charting technique that organizes price and time data to reveal market structure. It's built from **Time Price Opportunities (TPOs)**, which are 30-minute periods of market activity. By stacking these TPOs, the script builds a distribution, showing which price levels were most accepted (heavily traded) and which were rejected (lightly traded) during a session.
* **What is the Value Area (VA)?**
The Value Area is the heart of the profile. It represents the price range where **70%** of the session's trading volume occurred. This is considered the "fair value" zone where both buyers and sellers were in general agreement.
* **Point of Control (POC):** The single price level with the most TPOs. This was the most accepted or "fairest" price of the session and acts as a gravitational line for price.
* **Value Area High (VAH):** The upper boundary of the 70% value zone.
* **Value Area Low (VAL):** The lower boundary of the 70% value zone.
VAH and VAL are dynamic support and resistance levels. Trading outside the previous session's value area can signal the start of a new trend.
***
### ## 📈 Key Features Explained
This script automatically calculates and displays the following critical market-generated information:
* **Multi-Timeframe Market Profile**
Automatically draws Daily, Weekly, and Monthly profiles, allowing you to analyze market structure across different time horizons. The script preserves up to 20 historical sessions to provide deep market context.
* **Naked Point of Control (nPOC)**
A "Naked" POC is a Point of Control from a previous session that has **not** been revisited by price. These levels often act as powerful magnets for price, representing areas of unfinished business that the market may seek to retest. The script tracks and displays Daily, Weekly, and Monthly nPOCs until they are touched.
* **Single Prints (Imbalance Zones)**
A Single Print is a price level where only one TPO traded during the session's development. This signifies a rapid, aggressive price move and an imbalanced market. These areas, like gaps in a traditional chart, are frequently revisited as the market seeks to "fill in" these thin parts of the profile.
* **Poor Structure (Unfinished Auctions)**
A **Poor High** or **Poor Low** occurs when the top or bottom of a profile is flat, with two or more TPOs at the extreme price. This suggests that the auction in that direction was weak and inconclusive. These weak structures often signal a high probability that price will eventually break that high or low.
***
### ## 💡 How to Use This Indicator
This tool is not a signal generator but an analytical framework to improve your trading decisions.
1. **Determine Market Context:** Start by asking: Is the current price trading *inside* or *outside* the previous session's Value Area?
* **Inside VA:** The market is in a state of balance or range-bound. Look for trades between the VAH and VAL.
* **Outside VA:** The market is in a state of imbalance and may be starting a trend. Look for continuation or acceptance of prices outside the prior value.
2. **Identify Key Levels:**
* Use historical **nPOCs** as potential profit targets or areas to watch for a price reaction.
* Treat historical **VAH** and **VAL** levels as significant support and resistance zones.
* Note where **Single Prints** are. These are often price magnets that may get "filled" in the future.
3. **Spot Weakness:**
* A **Poor High** suggests weak resistance that may be easily broken.
* A **Poor Low** suggests weak support, signaling a potential for a continued move lower if broken.
***
### ## ⚙️ Customization & Crypto Presets
The indicator is highly customizable, allowing you to change colors, transparency, the number of historical sessions, and more.
To help traders get started quickly, the indicator includes **built-in layout presets** specifically calibrated for major cryptocurrencies: ** BINANCE:BTCUSDT.P , BINANCE:ETHUSDT.P , and BINANCE:SOLUSDT.P **. These presets automatically adjust key visual parameters to better suit the unique price characteristics and volatility of each asset, providing an optimized view right out of the box.
***
### ## ⚠️ Disclaimer
This indicator is a tool for market analysis and should not be interpreted as direct buy or sell signals. It provides information based on historical price action, which does not guarantee future results. Trading involves significant risk, and you should always use proper risk management. This script is designed for use on standard chart types (e.g., Candlesticks, Bar) and may produce misleading information on non-standard charts.
Market Opening Time### TradingView Pine Script "Market Opening Time" Explanation
This Pine Script (`@version=5`) is an indicator that visually highlights market trading sessions (Sydney, London, New York, etc.) by changing the chart's background color. It adjusts for U.S. and Australian Daylight Saving Time (DST).
---
#### **1. Overview**
- **Purpose**: Changes the chart's background color based on UTC time zones to highlight market sessions.
- **Features**:
- Automatically adjusts for U.S. DST (2nd Sunday of March to 1st Sunday of November) and Australian DST (1st Sunday of October to 1st Sunday of April).
- Assigns colors to four time zones (00:00, 06:30, 14:00, 21:00).
- **Use Case**: Helps forex/stock traders identify active market sessions.
---
#### **2. Key Logic**
- **DST Detection**:
- `f_isUSDst`: Checks U.S. DST status.
- `f_isAustraliaDst`: Checks Australian DST status.
- **Time Adjustment** (`f_getAdjustedTime`):
- U.S. DST off: Shifts `time3` (14:00) forward by 1 hour.
- Australian DST off: Shifts `time4` (21:00) forward by 1 hour.
- **Time Conversion** (`f_timeToMinutes`): Converts time (e.g., "14:00") to minutes (e.g., 840).
- **Current Time** (`f_currentTimeInMinutes`): Gets UTC time in minutes.
- **Background Color** (`f_getBackgroundColor`):
- Applies colors based on time ranges:
- 00:00–06:30: Orange (Asia)
- 06:30–14:00: Purple (London)
- 14:00–21:00: Blue (New York, DST-adjusted)
- 21:00–00:00: Red (Sydney, DST-adjusted)
- Outside ranges: Gray
---
#### **3. Settings**
- **Time Zones**:
- `time1` = 00:00 (Orange)
- `time2` = 06:30 (Purple)
- `time3` = 14:00 (Blue, DST-adjusted)
- `time4` = 21:00 (Red, DST-adjusted)
- **Colors**: Transparency set to 90 for visibility.
---
#### **4. Example**
- **September 5, 2025, 10:25 PM JST (13:25 UTC)**:
- U.S. DST active, Australian DST inactive.
- 13:25 UTC falls between `time2` (06:30) and `time3` (14:00) → Background is **Purple** (London session).
- **Effect**: Background color changes dynamically to reflect active sessions.
---
#### **5. Customization**
- Modify `time1`–`time4` or colors for different sessions.
- Add time zones for other markets (e.g., Tokyo).
---
#### **6. Notes**
- Uses UTC; ensure chart is set to UTC.
- DST rules are U.S./Australia-specific; verify for other regions.
A simple, visual tool for tracking market sessions.
----
### TradingView Pine Script「Market Opening Time」解説
このPine Script(`@version=5`)は、市場の取引時間帯(シドニー、ロンドン、ニューヨークなど)を背景色で視覚化するインジケーターです。米国とオーストラリアの夏時間(DST)を考慮し、時間帯を調整します。
---
#### **1. 概要**
- **目的**: UTC基準の時間帯に基づき、チャートの背景色を変更して市場セッションを強調。
- **機能**:
- 米国DST(3月第2日曜~11月第1日曜)とオーストラリアDST(10月第1日曜~4月第1日曜)を自動調整。
- 4つの時間帯(00:00、06:30、14:00、21:00)に色を割り当て。
- **用途**: FXや株式トレーダーが市場のアクティブ時間を把握。
---
#### **2. 主要ロジック**
- **DST判定**:
- `f_isUSDst`: 米国DSTを判定。
- `f_isAustraliaDst`: オーストラリアDSTを判定。
- **時間調整** (`f_getAdjustedTime`):
- 米国DST非適用時: `time3`(14:00)を1時間遅延。
- オーストラリアDST非適用時: `time4`(21:00)を1時間遅延。
- **時間変換** (`f_timeToMinutes`): 時間(例: "14:00")を分単位(840)に変換。
- **現在時刻** (`f_currentTimeInMinutes`): UTCの現在時刻を分単位で取得。
- **背景色** (`f_getBackgroundColor`):
- 時間帯に応じた色を適用:
- 00:00~06:30: オレンジ(アジア)
- 06:30~14:00: 紫(ロンドン)
- 14:00~21:00: 青(ニューヨーク、DST調整)
- 21:00~00:00: 赤(シドニー、DST調整)
- 時間外: グレー
---
#### **3. 設定**
- **時間帯**:
- `time1` = 00:00(オレンジ)
- `time2` = 06:30(紫)
- `time3` = 14:00(青、DST調整)
- `time4` = 21:00(赤、DST調整)
- **色**: 透明度90で視認性確保。
---
#### **4. 使用例**
- **2025年9月5日22:25 JST(13:25 UTC)**:
- 米国DST適用、豪DST非適用。
- 13:25は`time2`(06:30)~`time3`(14:00)の間 → 背景色は**紫**(ロンドン)。
- **効果**: 時間帯に応じて背景色が変化し、市場セッションを直感的に把握。
---
#### **5. カスタマイズ**
- 時間帯(`time1`~`time4`)や色を変更可能。
- 他の市場(例: 東京)に対応する時間帯を追加可能。
---
#### **6. 注意点**
- UTC基準のため、チャート設定をUTCに。
- DSTルールは米国・オーストラリア準拠。他地域では要確認。
シンプルで視覚的な市場時間インジケーターです。

Previous Day High/Low Levels [OWI]📘 How to Use the “Previous Day High/Low Levels ” Indicator
This TradingView indicator automatically tracks and displays the previous day's high and low during the Regular Trading Hours (RTH) session. It’s perfect for traders who want to visualize key support/resistance levels from the prior day in futures like CME_MINI:NQ1! and COMEX:GC1! .
🛠 Setup Instructions
1. Customize RTH Session Times
- In the Settings panel, adjust the following under the Levels group:
- RTH Start Hour and RTH Start Minute: Default is 9:30 AM (New York time).
- RTH End Hour and RTH End Minute: Default is 4:15 PM.
- These define the active trading session used to calculate the day’s high and low.
2. Toggle Labels
- Use the Show PDH/PDL Labels checkbox to display or hide the “PDH” and “PDL” labels on the chart.
- Labels appear after the session ends and follow price dynamically.
📊 What the Indicator Does
- During the RTH session:
- Tracks the highest and lowest price of the day.
- After the session ends:
- Draws horizontal lines at the previous day’s high (green) and low (red).
- Optionally displays labels ("PDH" and "PDL") at those levels.
- Lines extend into the current day to help identify potential support/resistance zones.
✅ Best Practices
- Use this indicator on intraday timeframes (e.g., 5m, 15m, 1h) for best results.
- Combine with volume or price action analysis to confirm reactions at PDH/PDL levels.
- Adjust session times if trading non-US markets or custom hours.

X Opens+Overview:
The X Opens+ indicator is a precision tool designed for traders seeking to analyze market structure and behavior around key timeframe opens. It highlights the open prices of custom-selected higher timeframes—such as daily, weekly, or monthly sessions—and visualizes them directly on lower timeframes. These open levels often coincide with high-volume zones, market imbalance, and institutional interest, making them powerful reference points for intraday and swing trading strategies.
Key Features:
Custom Timeframe Anchoring: Users can select any timeframe (e.g., daily, 4H, 1W) to display its current and previous session opens directly on their active chart. This allows for flexible multi-timeframe analysis within a single view.
Price Reaction Zones: Timeframe opens are frequently areas of heightened liquidity and directional bias. By identifying these opens and their relationship to current price action, traders can anticipate areas of support/resistance, trend continuation, or reversal.
Derived Midpoints and Ranges: The indicator also computes and displays the previous session’s range midpoint (EQ), as well as extension bands (e.g., ±1.0x or ±1.5x the prior range). These levels are useful for contextualizing volatility expansion and identifying breakout or fade setups around key open zones.
Historical Session Mapping: In addition to live opens, the tool optionally displays opens and range-based levels from previous sessions. This historical layering gives traders a broader context of how price has respected or rejected these levels over time.
Labeling and Customization: Each level can be labeled and color-coded to match user preferences. The visibility, size, and style of each element (e.g., lines, labels, bands) are fully configurable for visual clarity and user alignment.
Use Cases:
Confirming bias around daily or weekly opens, especially during market opens or key economic releases.
Identifying equilibrium levels for mean reversion or continuation setups.
Using ±1.0 and ±1.5 range projections as dynamic targets or invalidation zones.
Anchoring to key sessions for volume profile or order flow-based strategies.
Summary:
X Opens+ is a data-driven utility that transforms static session opens into dynamic market tools. By spotlighting where institutional interest likely concentrates—at the opens of significant timeframes—this indicator provides traders with a structural edge in identifying key zones that influence price behavior throughout the trading day or week

Open Range Breakout (ORB) with Alerts
🚀 ChartsAlgo – Open Range Breakout (ORB) with Alerts
The Open Range Breakout (ORB) Indicator by ChartsAlg is designed for intraday traders looking to capitalize on price movements after the market’s opening range. This tool is especially effective for futures (MNQ, MES) and high-volatility stocks or crypto where initial volatility sets the tone for the session.
This indicator identifies a user-defined opening range window, plots the high/low lines of that range, and visually alerts users when price breaks out above or below the range — with options to customize breakout repetitions, background fill, and alerts.
💡 What is an Open Range Breakout (ORB)?
The opening range represents the high and low established during the first few minutes of the trading session — usually 15 or 30 minutes. Many intraday strategies are based on the idea that breaking out of this initial range often signals strong momentum and trend continuation.
Traders often enter:
Long when price breaks above the range high.
Short when price breaks below the range low.
⚙️ How It Works
You define a session window (e.g., 09:30–09:45 EST).
The indicator tracks the high and low during this time.
Once the session ends, the high and low become your range breakout levels.
The indicator then:
Plots lines for visual clarity
Optionally fills background between the range
Triggers breakout signals if price crosses the levels
Provides alerts when breakouts occur
🛠️ Settings Breakdown
🔹 Session Settings
Range Session: Set your preferred window (e.g., 0930–0945). Can be premarket, first 30 mins, or any custom time.
Time zone: Use "America/New York" for EST (default) or change to "GMT+0" for international traders.
🔹 Breakout Settings
Bullish Breakout Signals: Number of allowed breakout alerts above the range.
Bearish Breakout Signals: Number of allowed breakout alerts below the range.
This prevents repeated alerts once breakout has been confirmed.
🔹 Display Settings
Show Background Fill: Fills area between high/low of the range for easier visual analysis.
Show Breakout Signals: Triangle markers plotted on the chart when breakouts happen.
Only Show Today’s Range: Keeps the chart clean by showing only the most current day’s range.
🔹 Color Settings
Range High/Low Line Colors: Choose any color for clarity.
Range Fill Color: Customize the highlight area for your chart style.
📊 Chart Features
Range High/Low Lines: Automatically plotted after range session ends.
Visual Fill Box: Optional background shading between the opening range.
Triangle Breakout Markers: Appear at the breakout candle.
Alerts: Can be used with TradingView’s alert system to notify you of breakouts in real-time.
🔔 Alerts
Two alert conditions are built in:
Bullish Breakout: Triggers when price breaks above the high of the range.
Bearish Breakout: Triggers when price breaks below the low of the range.
Example Alert Message:
📈 “Bullish Breakout above Open Range on AAPL!”
To activate:
Click “🔔 Alerts” on TradingView.
Set condition to this script.
Choose “ORB Breakout Up” or “ORB Breakout Down”.
Choose alert frequency and notification method.
⚠️ DISCLAIMER
ChartsAlgo tools are for informational and educational purposes only.
They are not financial advice or signals. Past performance does not guarantee future results. Use at your own risk and always implement solid risk management.
By using this indicator, you agree that you are solely responsible for any trades or decisions made based on the information provided.

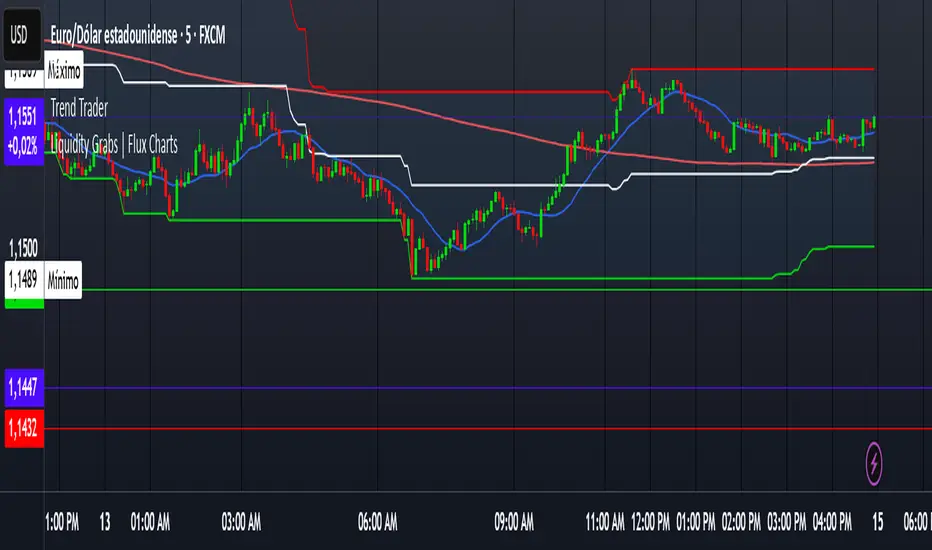
Trend TraderDescription and Usage of the "Trend Trader" Indicator
The "Trend Trader" indicator, created by Gerardo Mercado as a legacy project, is a versatile trading tool designed to identify potential buy and sell signals across various instruments. While it provides predefined settings for popular instruments like US30, NDX100, GER40, and GOLD, it can be seamlessly adapted to any market, including forex pairs like EUR/USD. The indicator combines moving averages, time-based filters, and MACD confirmation to enhance decision-making for traders.
How It Works
Custom Moving Averages (MAs):
The indicator uses two moving averages:
Short MA: A faster-moving average (default: 10 periods).
Long MA: A slower-moving average (default: 100 periods).
Buy signals are generated when the Short MA crosses above the Long MA.
Sell signals are triggered when the Short MA crosses below the Long MA.
Time-Based Signals:
The user can define specific trading session times (start and end in UTC) to focus on high-activity periods for their chosen market.
Signals and background coloring are only active during the allowed session times.
MACD Confirmation:
A MACD (Moving Average Convergence Divergence) calculation on a 15-minute timeframe ensures stronger confirmation for signals.
Buy signals require the MACD line to be above the signal line.
Sell signals require the MACD line to be at or below the signal line.
Target Levels:
Predefined profit targets are dynamically set based on the selected trading instrument.
While it includes settings for US30, NDX100, GER40, and GOLD, the target levels can be adjusted to fit the volatility and structure of any asset, including forex pairs like EUR/USD.
Target 1 and Target 2 levels display when these thresholds are met after an entry signal.
Adaptability to Any Market:
Although predefined options are included for specific instruments, the indicator's moving averages, time settings, and MACD logic are applicable to any tradable asset, making it suitable for forex, commodities, indices, and more.
Visual Alerts:
Labels appear on the chart to highlight "BUY" and "SELL" signals at crossover points.
Additional labels indicate when price movements reach the predefined target levels.
Bar and background coloring visually represent active signals and MACD alignment.
Purpose
The indicator aims to simplify trend-following and momentum-based trading strategies. By integrating moving averages, MACD, customizable time sessions, and dynamic targets, it offers clear entry and exit points while being adaptable to the needs of individual traders across diverse markets.
How to Use
Setup:
Add the indicator to your TradingView chart.
Configure the moving average periods, trading session times, and target levels according to your preferences.
Select the instrument for predefined target settings or customize them to fit the asset you’re trading (e.g., EUR/USD or other forex pairs).
Interpreting Signals:
Buy Signal: The Short MA crosses above the Long MA, MACD confirms the upward trend, and the session is active.
Sell Signal: The Short MA crosses below the Long MA, MACD confirms the downward trend, and the session is active.
Adapt for Any Instrument:
Adjust the predefined target levels to match the volatility and trading style for your chosen asset.
For forex pairs like EUR/USD, consider typical pip movements to set appropriate profit targets.
Targets:
Use the provided target labels (e.g., 50 or 100 points) or customize them to reflect realistic profit goals based on the asset’s volatility.
Visual Aids:
Pay attention to the background color:
Greenish: Indicates a bullish trend during the allowed session.
Redish: Indicates a bearish trend during the allowed session.
Use the "BUY" and "SELL" labels for actionable insights.
This indicator is a flexible and powerful tool, suitable for traders across all markets. Its adaptability ensures that it can enhance your strategy, whether you’re trading forex, commodities, indices, or other assets. By offering actionable alerts and customizable settings, the "Trend Trader" serves as a valuable addition to any trader’s toolkit. FX:EURUSD
Overnight ES Strategy: CBC + Fractal + RSI + ATR FilterThis script is designed for overnight trading of the E-mini S&P 500 futures (ES) between 6 PM and 11 PM EST.
It combines multiple technical confluences to generate high-probability buy and sell signals, focusing on volatility-rich, low-liquidity evening sessions.
Key Features:
Candle Body Confluence (CBC) Approximation:
Identifies candles with small real bodies compared to total range, simulating consolidation zones where price is likely to reverse.
Williams Fractal Confirmation:
Detects local tops and bottoms based on 5-bar fractal reversal patterns, helping validate breakout or reversal points.
RSI Filter:
Ensures momentum is supportive — buys only when RSI < 35 (oversold) and sells only when RSI > 65 (overbought).
ATR Volatility Filter:
Trades are only allowed if the Average True Range (ATR) exceeds a user-defined threshold, filtering out low-volatility, risky environments.
Time Session Control:
Signals are only generated during the user-defined evening session (default: 6 PM to 11 PM EST) to match market behavior.
Real-Time Alerts Enabled:
Alerts can be set for BUY or SELL conditions, enabling mobile notifications, emails, or pop-ups without constant chart monitoring.
Recommended Settings:
Chart Timeframe: 15-minute or 30-minute candles
Assets: ES Mini (ES1!), NQ Mini, or other CME futures
Session: New York Time (EST)
ATR Threshold: Adjust based on market conditions; 5.0 suggested starting point for ES Mini on 15m.
Important:
This script only plots signals, it does not auto-execute trades.
Always backtest and paper trade before using live capital.
Volatility can vary; consider adjusting RSI and ATR filters based on market environment.
Credits:
Script designed based on confluence of price action, momentum, reversal structure, and volatility filtering principles used by professional traders.
Inspired by Candle Body Confluence (CBC) theory and Williams fractal techniques.

BTIC Range MidpointsThis code analyzes and displays price ranges from 15:15-15:44 ET, the Basis Trade at Index Close session.
It draws horizontal lines showing:
The high of each session
The low of each session
The midpoint (50%) of each session
Connections between different session ranges (50% points between highs and lows)
Key features include:
Works only on 15-minute timeframes or lower
Stores up to 20 days of historical sessions (configurable)
Filters out ranges too far from current price
Color-codes different session ranges
Provides customizable line styles and colors
Labels each range with identifiers
The indicator essentially helps traders identify important price levels from BTIC sessions, which could serve as potential support/resistance areas for future price action.
Range Projections [TFO]The purpose of this indicator is to see how often price reached certain standard deviations from a selected time range. The inspiration for this was to study ICT (Inner Circle Trader) concepts regarding the Central Bank Dealer’s Range (CBDR), which is 2:00 pm - 8:00 pm New York local time according to ICT Core Content. However, the idea and data collection could certainly be applied to any range of time.
The main settings of this indicator are session time, range type, and the standard deviation filter. The session time is the window of price that will be utilized for range projections. The range type can be either body or wick (on the current timeframe). The standard deviation filter is used to eliminate sessions whose ranges (from high to low) are greater than the desired/input number of standard deviations from all available session ranges.
In this example, the time range is set to 16:00 - 20:00, or the time between the New York session close and the Asia session open. Our standard deviations are set to 1, 2, 2.5, and 4. Now, by taking this session’s price range and extrapolating these extensions from the initial range, we can use these levels to see if and how price interacts with them before the next 16:00 - 20:00 session.
Furthermore, we can enable the Data Table to analyze how often price trades to these levels for the sessions that are deemed valid (determined by the standard deviation filter). This time our standard deviations are set to 1, 2, 3, and 4.
This concept can theoretically be applied to any window of time. ICT has mentioned that, in instances where the CBDR is too large, the Asia range may be used instead. We can observe that the indicator behaves the same way when we change the session to the Asia range, 20:00 - 00:00.

Murder Algo Stats: last portion of Indices closing hour (S&P)Stats regarding the 'murder algo' (last 10mins of the closing hour). Works on all sub-1hr timeframes. Best used on 5min, 10min 15min timeframe. Ideal use on 10min timeframe.
Can be applied to other user input sessions also
What i'm calling the 'Murder Algo' is the tendency of dynamic lower time frame price action in the final 10minutes of the S&P closing hour (or any of the three major US indices: S&P, Nasdaq, Dow).
If there are un-met liquidity targets (i.e. clean highs or lows) as we come into the last portion of the closing hour, price has a tendency to stretch up or down to reach these targets, swiftly.
These statisitics are somewhat experimental/research; trying to quantify this tendency. Please comment below if you think of some additions / modifications that may prove useful.
//Purpose:
-To get statistics of the tendency to 'reach' of the final bar (10minute bar in the above) of the closing hour in Indices (3pm - 4pm NY time).
-Specifically to see how often price reaches for HH or LL in the final bar of the closing hour (most of the time); and to see how far it reaches one way when it does (Mean, median, mode).
//Notes:
-Two sets of historical stats; one is based on the 'solo reach' of the last bar; the other is based on the reach of the last bar from the average price of the preceding bars of the session (purple line in the above)
-Works on any timeframe below hourly. Ideally used on 10min timeframe, but may be interesting to plot on 15min or 5min timeframe also.
-Should also work on custom user-defined session; though this indicator was explicly designed to investigate the 'murder algo': that final rush and/or whipsaw tendency of price in the last few minutes of Regular trading on Indices.
-For S&P, best used on SPX, which gives the longest history of all the S&P variants due to only showing Regular trading hours bars (500 days of history on 10min timeframe, for premium users)
-For most stats, i've rounded to ES1! mintick (i.e. rounded to nearest quarter dollar) =>> This allows more meaningful values for 'mode' statistical measure.
-I trade S&P; but this 'muder algo' phenomenon also obviously presents in Nasdaq and Dow.
//User Inputs:
-Session time input (defaults to closing hour 3pm - 4pm NY time)
-Average method (for the average of all the input session EXCEPT the final bar)
-Toggle on/off Average line.
-other formatting options: text color, table position, line color/style/size.
Example usage with annotations on SPX 500 chart 15m timeframe; using closing hour (3pm-4pm NY time) as our session:

Liquidity Sweep Sniper AP StyleAP Capital – Liquidity Sweep Sniper (Fab-Style)
📌 Overview
This indicator is a precision scalping tool inspired by professional liquidity-based trading concepts often demonstrated by elite intraday scalpers.
The script focuses on liquidity sweeps followed by strong displacement, aiming to capture short, high-probability momentum moves — particularly effective on lower timeframes (1–5 min) during active market sessions.
It is not a signal spam tool. Signals appear only when multiple objective conditions align.
🧠 Core Concept
Markets do not move randomly — they seek liquidity before expanding.
This indicator identifies:
Buy-side / Sell-side liquidity
Liquidity sweeps (stop-hunts)
Strong displacement candles reclaiming price
Optional higher-timeframe trend alignment
Only when all conditions are met does a signal print.
🔍 What the Indicator Detects
1️⃣ Liquidity Pools
Equal highs or equal lows detected within a configurable lookback
Minimum number of touches required
ATR-based tolerance to adapt to volatility
These levels represent areas where stop orders are likely resting.
2️⃣ Liquidity Sweep
A valid sweep requires:
Price to wick beyond the liquidity level
Candle to close back inside the range
This indicates failed breakout / stop-hunt behaviour.
3️⃣ Displacement Confirmation
After the sweep, the candle must show:
Strong body (default >60% of candle range)
Candle range large relative to ATR
Clear directional intent (momentum)
This filters out weak reactions and chop.
4️⃣ Optional Trend Filter
EMA-based higher-timeframe bias
Helps align scalps with dominant direction
Can be enabled or disabled
📈 Signals
BUY: Sell-side liquidity sweep → bullish displacement
SELL: Buy-side liquidity sweep → bearish displacement
Signals are plotted directly on the chart and can be used with alerts.
⚙️ Recommended Usage
Markets: XAUUSD, indices, liquid FX pairs
Timeframes: 1m–5m
Sessions: London & New York (best performance)
Risk Management: Always required — this tool does not place trades
Best used as a confirmation tool, not standalone.
⚠️ Important Notes
This indicator is inspired by liquidity-based scalping concepts, not an exact replication of any individual trader’s private strategy.
No indicator predicts the future — this tool highlights high-probability scenarios, not guarantees.
Past performance is not indicative of future results.

Hybrid Strategy: Trend/ORB/MTFHybrid Strategy: Trend + ORB + Multi-Timeframe Matrix
This script is a comprehensive "Trading Manager" designed to filter out noise and identify high-probability breakout setups. It combines three powerful concepts into a single, clean chart interface: Trend Alignment, Opening Range Breakout (ORB), and Multi-Timeframe (MTF) Analysis.
It is designed to prevent "analysis paralysis" by providing a unified Dashboard that confirms if the trend is aligned across 5 different timeframes before you take a trade.
How it Works
The strategy relies on the "Golden Trio" of confluence:
1. Trend Definition (The Setup) Before looking for entries, the script analyzes the immediate trend. A bullish trend is defined as:
Price is above the Session VWAP.
The fast EMA (9) is above the slow EMA (21). (The inverse applies for bearish trends).
2. The Signal (The Trigger) The script draws the Opening Range (default: first 15 minutes of the session).
Buy Signal: Price breaks above the Opening Range High while the Trend is Bullish.
Sell Signal: Price breaks below the Opening Range Low while the Trend is Bearish.
3. The Confirmation (The Filter) A signal is only valid if the Higher Timeframe (default: 60m) agrees with the direction. If the 1m chart says "Buy" but the 60m chart is bearish, the signal is filtered out to prevent false breakouts.
Key Features
The Matrix Dashboard A zero-lag, real-time table in the corner of your screen that monitors 5 user-defined timeframes (e.g., 5m, 15m, 30m, 60m, 4H).
Trend: Checks if Price > EMA 21.
VWAP: Checks if Price > VWAP.
ORB: Checks if Price is currently above/below the Opening Range of that session.
D H/L: Warns if price is near the Daily High or Low.
PD H/L: Warns if price is near the Previous Daily High or Low.
Visual Order Blocks The script automatically identifies valid Order Blocks (sequences of consecutive candles followed by a strong explosive move).
Chart: Draws Green/Red zones extending to the right, showing where price may react.
Dashboard: Displays the exact High, Low, and Average price of the most recent Order Blocks for precision planning.
Risk Management (Trailing Stop) Once a trade is active, the script plots Chandelier Exit dots (ATR-based trailing stop) to help you manage the trade and lock in profits during trend runs.
Visual Guide (Chart Legend)
⬜ Gray Box: Represents the Opening Range (first 15 minutes). This is your "No Trade Zone." Wait for price to break out of this box.
🟢 Green Line: The Opening Range High. A break above this line signals potential Bullish momentum.
🔴 Red Line: The Opening Range Low. A break below this line signals potential Bearish momentum.
🟢 Green / 🔴 Red Zones (Boxes): These are Order Blocks.
🟢 Green Zone: A Bullish Order Block (Demand). Expect price to potentially bounce up from here.
🔴 Red Zone: A Bearish Order Block (Supply). Expect price to potentially reject down from here.
⚪ Dots (Trailing Stop):
🟢 Green Dots: These appear below price during a Bullish trend. They represent your suggested Stop Loss.
🔴 Red Dots: These appear above price during a Bearish trend.
🏷️ Buy / Sell Labels:
BUY: Triggers when Price breaks the Green Line + Trend is Bullish + HTF is Bullish.
SELL: Triggers when Price breaks the Red Line + Trend is Bearish + HTF is Bearish.
Settings
Session: Customizable RTH (Regular Trading Hours) to filter out pre-market noise.
Matrix Timeframes: 5 fixed slots to choose which timeframes you want to monitor.
Order Blocks: Adjust the sensitivity and lookback period for Order Block detection.
Risk: Customize the ATR multiplier for the trailing stop.
Disclaimer
This tool is for educational purposes only. Past performance does not guarantee future results. Always manage your risk properly.

Bollinger Bands + VWAP + 4-State MACD BackgroundBollinger Bands + VWAP + 4-State MACD Background
An all-in-one technical analysis indicator combining three proven tools with an intelligent momentum-based background visualization system.
📊 FEATURES
Bollinger Bands
Standard Bollinger Bands implementation with full customization options:
Adjustable period length (default: 20)
Multiple moving average types: SMA, EMA, SMMA (RMA), WMA, VWMA
Configurable standard deviation multiplier (default: 2.0)
Visual fill between bands to highlight volatility zones
Offset capability for forward/backward display
Session VWAP (Volume Weighted Average Price)
Automatically resets at the start of each trading session:
Calculates true volume-weighted average price
Resets daily to provide fresh reference levels
Customizable source input (default: HLC3)
Adjustable line appearance (color and width)
Can be toggled on/off as needed
4-State MACD Background System
This is the unique feature of this indicator. The chart background dynamically changes based on MACD momentum analysis, providing instant visual feedback on trend strength and direction:
🟢 Strong Bullish (Bright Green)
MACD line is above signal line
Histogram is growing (momentum accelerating upward)
Indicates strong upward momentum
🟢 Weak Bullish (Pale Green)
MACD line is above signal line
Histogram is shrinking (momentum decelerating)
Early warning signal that uptrend may be weakening
🔴 Strong Bearish (Bright Red)
MACD line is below signal line
Histogram is falling (momentum accelerating downward)
Indicates strong downward momentum
🔴 Weak Bearish (Pale Red)
MACD line is below signal line
Histogram is rising (momentum decelerating)
Early warning signal that downtrend may be weakening
🎯 HOW TO USE
For Trend Trading:
Strong colored backgrounds indicate confirmed momentum in that direction - consider staying with the trend
Weak colored backgrounds signal potential momentum exhaustion - watch for possible reversals
Use VWAP as a dynamic support/resistance level
Bollinger Band breakouts combined with strong MACD backgrounds can confirm trend strength
Price above VWAP + strong bullish background = bullish bias
Price below VWAP + strong bearish background = bearish bias
For Mean Reversion:
Price touching upper/lower Bollinger Bands with weak MACD background may suggest potential reversal
VWAP acts as a mean reversion anchor during range-bound sessions
Background color shifts from strong to weak often precede price direction changes
Look for price return to VWAP when extended beyond bands with weakening momentum
Signal Confirmation:
Strongest signals occur when multiple indicators align:
BB breakout + MACD strong color + price above/below VWAP
Price rejection at BB bands + MACD color weakening
VWAP support/resistance hold + MACD color change
⚙️ SETTINGS
All components are fully customizable through organized input groups:
Bollinger Bands Group:
Period length
Moving average type (SMA/EMA/SMMA/WMA/VWMA)
Source (close/open/high/low/etc.)
Standard deviation multiplier
Offset
VWAP Group:
Toggle show/hide
Source calculation method
Line color
Line width
MACD Group:
Toggle background on/off
Fast length (default: 12)
Slow length (default: 26)
Signal length (default: 9)
Source
Four separate color settings for each momentum state
All colors include transparency controls
💡 EDUCATIONAL VALUE
This indicator teaches important concepts:
How volatility (Bollinger Bands) relates to price movement
The importance of volume-weighted pricing (VWAP)
Momentum analysis through MACD
How combining multiple timeframes and indicators can provide confluence
The difference between trend strength and trend direction
⚠️ IMPORTANT NOTES
This indicator is for educational and informational purposes only
No indicator is perfect - always use proper risk management
Past performance does not guarantee future results
Combine with your own analysis and risk tolerance
Test thoroughly on historical data before live trading
This is not financial advice - use at your own risk
🔧 TECHNICAL DETAILS
Pine Script Version 6
Overlay indicator (displays on price chart)
All calculations use standard, well-documented formulas
Minimal lag due to efficient coding
Compatible with all timeframes and instruments
No repainting - all signals are confirmed on bar close
📝 CHANGELOG
Version 1.0
Initial release
Bollinger Bands with multiple MA types
Session VWAP with daily reset
4-state MACD background system
Full customization options
Developed for traders who want multiple confirmation signals in a clean, organized format without cluttering their charts with separate indicator panels.

Hidden Impulse═══════════════════════════════════════════════════════════════════
HIDDEN IMPULSE - Multi-Timeframe Momentum Detection System
═══════════════════════════════════════════════════════════════════
OVERVIEW
Hidden Impulse is an advanced momentum oscillator that combines the Schaff Trend Cycle (STC) and Force Index into a comprehensive multi-timeframe trading system. Unlike standard implementations of these indicators, this script introduces three distinct trading setups with specific entry conditions, multi-timeframe confirmation, and trend filtering.
═══════════════════════════════════════════════════════════════════
ORIGINALITY & KEY FEATURES
This indicator is original in the following ways:
1. DUAL-TIMEFRAME STC ANALYSIS
Standard STC implementations work on a single timeframe. This script
simultaneously analyzes STC on both your trading timeframe and a higher
timeframe, providing trend context and filtering out low-probability signals.
2. FORCE INDEX INTEGRATION
The script combines STC with Force Index (volume-weighted price momentum)
to confirm the strength behind price moves. This combination helps identify
when momentum shifts are backed by genuine buying/selling pressure.
3. THREE DISTINCT TRADING SETUPS
Rather than generic overbought/oversold signals, the indicator provides
three specific, rule-based setups:
- Setup A: Classic trend-following entries with multi-timeframe confirmation
- Setup B: Divergence-based reversal entries (highest probability)
- Setup C: Mean-reversion bounce trades at extreme levels
4. INTELLIGENT FILTERING
All signals are filtered through:
- 50 EMA trend direction (prevents counter-trend trades)
- Higher timeframe STC alignment (ensures macro trend agreement)
- Force Index confirmation (validates volume support)
═══════════════════════════════════════════════════════════════════
HOW IT WORKS - TECHNICAL EXPLANATION
SCHAFF TREND CYCLE (STC) CALCULATION:
The STC is a cyclical oscillator that combines MACD concepts with stochastic
smoothing to create earlier and smoother trend signals.
Step 1: Calculate MACD
- Fast MA = EMA(close, Length1) — default 23
- Slow MA = EMA(close, Length2) — default 50
- MACD Line = Fast MA - Slow MA
Step 2: First Stochastic Smoothing
- Apply stochastic calculation to MACD
- Stoch1 = 100 × (MACD - Lowest(MACD, Smoothing)) / (Highest(MACD, Smoothing) - Lowest(MACD, Smoothing))
- Smooth result with EMA(Stoch1, Smoothing) — default 10
Step 3: Second Stochastic Smoothing
- Apply stochastic calculation again to the smoothed stochastic
- This creates the final STC value between 0-100
The dual stochastic smoothing makes STC more responsive than MACD while
being smoother than traditional stochastics.
FORCE INDEX CALCULATION:
Force Index measures the power behind price movements by incorporating volume:
Force Raw = (Close - Close ) × Volume
Force Index = EMA(Force Raw, Period) — default 13
Interpretation:
- Positive Force Index = Buying pressure (bulls in control)
- Negative Force Index = Selling pressure (bears in control)
- Force Index crossing zero = Momentum shift
- Divergences with price = Weakening momentum (reversal signal)
TREND FILTER:
A 50-period EMA serves as the trend filter:
- Price above EMA50 = Uptrend → Only LONG signals allowed
- Price below EMA50 = Downtrend → Only SHORT signals allowed
This prevents counter-trend trading which accounts for most losing trades.
═══════════════════════════════════════════════════════════════════
THE THREE TRADING SETUPS - DETAILED
SETUP A: CLASSIC MOMENTUM ENTRY
Concept: Enter when STC exits oversold/overbought zones with trend confirmation
LONG CONDITIONS:
1. Higher timeframe STC > 25 (macro trend is up)
2. Primary timeframe STC crosses above 25 (momentum turning up)
3. Force Index crosses above 0 OR already positive (volume confirms)
4. Price above 50 EMA (local trend is up)
SHORT CONDITIONS:
1. Higher timeframe STC < 75 (macro trend is down)
2. Primary timeframe STC crosses below 75 (momentum turning down)
3. Force Index crosses below 0 OR already negative (volume confirms)
4. Price below 50 EMA (local trend is down)
Best for: Trending markets, continuation trades
Win rate: Moderate (60-65%)
Risk/Reward: 1:2 to 1:3
───────────────────────────────────────────────────────────────────
SETUP B: DIVERGENCE REVERSAL (HIGHEST PROBABILITY)
Concept: Identify exhaustion points where price makes new extremes but
momentum (Force Index) fails to confirm
BULLISH DIVERGENCE:
1. Price makes a lower low (LL) over 10 bars
2. Force Index makes a higher low (HL) — refuses to follow price down
3. STC is below 25 (oversold condition)
Trigger: STC starts rising AND Force Index crosses above zero
BEARISH DIVERGENCE:
1. Price makes a higher high (HH) over 10 bars
2. Force Index makes a lower high (LH) — refuses to follow price up
3. STC is above 75 (overbought condition)
Trigger: STC starts falling AND Force Index crosses below zero
Why this works: Divergences signal that the current trend is losing steam.
When volume (Force Index) doesn't confirm new price extremes, a reversal
is likely.
Best for: Reversal trading, range-bound markets
Win rate: High (70-75%)
Risk/Reward: 1:3 to 1:5
───────────────────────────────────────────────────────────────────
SETUP C: QUICK BOUNCE AT EXTREMES
Concept: Catch rapid mean-reversion moves when price touches EMA50 in
extreme STC zones
LONG CONDITIONS:
1. Price touches 50 EMA from above (pullback in uptrend)
2. STC < 15 (extreme oversold)
3. Force Index > 0 (buyers stepping in)
SHORT CONDITIONS:
1. Price touches 50 EMA from below (pullback in downtrend)
2. STC > 85 (extreme overbought)
3. Force Index < 0 (sellers stepping in)
Best for: Scalping, quick mean-reversion trades
Win rate: Moderate (55-60%)
Risk/Reward: 1:1 to 1:2
Note: Use tighter stops and quick profit-taking
═══════════════════════════════════════════════════════════════════
HOW TO USE THE INDICATOR
STEP 1: CONFIGURE TIMEFRAMES
Primary Timeframe (STC - Primary Timeframe):
- Leave empty to use your current chart timeframe
- This is where you'll take trades
Higher Timeframe (STC - Higher Timeframe):
- Default: 30 minutes
- Recommended ratios:
* 5min chart → 30min higher TF
* 15min chart → 1H higher TF
* 1H chart → 4H higher TF
* Daily chart → Weekly higher TF
───────────────────────────────────────────────────────────────────
STEP 2: ADJUST STC PARAMETERS FOR YOUR MARKET
Default (23/50/10) works well for stocks and forex, but adjust for:
CRYPTO (volatile):
- Length 1: 15
- Length 2: 35
- Smoothing: 8
(Faster response for rapid price movements)
STOCKS (standard):
- Length 1: 23
- Length 2: 50
- Smoothing: 10
(Balanced settings)
FOREX MAJORS (slower):
- Length 1: 30
- Length 2: 60
- Smoothing: 12
(Filters out noise in 24/7 markets)
───────────────────────────────────────────────────────────────────
STEP 3: ENABLE YOUR PREFERRED SETUPS
Toggle setups based on your trading style:
Conservative Trader:
✓ Setup B (Divergence) — highest win rate
✗ Setup A (Classic) — only in strong trends
✗ Setup C (Bounce) — too aggressive
Trend Trader:
✓ Setup A (Classic) — primary signals
✓ Setup B (Divergence) — for entries on pullbacks
✗ Setup C (Bounce) — not suitable for trending
Scalper:
✓ Setup C (Bounce) — quick in-and-out
✓ Setup B (Divergence) — high probability scalps
✗ Setup A (Classic) — too slow
───────────────────────────────────────────────────────────────────
STEP 4: READ THE SIGNALS
ON THE CHART:
Labels appear when conditions are met:
Green labels:
- "LONG A" — Setup A long entry
- "LONG B DIV" — Setup B divergence long (best signal)
- "LONG C" — Setup C bounce long
Red labels:
- "SHORT A" — Setup A short entry
- "SHORT B DIV" — Setup B divergence short (best signal)
- "SHORT C" — Setup C bounce short
IN THE INDICATOR PANEL (bottom):
- Blue line = Primary timeframe STC
- Orange dots = Higher timeframe STC (optional)
- Green/Red bars = Force Index histogram
- Dashed lines at 25/75 = Entry/Exit zones
- Background shading = Oversold (green) / Overbought (red)
INFO TABLE (top-right corner):
Shows real-time status:
- STC values for both timeframes
- Force Index direction
- Price position vs EMA
- Current trend direction
- Active signal type
═══════════════════════════════════════════════════════════════════
TRADING STRATEGY & RISK MANAGEMENT
ENTRY RULES:
Priority ranking (best to worst):
1st: Setup B (Divergence) — wait for these
2nd: Setup A (Classic) — in confirmed trends only
3rd: Setup C (Bounce) — scalping only
Confirmation checklist before entry:
☑ Signal label appears on chart
☑ TREND in info table matches signal direction
☑ Higher timeframe STC aligned (check orange dots or table)
☑ Force Index confirming (check histogram color)
───────────────────────────────────────────────────────────────────
STOP LOSS PLACEMENT:
Setup A (Classic):
- LONG: Below recent swing low
- SHORT: Above recent swing high
- Typical: 1-2 ATR distance
Setup B (Divergence):
- LONG: Below the divergence low
- SHORT: Above the divergence high
- Typical: 0.5-1.5 ATR distance
Setup C (Bounce):
- LONG: 5-10 pips below EMA50
- SHORT: 5-10 pips above EMA50
- Typical: 0.3-0.8 ATR distance
───────────────────────────────────────────────────────────────────
TAKE PROFIT TARGETS:
Conservative approach:
- Exit when STC reaches opposite level
- LONG: Exit when STC > 75
- SHORT: Exit when STC < 25
Aggressive approach:
- Hold until opposite signal appears
- Trail stop as STC moves in your favor
Partial profits:
- Take 50% at 1:2 risk/reward
- Let remaining 50% run to target
───────────────────────────────────────────────────────────────────
WHAT TO AVOID:
❌ Trading Setup A in sideways/choppy markets
→ Wait for clear trend or use Setup B only
❌ Ignoring higher timeframe STC
→ Always check orange dots align with your direction
❌ Taking signals against the major trend
→ If weekly trend is down, be cautious with longs
❌ Overtrading Setup C
→ Maximum 2-3 bounce trades per session
❌ Trading during low volume periods
→ Force Index becomes unreliable
═══════════════════════════════════════════════════════════════════
ALERTS CONFIGURATION
The indicator includes 8 alert types:
Individual setup alerts:
- "Setup A - LONG" / "Setup A - SHORT"
- "Setup B - DIV LONG" / "Setup B - DIV SHORT" ⭐ recommended
- "Setup C - BOUNCE LONG" / "Setup C - BOUNCE SHORT"
Combined alerts:
- "ANY LONG" — fires on any long signal
- "ANY SHORT" — fires on any short signal
Recommended alert setup:
- Create "Setup B - DIV LONG" and "Setup B - DIV SHORT" alerts
- These are the highest probability signals
- Set "Once Per Bar Close" to avoid false alerts
═══════════════════════════════════════════════════════════════════
VISUALIZATION SETTINGS
Show Labels on Chart:
Toggle on/off the signal labels (green/red)
Disable for cleaner chart once you're familiar with the indicator
Show Higher TF STC:
Toggle the orange dots showing higher timeframe STC
Useful for visual confirmation of multi-timeframe alignment
Info Panel:
Cannot be disabled — always shows current status
Positioned top-right to avoid chart interference
═══════════════════════════════════════════════════════════════════
EXAMPLE TRADE WALKTHROUGH
SETUP B DIVERGENCE LONG EXAMPLE:
1. Market Context:
- Price in downtrend, below 50 EMA
- Multiple lower lows forming
- STC below 25 (oversold)
2. Divergence Formation:
- Price makes new low at $45.20
- Force Index refuses to make new low (higher low forms)
- This indicates selling pressure weakening
3. Signal Trigger:
- STC starts turning up
- Force Index crosses above zero
- Label appears: "LONG B DIV"
4. Trade Execution:
- Entry: $45.50 (current price at signal)
- Stop Loss: $44.80 (below divergence low)
- Target 1: $47.90 (STC reaches 75) — risk/reward 1:3.4
- Target 2: Opposite signal or trail stop
5. Trade Management:
- Price rallies to $47.20
- STC reaches 68 (approaching target zone)
- Take 50% profit, move stop to breakeven
- Exit remaining at $48.10 when STC crosses 75
Result: 3.7R gain
═══════════════════════════════════════════════════════════════════
ADVANCED TIPS
1. MULTI-TIMEFRAME CONFLUENCE
For highest probability trades, wait for:
- Primary TF signal
- Higher TF STC aligned (>25 for longs, <75 for shorts)
- Even higher TF trend in same direction (manual check)
2. VOLUME CONFIRMATION
Watch the Force Index histogram:
- Increasing bar size = Strengthening momentum
- Decreasing bar size = Weakening momentum
- Use this to gauge signal strength
3. AVOID THESE MARKET CONDITIONS
- Major news events (Force Index becomes erratic)
- Market open first 30 minutes (volatility spikes)
- Low liquidity instruments (Force Index unreliable)
- Extreme trending days (wait for pullbacks)
4. COMBINE WITH SUPPORT/RESISTANCE
Best signals occur near:
- Key horizontal levels
- Fibonacci retracements
- Previous day's high/low
- Psychological round numbers
5. SESSION AWARENESS
- Asia session: Use lower timeframes, Setup C works well
- London session: Setup A and B both effective
- New York session: All setups work, highest volume
═══════════════════════════════════════════════════════════════════
INDICATOR WINDOWS LAYOUT
MAIN CHART:
- Price action
- 50 EMA (green/red)
- Signal labels
- Info panel
INDICATOR WINDOW:
- STC oscillator (blue line, 0-100 scale)
- Higher TF STC (orange dots, optional)
- Force Index histogram (green/red bars)
- Reference levels (25, 50, 75)
- Background zones (green oversold, red overbought)
═══════════════════════════════════════════════════════════════════
PERFORMANCE OPTIMIZATION
For best results:
Backtesting:
- Test on your specific instrument and timeframe
- Adjust STC parameters if win rate < 55%
- Record which setup works best for your market
Position Sizing:
- Risk 1-2% per trade
- Setup B can use 2% risk (higher win rate)
- Setup C should use 1% risk (lower win rate)
Trade Frequency:
- Setup B: 2-5 signals per week (be patient)
- Setup A: 5-10 signals per week
- Setup C: 10+ signals per week (scalping)
═══════════════════════════════════════════════════════════════════
CREDITS & REFERENCES
This indicator builds upon established technical analysis concepts:
Schaff Trend Cycle:
- Developed by Doug Schaff (1996)
- Original concept published in Technical Analysis of Stocks & Commodities
- Implementation based on standard STC formula
Force Index:
- Developed by Dr. Alexander Elder
- Described in "Trading for a Living" (1993)
- Classic volume-momentum indicator
The multi-timeframe integration, three-setup system, and specific
entry conditions are original contributions of this indicator.
═══════════════════════════════════════════════════════════════════
DISCLAIMER
This indicator is a technical analysis tool and does not guarantee profits.
Past performance is not indicative of future results. Always:
- Use proper risk management
- Test on demo account first
- Combine with fundamental analysis
- Never risk more than you can afford to lose
═══════════════════════════════════════════════════════════════════
SUPPORT & QUESTIONS
If you find this indicator helpful, please:
- Leave a like and comment
- Share your feedback and results
- Report any bugs or issues
For questions about usage or optimization for specific markets,
feel free to comment below.
═════════════════════════════════════════════════════════════

Squeeze Hour Frequency [CHE]Squeeze Hour Frequency (ATR-PR) — Standalone — Tracks daily squeeze occurrences by hour to reveal time-based volatility patterns
Summary
This indicator identifies periods of unusually low volatility, defined as squeezes, and tallies their frequency across each hour of the day over historical trading sessions. By aggregating counts into a sortable table, it helps users spot hours prone to these conditions, enabling better scheduling of trading activity to avoid or target specific intraday regimes. Signals gain robustness through percentile-based detection that adapts to recent volatility history, differing from fixed-threshold methods by focusing on relative lowness rather than absolute levels, which reduces false positives in varying market environments.
Motivation: Why this design?
Traders often face uneven intraday volatility, with certain hours showing clustered low-activity phases that precede or follow breakouts, leading to mistimed entries or overlooked calm periods. The core idea of hourly squeeze frequency addresses this by binning low-volatility events into 24 hourly slots and counting distinct daily occurrences, providing a historical profile of when squeezes cluster. This reveals time-of-day biases without relying on real-time alerts, allowing proactive adjustments to session focus.
What’s different vs. standard approaches?
- Reference baseline: Classical volatility tools like simple moving average crossovers or fixed ATR thresholds, which flag squeezes uniformly across the day.
- Architecture differences:
- Uses persistent arrays to track one squeeze per hour per day, preventing overcounting within sessions.
- Employs custom sorting on ratio arrays for dynamic table display, prioritizing top or bottom performers.
- Handles timezones explicitly to ensure consistent binning across global assets.
- Practical effect: Charts show a persistent table ranking hours by squeeze share, making intraday patterns immediately visible—such as a top hour capturing over 20 percent of total events—unlike static overlays that ignore temporal distribution, which matters for avoiding low-liquidity traps in crypto or forex.
How it works (technical)
The indicator first computes a rolling volatility measure over a specified lookback period. It then derives a relative ranking of the current value against recent history within a window of bars. A squeeze is flagged when this ranking falls below a user-defined cutoff, indicating the value is among the lowest in the recent sample.
On each bar, the local hour is extracted using the selected timezone. If a squeeze occurs and the bar has price data, the count for that hour increments only if no prior mark exists for the current day, using a persistent array to store the last marked day per hour. This ensures one tally per unique trading day per slot.
At the final bar, arrays compile counts and ratios for all 24 hours, where the ratio represents each hour's share of total squeezes observed. These are sorted ascending or descending based on display mode, and the top or bottom subset populates the table. Background shading highlights live squeezes in red for visual confirmation. Initialization uses zero-filled arrays for counts and negative seeds for day tracking, with state persisting across bars via variable declarations.
No higher timeframe data is pulled, so there is no repaint risk from external fetches; all logic runs on confirmed bars.
Parameter Guide
ATR Length — Controls the lookback for the volatility measure, influencing sensitivity to short-term fluctuations; shorter values increase responsiveness but add noise, longer ones smooth for stability — Default: 14 — Trade-offs/Tips: Use 10-20 for intraday charts to balance quick detection with fewer false squeezes; test on historical data to avoid over-smoothing in trending markets.
Percentile Window (bars) — Sets the history depth for ranking the current volatility value, affecting how "low" is defined relative to past; wider windows emphasize long-term norms — Default: 252 — Trade-offs/Tips: 100-300 bars suit daily cycles; narrower for fast assets like crypto to catch recent regimes, but risks instability in sparse data.
Squeeze threshold (PR < x) — Defines the cutoff for flagging low relative volatility, where values below this mark a squeeze; lower thresholds tighten detection for rarer events — Default: 10.0 — Trade-offs/Tips: 5-15 percent for conservative signals reducing false positives; raise to 20 for more frequent highlights in high-vol environments, monitoring for increased noise.
Timezone — Specifies the reference for hourly binning, ensuring alignment with market sessions — Default: Exchange — Trade-offs/Tips: Set to "America/New_York" for US assets; mismatches can skew counts, so verify against chart timezone.
Show Table — Toggles the results display, essential for reviewing frequencies — Default: true — Trade-offs/Tips: Disable on mobile for performance; pair with position tweaks for clean overlays.
Pos — Places the table on the chart pane — Default: Top Right — Trade-offs/Tips: Bottom Left avoids candle occlusion on volatile charts.
Font — Adjusts text readability in the table — Default: normal — Trade-offs/Tips: Tiny for dense views, large for emphasis on key hours.
Dark — Applies high-contrast colors for visibility — Default: true — Trade-offs/Tips: Toggle false in light themes to prevent washout.
Display — Filters table rows to focus on extremes or full list — Default: All — Trade-offs/Tips: Top 3 for quick scans of risky hours; Bottom 3 highlights safe low-squeeze periods.
Reading & Interpretation
Red background shading appears on bars meeting the squeeze condition, signaling current low relative volatility. The table lists hours as "H0" to "H23", with columns for daily squeeze counts, percentage share of total squeezes (summing to 100 percent across hours), and an arrow marker on the top hour. A summary row above details the peak count, its share, and the leading hour. A label at the last bar recaps total days observed, data-valid days, and top hour stats. Rising shares indicate clustering, suggesting regime persistence in that slot.
Practical Workflows & Combinations
- Trend following: Scan for hours with low squeeze shares to enter during stable regimes; confirm with higher highs or lower lows on the 15-minute chart, avoiding top-share hours post-news like tariff announcements.
- Exits/Stops: Tighten stops in high-share hours to guard against sudden vol spikes; use the table to shift to conservative sizing outside peak squeeze times.
- Multi-asset/Multi-TF: Defaults work across crypto pairs on 5-60 minute timeframes; for stocks, widen percentile window to 500 bars. Combine with volume oscillators—enter only if squeeze count is below average for the asset.
Behavior, Constraints & Performance
Logic executes on closed bars, with live bars updating counts provisionally but finalizing on confirmation; table refreshes only at the last bar, avoiding intrabar flicker. No security calls or higher timeframes, so no repaint from external data. Resources include a 5000-bar history limit, loops up to 24 iterations for sorting and totals, and arrays sized to 24 elements; labels and table are capped at 500 each for efficiency. Known limits: Skips hours without bars (e.g., weekends), assumes uniform data availability, and may undercount in sparse sessions; timezone shifts can alter profiles without warning.
Sensible Defaults & Quick Tuning
Start with ATR Length at 14, Percentile Window at 252, and threshold at 10.0 for broad crypto use. If too many squeezes flag (noisy table), raise threshold to 15.0 and narrow window to 100 for stricter relative lowness. For sluggish detection in calm markets, drop ATR Length to 10 and threshold to 5.0 to capture subtler dips. In high-vol assets, widen window to 500 and threshold to 20.0 for stability.
What this indicator is—and isn’t
This is a historical frequency tracker and visualization layer for intraday volatility patterns, best as a filter in multi-tool setups. It is not a standalone signal generator, predictive model, or risk manager—pair it with price action, news filters, and position sizing rules.
Disclaimer
The content provided, including all code and materials, is strictly for educational and informational purposes only. It is not intended as, and should not be interpreted as, financial advice, a recommendation to buy or sell any financial instrument, or an offer of any financial product or service. All strategies, tools, and examples discussed are provided for illustrative purposes to demonstrate coding techniques and the functionality of Pine Script within a trading context.
Any results from strategies or tools provided are hypothetical, and past performance is not indicative of future results. Trading and investing involve high risk, including the potential loss of principal, and may not be suitable for all individuals. Before making any trading decisions, please consult with a qualified financial professional to understand the risks involved.
By using this script, you acknowledge and agree that any trading decisions are made solely at your discretion and risk.
Do not use this indicator on Heikin-Ashi, Renko, Kagi, Point-and-Figure, or Range charts, as these chart types can produce unrealistic results for signal markers and alerts.
Best regards and happy trading
Chervolino
Thanks to Duyck
for the ma sorter

Iani SMC Sniper XAU v2.2 (Long+Short + News Countdown, v6)Iani SMC Sniper v2.6 — Anytime • Auto Pip • FVG 50% • OB • News Panel
Smart-Money Concepts made simple for intraday XAU/USD (works on any symbol).
Finds BOS, 50% FVG “sniper” entries, optional Order Blocks, London H/L, news countdown, and a mini info panel.
What it does
BOS (Break of Structure): detects bullish/bearish BOS after London sweep logic.
FVG 50% entries: plots precise long/short entry dots at the midpoint of the gap.
Auto TP/SL: TP = RR × risk, SL below/above recent swing with a small buffer.
Order Blocks (optional): marks the last opposite candle after BOS and alerts on OB revisit.
London High/Low: tracks session range; session filter is optional.
News countdown: shows next event time and minutes left (user-selectable timezone).
Mini Panel: top-left table with Trend (last BOS), Next news, R:R, Pip size.
Inputs (key)
Auto pip size: uses syminfo.mintick. Manual override available.
Risk:Reward (RR): default 2.0.
Pivot length: swing sensitivity.
Sessions: enable if you want signals only 12:00–20:00 (symbol timezone). Off = anytime.
News timezone: pick your own (e.g., Europe/Brussels, America/New_York).
Absolute & daily times: add your events (strings like 2025-09-17 20:00 or 14:30,16:00…).
Show labels/levels/OBs: toggle on/off.
Alerts included
BOS Bullish / BOS Bearish
BUY Entry / SELL Entry (return to 50% FVG)
Bullish OB revisit / Bearish OB revisit
TP Long/Short reached, SL Long/Short hit
NEWS WARNING (warning window only; does not block signals)
To use: Add Alert → Condition: this indicator → choose any of the alertconditions.
Best use
Bias: H1 for structure.
Execution: M15 (standard) or M5 (aggressive).
Works great on XAUUSD, but is symbol-agnostic (auto pip adapts).
Notes
News times display in the timezone you pick in settings.
OBs are a simple implementation meant for quick visual guidance.
Labels: BUY/SELL near entries, TP/SL on set and when hit, BOS up/down.
Risk disclaimer
This tool is for education only. Not financial advice. Backtest and manage risk.

Trend-Strong Candle - 3 EMAs with Filters# Trend-Strong Candle - Professional Trading Indicator
## 📊 What It Does
Identifies high-probability entries by combining triple EMA trend analysis with strong candle detection. Only signals when all conditions align for maximum accuracy.
## 🎯 Core Features
- Triple EMA System: Fast (20) / Medium (50) / Slow (200) for trend confirmation
- Strong Candle Filter: ATR-based sizing ensures genuine momentum
- Advanced Filters: EMA close validation + trend stability checks
- Live Alerts: Instant notifications for real-time signals
- Session Filter: Trade only during active EU/US market hours
## ⚡ Quick Setup
Scalping (1-5min): Default settings + enable session filter
Day Trading (15-60min): Default settings work perfectly
Swing Trading (4H+): Increase ATR multiplier to 0.8-1.0
## 📈 Trading Rules
Long Signals: Green triangle below candle
- Strong bullish candle during confirmed uptrend
- All EMAs properly aligned (Fast > Medium > Slow)
Short Signals: Red triangle above candle
- Strong bearish candle during confirmed downtrend
- All EMAs properly aligned (Fast < Medium < Slow)
## ⚠️ Critical Success Factors
1. Always Verify the Trend Yourself
The indicator helps identify signals, but YOU must confirm the larger trend context. Check higher timeframes and overall market structure before entering.
2. Understand the "Big Players"
Strong candles in trend direction usually come from institutional money (banks, funds, algorithms). These create the momentum that retail traders can follow. The indicator catches these institutional moves.
3. Distance to Next Value Level
NEVER enter if price is too close to major resistance/support levels:
- Check distance to round numbers (1.1000, 1.1050, etc.)
- Ensure at least 20-30 pips room to next key level
- You need space for profit - tight levels = limited upside
4. Risk Management
- Stop Loss: 1-2 ATR from entry
- Take Profit: 2-3 ATR target (minimum 1:2 R/R)
- Position Size: Risk max 1-2% per trade
## 💡 Pro Tips
- Best Sessions: London open (8-12 UTC) and NY open (13-17 UTC)
- Avoid: Major news, low liquidity periods, choppy markets
- Multiple Timeframes: Confirm signals on higher timeframe
- Value Levels: Always check daily/weekly support/resistance before entering
## 🎯 Success Formula
Trend Confirmation + Strong Institutional Candle + Distance to Value Levels = High Probability Trade
*
Remember: The indicator finds the signals, but successful trading requires your analysis of trend context and value level positioning. Trade smart, not just frequent.

Time Based Range CandleThis indicator creates a visual candle representation from price action during a specified time period.
Key Features:
Configurable Sessions: Set any calculation period (when range is measured) and display period (when visualization appears)
Candle Visualization: Draws a large candle showing open, close, high, low with proper body coloring
Wick/Tail Analysis: Displays wicks and tails with quarter-level subdivisions based on candle type (bullish vs bearish)
End Marker: Vertical line marks exactly when the calculation period ends
Quarter Lines: Optional dotted/dashed lines showing 25%, 50%, 75% levels within body, wicks, and tails
Common Use Cases:
Overnight range analysis (18:00 - 6:00 ET) displayed during regular hours
Session-based range trading (Asian, London, NY sessions)
Custom time period analysis for any market
The indicator follows proper candle terminology where wicks and tails are measured differently for bullish vs bearish candles, making it useful for precise level analysis and range trading strategies.

GeeksDoByte 15m & 30m ORB + Prev Day High/LowCME_MINI:NQ1!
How It Works
Opening Ranges
At 9:30 ET, the script begins tracking the high & low.
It uses two fixed sessions:
15 min from 09:30 to 09:45
30 min from 09:30 to 10:00
On the very first bar of each session it initializes the range, then continuously updates the high/low on each new intraday bar.
Dashed lines are drawn when the session opens and extended horizontally across subsequent bars.
Previous Day’s Levels
Independently, it fetches yesterday’s high and low via a daily security call.
These historic levels are plotted as simple horizontal lines for daily context.
How to Use
Breakout Entries
A close above the 15 min ORB high can signal an early breakout; a further push above the 30 min ORB high confirms extended momentum.
Conversely, breaks below the respective lows can indicate short setups.
Support & Resistance
Yesterday’s high/low often act as magnet levels. If price is near the previous high when the opening ranges break, you get a confluence zone worth watching.
Trade Management
Combine the two opening-range levels to tier your stops or scale in.
For example, you might place an initial stop below the 15 min low and a wider stop below the 30 min low.

LilSpecCodes1. Killzone Background Highlighting:
It highlights 4 key market sessions:
Killzone Time (EST) Color
Silver Bullet 9:30 AM – 12:00 PM Light Blue
London Killzone 2:00 AM – 5:00 AM Light Green
NY PM Killzone 1:30 PM – 4:00 PM Light Purple
Asia Open 7:00 PM – 11:00 PM Light Red
These are meant to help you focus during high-probability trading times.
__________________________________________________
2. Previous Day High/Low (PDH/PDL):
Plots green line = PDH
Plots red line = PDL
Tracks the current day’s session high/low and sets it as PDH/PDL on a new trading day
CHANGES WITH ETH/RTH
3. Inside Bar Marker:
Plots a small black triangle under bars where the high is lower than the previous bar’s high and the low is higher than the previous bar’s low (inside bars)
Useful for spotting potential breakout or continuation setups
4. Vertical Time Markers (White Dashed Lines)
Time (EST) Label
4:00 AM End of London Silver Bullet
9:30 AM NYSE Open
10:00 AM Start of NY Silver Bullet
11:00 AM End of NY Silver Bullet
11:30 AM (Customizable Input)
3:00 PM PM Killzone Ends
3:15 PM Futures Market Close
7:15 PM Asia Session Watch
