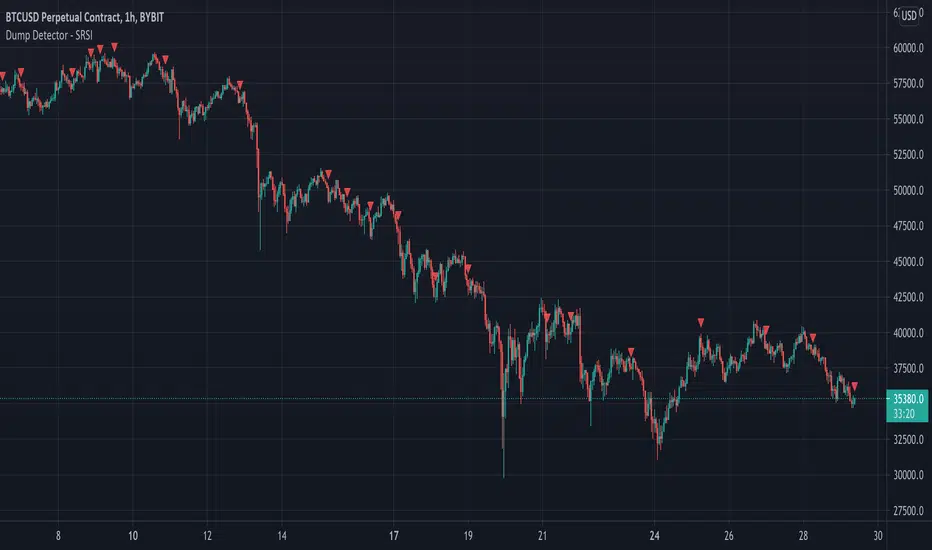
Dump Detector - Stochastic RSIDump Detecter uses Stochastic RSI to detect dumps/downtrends. Can be used as an exit trigger for long bots or an entry trigger for short bots. Change settings to lower timeframe for scalping. Pump signals can be turned on with tickbox.
Default Settings are not the usual Stochastic RSI setup and have been tuned to bitcoin 3hr chart:
Timeframe = 3hrs
smoothK = 3
smoothD = 3
lengthRSI = 6
lengthStoch = 27
src = close
스크립트에서 "scalping"에 대해 찾기
3x SuperTrend Strategy (Mel0nTek) V1This is a triple SuperTrend based strategy for lower time frame trades such as day trades and scalping. I have not seen many strategies that combine multiple SuperTrends so I thought I would publish this one since I put it together and have been quite happy with the results. I have found through testing that the best results are on currency exchange markets such as Crypto or Forex on 1-15 min time frames.
The core idea was inspired by a youtube video put out by Trade Pro:
"Trade Pro - HIGHEST PROFIT Triple Supertrend Trading Strategy Proven 100 Trade Results"
I went ahead and set the defaults to the ones he uses in his video for anyone who wants to try a configuration similar to his. They work pretty well in general, however the EMA, SuperTrend ATR multipliers, and P/L ratio can be tuned/optimized to fit the timeframe/market desired. The video is quite good but not a required watch as I will explain below.
The 200EMA is used as a medium-term trend direction indicator.
- Price closing consistently above the 200EMA means that only long positions should be entered.
- Price closing consistently below 200EMA means that only short positions should be entered.
The 3 SuperTrend indicators should be used as direction confirmation for entries. Typically, price above SuperTrend indicates bullish movement, while price below SuperTrend indicates Bearish movement. However by itself, it is not a great indication to enter/exit positions in my experience. By combining 3 of them with slightly longer periods and increased ATR multipliers, we can get much stronger confirmation of trend direction/strength.
The way they are used in this strategy is such that:
- We only want to enter a position if at least 2 out of 3 SuperTrends are on our side.
- 3/3 SuperTrends on our side is the best case, since we are taking trades WITH momentum/price strength.
- The second farthest SuperTrend from entry price is used as a Stop Loss
SuperTrend being on our side is not the only requirement for an entry however. The probability of success is increased with SuperTrend, and a longer EMA on our side, but we want to be sure that we aren't getting in too late/after the movement has already happened.
So we use Stoch RSI to pick our entries where price is oversold/overbought and reversing. That means the Stoch RSI is above 80, or below 20, and our indication to enter the trade is when the 2 lines cross/begin reversing direction.
So with trend direction on our side, we can get really good entries at these oversold/overbought extremes, especially as it's reversing (Stoch RSI K and D are crossing). This allows us to use the SuperTrend as a support/stop loss on our entry since price should be above it.
Then we just target 1.5x our max loss so that even if we only win 50% of the time, we still make a profit.
The explicit rules of this strategy are as follows:
=== Rules ===
long only
- price above EMA200
short only
- price below EMA200
Stop Loss = 2nd SuperTrend line above (short) or below(long) entry candle
Profit = 1.5x SL/risk (Profit Ratio x Max Loss)
=== Entry Setup ===
LONG
- Stoch RSI below 20, cross up
- at least 2 SuperTrend lines below close
SHORT
- Stoch RSI above 80, cross down
- at least 2 SuperTrend lines above close
P.S. Special thanks to Trade Pro for producing so many quality videos, putting strategy claims to the test, and providing me with so many good ideas I apply to my own strategies.

P/L CalculatorI couldn't find an existing indicator that simply calculated profit and loss, so here's one for quick, visual P/L. My api's lag too much to this helps while scalping.

Inverse BandsThis was the result of quite some time spent examining how much information could be gleamed by studying the interactions between Keltner Channels, STARC Bands and Bollinger Bands. I was surprised by the results.
First of all, there are four fills that are black. Set the transparency of those to 0 and you'll see this indicator the way that it's meant to be seen. Those fills belong to unused sections of the Bollinger Bands.
There are two clouds which represent STARC Bands and the Keltner Channel. There is some delay when they flip from bullish (green) to bearish (red), but they are indicative of the trend. The space between them is black and the narrower that space is, the greater volatility is. Because of this, we don't need the exterior Bollinger Bands.
The Bollinger Bands remain visible as the yellow interior clouds on the top cloud and the blue interior clouds on the bottom cloud. Often, the thicker the yellow or blue cloud is, the less severe a throwback from a given trend reversal will be. Often the thinner that yellow or blue cloud is, the more severe the trend reversal will be. If price is rising into a thin interior yellow cloud, the following dip will be substantial. If price action dips towards a thicker interior blue cloud, often the pump following that dump will be less enthusiastic.
We preserve the Keltner Channel and STARC bands as our cloud because the way that they interact with the three basis lines yields a lot of information.
The yellow Bollinger basis line tells us about trend strength. The closer the BB basis line is to the top of the top cloud or the bottom of the bottom cloud, the stronger the trend is. When it enters the cloud very close to the bottom of the bottom cloud, you know you're looking at a strong pump, and vice versa when it's close to the top of the top cloud.
The purple Keltner Channel basis line and orange STARC Band basis line can forecast short term trend changes one candlestick in advance by contacting any line in either cloud. The moment either basis line touches or crosses any boundary of the clouds, you know that the next candle will change directions. In an uptrend, a touch or cross means the next candle will have a lower high point. In a downtrend, a cross or touch means the next candle will have a higher high point. This is most useful in scalping.
It'd be pretty easy to slap some crossover alerts on to this and useful considering that they come a candle in advance. Feel free to further explore and develop this.

Phoenix Ascending 2.201Hi Everyone!
It's time to make this indicator public to relieve myself of replying to requests for access. There has been an update to this indicator; in which a Stochastic RSI was added to this indicator. Please follow the directions to SETUP the indicator in the SETUP VIDEO provided below.
Phoenix Ascending 2.201 and Bollinger Bands Setup Video.
The following are BASIC rules for the Phoenix 2.201 Indicator. More advanced rules and the requirements for those rules can be found in my publications in my public profile. Unfortunately, I do not have organized videos created on how to use this indicator in full but will be available in the future.
IMPORTANT: The BASIC rules below are beneficial but these are NOT all the rules. More rules and requirements for those rules will be available in the future.
RULE NO. 1
We PREFER the Blue LSMA to be at 80% or higher for SAFE EXIT (SHORT) bets.
We PREFER the Blue LSMA to be at 20% or lower for SAFE ENTRY (LONG) bets.
Rule No. 2
ANY time the red line is approaching a green line that’s moving UPWARD,
Be prepared to make an ENTRY (LONG) when the red line is about to touch the green line that’s moving upward.
One can look at a lower time frame to get a better idea of how much longer you may have
To wait for the red line to touch the green line. In many cases, you may make ENTRY (LONG)
Just before the red line actually touches the green line that’s moving up in that higher time frame
You were initially using as your COMPASS. I currently have the 1-Month TF as a compass for EURUSD.
Rule No. 3
ANY time the red line is approaching a green line that’s moving DOWNWARD,
Be prepared to make an EXIT (SHORT) when the red line is about to touch the green line that’s moving downward.
One can look at a lower time frame to get a better idea of how much longer you may have
To wait for the red line to touch the green line. In many cases, you may make your EXIT (SHORT)
Just before the red line actually touches the green line that’s moving downward in that higher time frame
You were initially using as your COMPASS. I currently have the 1-Month TF as a compass for EURUSD.
Rule No. 4
The Green Line and/or Ghost Line can often help one determine when an upward or downward move in a particular time frame
Is nearly exhausted and about to reverse.
Example for Upside Exhaustion about to reverse to the Downside:
When the Green Line and/or Ghost line is at 80% level or higher, this is a good indicator to inform
Us the current upside move may be approaching exhaustion. You can look at a higher time frame to try to gain
More insight as to whether this will only be a brief dip down in the lower time frame IF the higher time frame you
Went to reveals there is a lot more room remaining for the Green and/or Ghost Lines to reach the 80% or higher level.
Example for Downside Exhaustion about to reverse to the Upside:
When the Green Line and/or Ghost line is at 20% level or lower, this is a good indicator to inform
Us the current downside move may be approaching exhaustion. You can look at a higher time frame to try to gain
More insight as to whether this will only be a brief dip up in the lower time frame IF the higher time frame you
Went to reveals there is a lot more room remaining for the Green and/or Ghost Lines to reach the 20% or lower level.
Rule No. 5
The same rules you see in Rule No. 4 also apply to the Stochastic RSI. Keep in mind I changed the colors of the
Stochastic RSI to the following: Red default changed to Purple and Blue changed changed to Black to avoid confusing
Them with the lines in Godmode.
When the Stochastic RSI is at 80% or higher level, we need to be on guard for a reversal to the downside.
When the Stochastic RSI is at 20% or lower level, we need to be on guard for a reversal to the upside.
EXTREMELY IMPORTANT to apply these rules in GROUPS OF TIME FRAMES.
"TYPES" OF TIME FRAME GROUP TRADING SIGNALS
Scalping Group Signals: Signals provided for this group involve analyzing the following two groups of time frames. Short Term Group as a compass and Scalping Group for confirmation and more precise entry/exit.
Scalping Group: 6min. 12min. 23min & 45min.
Short Term Group: 90min. 3hr. 6hr. & 12hr.
Short Term Group Signals: Signals provided for this group involve analyzing the following two groups of time frames. NearTerm Group as a compass and Short Term Group for confirmation and more precise entry/exit.
Short Term Group: 90min. 3hr. 6hr. & 12hr.
Near Term Group: 24hr. 2-Day, 3-Day & 4-Day
Near Term Group Signals: Signals provided for this group involve analyzing the following two groups of time frames. Mid Term Group as a compass and Near Term Group for confirmation and more precise entry/exit.
Near Term Group: 24hr. 2-Day, 3-Day & 4-Day
Mid Term Group: 3-Day, 6-Day, 9-Day & 12-Day
Mid Term Group Signals: Signals provided for this group involve analyzing the following two groups of time frames. Long Term Group as a compass and Mid Term Group for confirmation and more precise entry/exit.
Mid Term Group: 3-Day, 6-Day, 9-Day & 12-Day
Long Term Group: 1-Week, 2-Week, 3-Week & 4-Week
Long Term Group Signals: Signals provided for this group involve analyzing the following two groups of time frames. Macro Term Group as a compass and Long Term Group for confirmation and more precise entry/exit.
Long Term Group: 1-Week, 2-Week, 3-Week & 4-Week
Macro Term Group: 1-Month, 2-Month, 3-Month & 4-Month
Macro Term Group Signals: Signals provided for this group involve analyzing the following two groups of time frames. Macro Term Group as a compass and Long Term Group for confirmation and more precise entry/exit.
Macro Term Group: 1-Month, 2-Month, 3-Month & 4-Month
Super Macro Group: 3-Month , 6-Month, 12-Month & 24-Month

Trend Risk Indicator (TRI)The Trend Risk Indicator is a simple bands indicator made of 2 custom averages of candlesticks ranges calculated within the variable “ BandBars ” period.
Upper and lower channel bands width can be adjusted with the “ Deviation ” variable, which act as a simple factor to enlarge the spread between them.
When Close crosses over the upper band, it is a bearish signal and candlesticks are painted in Red.
When Close crosses under the lower band, it’s a bullish signal and candlesticks are painted in Green.
One of the most interesting indicators for 1 minute scalping. Recommended to use on Renko bars.
*drag to chart and pin to scale, also remove borders from candlesticks.

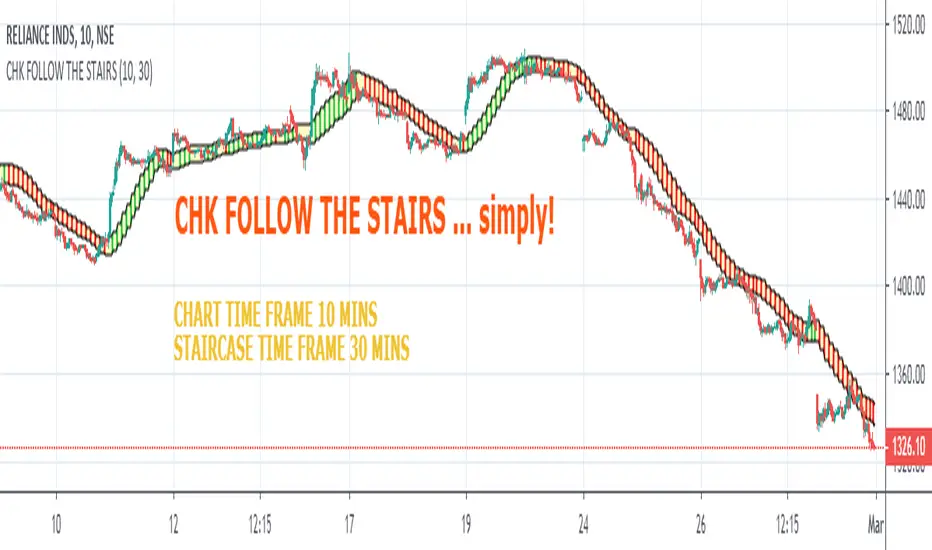
CHK FOLLOW THE STAIRSCHK FOLLOW THE STAIRS....
The stairs are nothing but HIGH LOW CHANNEL at HTF or LTF
I observed 10 Period Moving Average an optimum length for the Staircase
you can change it to 8 or 13, one will generate noise, other will generate lag
Tinker with the Staircase Time Frame to get an optimum fit
The script also shows Strength of the Trend.
If there is a gap between the price and the stairs, that is relection of the strength
The script can also be used for scalping.
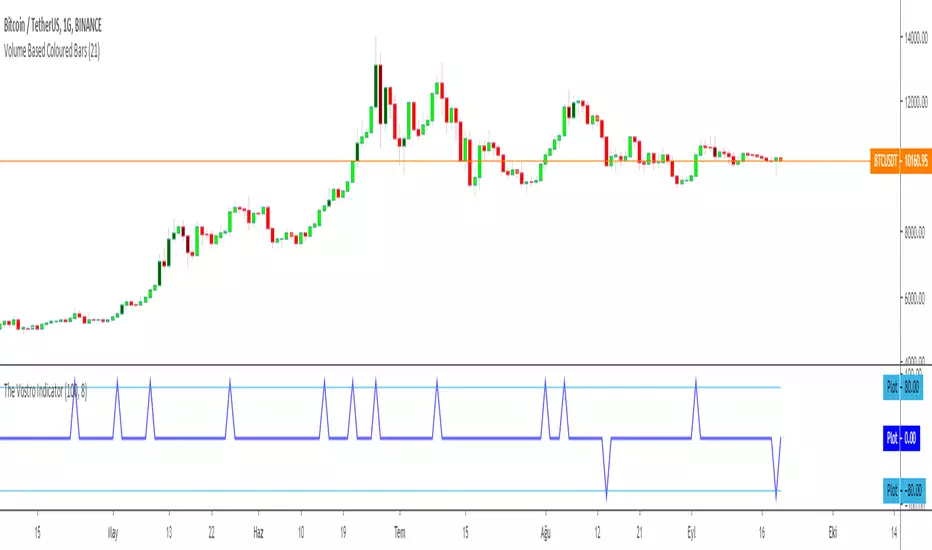
The Vostro Indicator by KIVANÇ fr3762The VOSTRO indicator is a trend indicator that automatically provides buying and selling signals. The indicator marks in a window the potential turning points. The indicator is recommended for scalping.
The Vostro indicator determines the overbought zones (value greater than +80) and the oversold zones (less than the -80 level)
BUY signal: The Vostro curve moves below the -80 level and forms a trough – Turnaround of the upward trend
SELL signal: The Vostro curve moves above the +80 level and forms a peak – Downward trend
further info:
www.prorealcode.com
Here's the link to a complete list of all my indicators:
t.co
Yazar: KıvanÇ @fr3762 twitter
Şimdiye kadar paylaştığım indikatörlerin tam listesi için: t.co
Relative Vigor IndexHere we are looking at a trend strength indicator based on the Relative Vigor Index(RVI). The RVI measures trend strength by comparing the open-close and high-low ranges for the current and three most recent periods. As a zero-centered oscillator, the RVI oscillates above and below zero to signal the strength of the trend.
As there are different ways to interpret the RVI, we have included 3 different modes for traders to choose from in the input option menu:
1. Zero-Crossing:
The RVI Histogram will turn green when it crosses above zero and red when it crosses below. Therefore, a green RVI means the trend is bullish and red means bearish. This mode is better for longer-term swing trading in comparison to the other 2 modes.
2. Increasing / Decreasing:
The RVI histogram will turn green when it is increasing(rvi >= rvi ) and red when it is decreasing. A green RVI is viewed as a bullish signal and red means bearish. This mode is a good middle-ground between the Zero-Crossing and Signal Comparison modes.
3. Signal Comparison:
Here, the RVI is compared to its signal line. If the RVI is greater than its signal line, the histogram is green, indicating a bullish trend, while red means bearish. This mode is preferred for scalping.
Hope everyone finds this one useful!
You can check out our other invite only studies/strategies at our website: profitprogrammers.com

[M10] Quad MA Trend ScalperFour adjustable moving averages set in order to produce buy and sell signals, works best on smaller timeframes from my backtesting, 10M - 30M seems optimal for scalping.
The idea behind this script is to only enter positions that are following the trend in order to minimise drawdown and decrease risk when using leverage.
The script will only enter long positions when MA crossover occurs above the Long MA 2.
The script will exit a long position when MA Short crosses below Long MA 1.
The script will only enter short positions when MA cross under occurs below the Long MA 2.
The script will exit a short position when MA Short crosses below Long MA 1.
Key Levels [@treypeng]Draws horizontal lines for Daily, Hourly (1) and Weekly levels. Really handy to switch on quickly when scalping.
Light blue: Previous hour OHLC
Thick light blue: Previous hour Close / current hour Open
Dark blue: Yesterday OHLC
Thick dark blue: Yesterday Close / today Open
Purple: Weekly Open
It's a bit ugly, I'd prefer horizontal rays instead of lines stretching back across the chart but I couldn't figure out how to do this in PineScript. If I get it sorted, I'll publish an update.

Adjustable Fibonacci LevelsThe Adjustable Fibonacci Levels script allows you to retrieve Fibonacci levels for x days back. This might come in handy when scalping. Shoutout to u/Autemox for the inspiration!

SHERRIFx (variation) IN TRENDI share this script where I made some modifications to the SHERRIF strategy to perform trend scalping.
I use:
- Bollinguer Bands (20)
- CCIs (14 and 40)
- EMAS (20, 57, 100, 200)
- Stochastics (13,3,3) in 70, 30.
I apply in low temporalities, especially M15 and M1, it can also be used to make binaries or in higher temporalities by modifying the constants.
If you improve this program, share it.
Greetings.

Two Bar Break Line Alerts R1.0 by JustUncleLThis indicator with default settings is designed for BINARY OPTIONS trading. The indicator can also be used for Forex trading with some setting changes. The script shows Two Bar Pullback Break lines and alerts when those Break lines are Touched (broken) creating a short term momentum entry condition.
For a Bullish Break (Green Up Arrow) to occur: first must have two (or three) consecutive bear (red) candles which is followed by a bull (green) candle creating a pivot point. The breakout occurs then the High of the current Bull (green) exceeds the highest point of the previous two (or three) pivotal bear candles. The green channel Line shows where the current Bullish BreakOut occurs.
For a Bearish Break (Red Down Arrow) to occur: first must have two (or three) consecutive bull (green) candles which is followed by a bear (red) candle creating a pivot point. The breakout occurs when the Low of the current Bear (red) drops below the lowest point of the previous two (or three) pivotal Bull candles. The red channel Line shows where the current Bearish BreakOut occurs.
The break Line Arrows can optionally be filtered by the Coloured MA (enabled by default), a longer term directional MA (disabled by default) and/or a MACD condition (enabled by default) as a momentum filter.
You can optionally select three Bar break lines instead of two. The three bar break lines are actually equivalent to Guppy's Three Bar Count Back Line method for trade entries (see Guppy's video reference below).
Included in this indicator is an ability to display some basic Binary Option statistics, when enabled (enabled by default) it shows Successful Bars in Yellow and failed Bars in Black and the last Nine numbers on the script title line represent the Binary option Statistics in order:
%ITM rate
Total orders
Successful Orders
Failed Orders
Total candles tested
Candles per Day
Trades per Day
Max Consecutive Wins
Max Consecutive Losses
You can start the Binary Option statistics from a specific Date, which is handy for checking more recent history.
HINTS:
BINARY OPTIONS trading: use 5min, 15m, 1hr or even Daily charts. Trade after the price touches one of the Breakout lines and the Arrow first appears. Wait for the price to come back from Break Line by 1 or 2 pips, the alert arrow must stay on and candle change to black, then take Binary trade expiry End of Candle. If price pull back and arrow turns off, don't trade this candle, move on you probably don't have momentum, there will be plenty of other trigger events. The backtesting results are good with ITM rates 65% to 72% on many currency pairs, commodities and indices. Realtime trading has confirmed the backtesting results and they could even be bettered, provided you are selective on which signals to trade (strong MACD support etc), that you are patient and disciplined to this trading method.
FOREX trading: the default settings should work with scalping. For longer term trades try with settings change to a more standard MACD filter or slower to catch the longer term momentum swings and the idea would be to trade the first Break Line alert that occurs after a decent Pullback in the direction of the trend. Setting the SL to just above/below the Pivot High/Low and set target to two or three times SL.
References:
"Fundamentals of Price Action Trading for Forex, Stocks, Options and Futures" video:
www.youtube.com
Other videos by "basecamptrading" on Naked Trading.
"Taking Profits in Today's Market by Daryl Guppy" video:
www.youtube.com

NG [Multi-Stochastics]Multiple stochastic script with trend direction.
* Each base shows 3 lines multiplied by 1.618
* Possible to chose how to calculate MA of stochastics SMA, EMA, DEMA, TEMA.
* Possible to chose how to calculate trend.
* Trend adjustment is to adapt to current situation not for signals
Fast stochastics gives a lot of noise but some times good for scalping.

Pivot Boss 4 EMA Summary:
Creates one indicator with four exponential moving averages based off the central pivot point
which assists you in trading pure price action using floor pivots.
This also helps you to avoid getting chopped up during price confluence.
How to use:
When T-Line cross Green Short EMA it can be used for scalping.
When Short EMA pulls back to Medium EMA you can buy more or sell more
without having to exit your position prematurely before trend direction changes.
This can also be used as position entry points to make sure you are getting the best possible price.
When T-Line, Short EMA and Medium EMA cross over Long EMA you go long or short.

Litronix Liquidity BlocksLitronix Liquidity Blocks is a session-based market structure indicator designed to highlight high-liquidity periods where institutional activity is most likely to occur.
The indicator plots price-anchored liquidity blocks based on key intraday sessions, automatically capturing each session’s high and low range and displaying it directly on the chart. All blocks are fully synchronized with price and time, ensuring precise interaction when navigating the chart.
Included Liquidity Blocks:
Asian Block – Asian session range
EU Block – Frankfurt liquidity window
NY Kill Block – High-volatility manipulation window
NY Block – New York session range
Lunch Block – Low-liquidity consolidation period
Key Features:
Session-based liquidity ranges (High / Low)
Price-anchored blocks that move precisely with the chart
Fully customizable session times and colors
Optional session labels
Clean, non-repainting logic
Optimized for intraday and scalping strategies
Best Use Cases:
Liquidity sweeps and stop-hunt detection
ICT / Smart Money Concepts
Intraday bias and session transitions
Scalping and day trading
Litronix Liquidity Blocks is built for traders who focus on where liquidity is taken, not where price is going.

Paulo - Volume Scalp AutoIndicator Name:
Paulo – Volume Scalp Auto (Crypto)
Description:
This indicator was developed for aggressive crypto scalping, with a focus on 1-minute charts and highly volatile altcoins.
It combines volume analysis, price action, and ATR-based volatility, automatically adjusting signal sensitivity depending on whether the market is in a normal or volatile regime.
The script detects relevant volume spikes relative to the moving average, helping filter out weak entries and highlighting potential short-term participation of large market players.
When volatility increases, the indicator automatically raises the volume threshold, reducing false signals that are common in fast-moving altcoins.
Key features:
• Automatic Normal vs. Volatile mode
• Dynamic volatility detection
• Visual buy and sell signals
• Native TradingView alerts
• Optimized for 1-minute crypto scalping
Disclaimer: This indicator is a decision-support tool only and does not constitute financial advice. Always use proper risk management.

Apex Wallet - MTF Trend Monitor: Unified Indicator DashboardOverview The Apex Wallet MTF Trend Meter is a powerful Multi-Timeframe (MTF) dashboard designed to provide a bird's-eye view of market conditions across several time intervals simultaneously. Instead of switching between charts, this tool presents a clean, real-time table directly on your workspace, allowing you to identify high-probability trade setups through timeframe alignment.
Multi-Layered Analysis The dashboard monitors and categorizes technical data into actionable color-coded cells:
Timeframe Master Trend: Tracks the core market direction using EMA filters (adjustable for Scalping, Day, or Swing trading).
Oscillator Confluence: Instant status of Stochastic (STO), RSI, MACD, and TDI.
Andean Oscillator: Specialized tracking for market states including Bullish, Bearish, Consolidating, or Reversing.
Market Volume Delta: Real-time institutional flow tracking with customizable modes (Buy/Sell, Neutral, or Auto).
Key Features:
Fully Customizable Grid: Toggle individual timeframes (from 1m up to 4h) and specific indicators to match your trading strategy.
Smart Adaptive Presets: One-click selection for Scalping, Day-Trading, or Swing-Trading automatically updates all internal indicator periods for optimized performance.
Trend-Filtered Signals: Momentum indicators are filtered by the master trend EMA to ensure signals are displayed only when aligned with the broader market direction.
Compact UI: Designed for efficiency, the dashboard sits discreetly on your chart while providing maximum data density.
How to Use: Identify "Vertical Confluence" where multiple timeframes align with the same color, indicating a high-conviction trend continuation or breakout.

Ultra-Fast Scalp Predictor - By Herman Sangivera ( Papua )Ultra-Fast Scalp Predictor - By Herman Sangivera ( Papuan Trader )
Overview
Ultra-Fast Scalp Predictor is a high-speed technical indicator specifically engineered for scalpers and day traders. Built on Pine Script V6, this tool specializes in identifying "Squeeze" phases—periods of market compression—and predicting the direction of the upcoming "explosion" before it happens.
The Problem It Solves
Most scalping indicators suffer from two issues: they are either too slow (Lagging) or too sensitive (Fake Signals). This script solves both by using a "Preparation -> Prediction -> Execution" workflow.
How It Works
Phase 1: Squeeze Detection (The Setup) The script monitors the volatility "coil" using Bollinger Bands and Keltner Channels. A Gray Background indicates a Squeeze. This is where the market is sideways, building energy.
Phase 2: Momentum Velocity (The Prediction) While the price is still sideways, the script uses Linear Regression Momentum and Price Velocity.
Aqua Circle (Early Ready Up): Momentum is shifting bullish inside the squeeze.
Orange Circle (Early Ready Down): Momentum is shifting bearish inside the squeeze.
Phase 3: Fast Breakout (The Execution) Once the squeeze "fires" and price crosses the bands, the script triggers a FAST BUY or FAST SELL signal.
Key Features
No-Lag HMA: Uses a 12-period Hull Moving Average for ultra-responsive trend tracking.
Squeeze Logic: Prevents you from overtrading in a "dead" market.
Predictive Signals: The "Early Ready" dots give you a split-second advantage over other traders.
Visual Clarity: Clean labels and shapes designed for 1-minute and 5-minute timeframes.
How to Trade with This Indicator
Step 1 (The Wait): Wait for the gray background (Squeeze).
Step 2 (The Hint): Look for the Aqua or Orange dots. These are your "get ready" warnings.
Step 3 (The Entry): Enter as soon as the FAST BUY (Lime) or FAST SELL (Red) triangle appears.
Step 4 (The Exit): Exit when the HMA line changes color or use a 1:1.5 ATR-based risk/reward ratio.
Settings Explained
Fast HMA Length: Default is 12. Lower = Faster, Higher = Smoother.
Squeeze Length: Default is 20. Controls how sensitive the sideways detection is.
Multipliers: Adjust the BB and KC multipliers to tighten or loosen the breakout sensitivity.
Disclaimer: Scalping involves significant risk. This tool is designed to assist your analysis, not replace sound risk management. Always backtest on a demo account before trading live.

VWAP BB Breakout + DMI MomentumI decided to code a single indicator that has some of my most used indicators.
I encourage that you have read up on VWAP, Bollinger Bands, ADX/DMI to understand how they function.
VWAP + Bollinger 1σ Breakout + DMI/ADX Scalping Strategy (NASDAQ)
This strategy is designed for single-chart, intraday scalping on the NASDAQ, focusing on volatility expansion in the direction of market control. It avoids higher-timeframe confirmation to eliminate lag and reacts only when price shows acceptance and momentum.
Core Concepts
VWAP defines market control and trade direction
Bollinger Bands (20, 1σ) identify early volatility expansion
DMI/ADX (10 / 5) confirms directional momentum and strength
The strategy trades breakouts that are supported by both bias and momentum, filtering out low-quality moves and chop.
Trade Rules
Long Setup
Price is above VWAP
Candle closes above the upper Bollinger 1σ band
+DI > –DI
ADX rising or above strength threshold
Short Setup
Price is below VWAP
Candle closes below the lower Bollinger 1σ band
–DI > +DI
ADX rising or above strength threshold
Trades are taken only on candle close to confirm acceptance.
Risk & Trade Management
Trades are avoided near VWAP to reduce chop
Stops are placed just inside the Bollinger 20 SMA or beyond the breakout candle
Partial profits can be taken at the 2σ band
Exits are considered when ADX flattens or DMI flips
Market Conditions
Best suited for:
High-liquidity sessions (NY open and main session)
Trending or expanding volatility environments
Avoid during:
Flat VWAP conditions
Bollinger Band compression
Low ADX / range-bound markets
Strategy Philosophy
This is a reactive momentum strategy, not predictive.
It waits for price to prove direction and strength, then participates in the move rather than anticipating it.

Super OscillatorSuper Oscillator – Intraday Momentum
Super Oscillator is a momentum-based oscillator designed for intraday trading, optimized for 1-minute charts and fast market conditions.
The indicator uses a zero-centered momentum model with dynamic smoothing and clearly defined zones to help traders identify exhaustion, pullbacks, and momentum shifts without excessive noise.
Key Features
Zero-centered oscillator for immediate directional bias
Dynamic overbought and oversold zones
Neutral “dead zone” to avoid low-probability trades
Smoothed momentum line with signal line for timing entries
Optimized for scalping and short-term intraday trading
Fully compatible with TradingView Pine Script v6
How to Use
Overbought zone: Look for bearish reactions or momentum exhaustion
Oversold zone: Look for bullish reactions or pullbacks
Dead zone: Avoid trades when momentum is unclear
Use the oscillator as a confirmation tool, always with price action and structure
Best Use Case
Intraday scalping (1M–5M)
Futures markets (indices, metals)
NY session trading
Disclaimer
This indicator does not predict price direction. It measures momentum and exhaustion and should be used as part of a complete trading plan with proper risk management.

SMC Liquidity Engine Pro SMC Liquidity Engine Pro - Complete Trading Guide & Documentation
📊 Introduction: Understanding Smart Money Concepts
The SMC Liquidity Engine Pro is a comprehensive, institutional-grade trading indicator that brings professional Smart Money Concepts (SMC) methodology directly to your TradingView charts. This isn't just another technical indicator—it's a complete framework for understanding how institutional traders, market makers, banks, and hedge funds manipulate and move the markets.
What Makes This Different?
While most retail traders rely on lagging indicators like moving averages or RSI, this indicator reveals the real-time footprints of institutional activity. It shows you:
Where large players are accumulating or distributing positions
How they engineer liquidity to trigger retail stop losses
When they're shifting from one directional bias to another
Where price inefficiencies exist that institutions will likely revisit
The markets don't move randomly—they move based on liquidity. Understanding this fundamental truth is what separates consistently profitable traders from those who struggle. This indicator decodes that liquidity-driven behavior and presents it in clear, actionable visual signals.
The Philosophy Behind Smart Money Concepts
Smart Money Concepts is built on several core principles:
1. Liquidity is King: Price doesn't move because of patterns or indicators—it moves to collect liquidity (stop losses and pending orders). Institutions need massive liquidity to fill their large positions, so they engineer price movements to create that liquidity before making their real directional move.
2. Market Structure Reveals Intent: The way price forms highs and lows tells a story about who's in control. When structure breaks, it signals a shift in institutional positioning.
3. Inefficiencies Get Filled: When price moves too quickly in one direction, it leaves behind "fair value gaps"—areas of imbalance. Institutions frequently return to these areas to fill orders and restore balance.
4. Manipulation Precedes True Moves: The most explosive directional moves are often preceded by liquidity sweeps in the opposite direction—trapping retail traders before the real move begins.
This indicator automates the identification of all these concepts, allowing you to trade alongside the smart money rather than being their exit liquidity.
🎯 Core Features - Deep Dive
1. Market Structure Detection & Visualization
What It Is: Market structure forms the foundation of all Smart Money analysis. This indicator automatically identifies and tracks swing highs and swing lows using a sophisticated pivot detection algorithm. These aren't just any price points—they represent areas where the market showed a significant shift in supply and demand dynamics.
How It Works: The indicator uses a customizable lookback period to identify valid swing points. A swing high must have lower highs on both sides within the lookback period, and a swing low must have higher lows on both sides. This ensures that only significant structural points are marked, filtering out minor noise and consolidation.
Visual Presentation:
Bullish Structure (Cyan Lines): Horizontal lines extending from each identified swing high, showing resistance levels that price previously respected
Bearish Structure (Red Lines): Horizontal lines extending from each identified swing low, showing support levels where buying pressure emerged
Trading Application: These structure levels serve multiple purposes:
Target Zones: Previous highs become targets in uptrends; previous lows become targets in downtrends
Invalidation Levels: If expecting a bullish move, breaking below the last swing low invalidates the setup
Context for Other Signals: All BOS, CHOCH, and liquidity sweep signals gain meaning from their relationship to structure
Multi-Timeframe Anchors: Higher timeframe structure provides context for lower timeframe entries
Advanced Tip: When multiple timeframe structures align (e.g., a daily swing low coincides with a 4-hour swing low), these levels carry significantly more weight and are more likely to be defended or, when broken, lead to explosive moves.
2. Break of Structure (BOS) - Trend Confirmation
What It Is: A Break of Structure occurs when price definitively closes beyond a previous swing high (bullish BOS) or swing low (bearish BOS). This signals that the current trend maintains its momentum and is likely to continue in the same direction.
The Institutional Perspective: When institutions want to continue pushing price in a direction, they need to break through previous resistance or support. A clean BOS indicates that:
There's sufficient institutional buying/selling to overcome the supply/demand at previous structure
The trend has enough momentum to attract more participants
Stop losses above/below structure have been triggered, providing liquidity for continuation
Signal Characteristics:
Bullish BOS Label: Appears below the bar that closes above the previous swing high
Bearish BOS Label: Appears above the bar that closes below the previous swing low
Confirmation: Requires a full candle close, preventing false signals from wicks
Trading Strategies:
Trend Continuation Entries: After a BOS, wait for a pullback to a Fair Value Gap or minor structure, then enter in the direction of the break
Breakout Trading: Enter immediately on BOS confirmation with a stop below the broken structure
Momentum Confirmation: Use BOS to confirm that your existing position is aligned with institutional flow
Scaling Strategy: Add to positions on each successive BOS in trending markets
What to Watch For:
Volume: Strong BOS movements should be accompanied by above-average volume
Speed: Rapid price movement through structure suggests institutional urgency
Follow-Through: The best BOS signals see price continue strongly without immediately reversing
Higher Timeframe Alignment: BOS on higher timeframes (4H, Daily) carry more weight than lower timeframe breaks
Common Pitfalls:
Not all structure breaks are equal—BOS during ranging markets are less reliable
A BOS immediately followed by a reversal back into the range may indicate a failed breakout
During major news events, structure can be broken temporarily without institutional intent
3. Liquidity Sweep Detection - Spotting Manipulation
What It Is: Liquidity sweeps (also called "stop hunts" or "liquidity grabs") occur when price temporarily breaks beyond a key level to trigger stop losses and pending orders, then immediately reverses back. This is one of the most important concepts in SMC trading because it reveals intentional manipulation.
Why Institutions Do This: Large institutional orders can't be filled at a single price point—they need massive liquidity. The biggest pools of liquidity sit just beyond obvious highs and lows where retail traders place their stops. By briefly pushing price into these zones, institutions:
Trigger retail stop losses (creating market orders)
Activate pending buy/sell orders
Fill their large positions at favorable prices
Trap late breakout traders before reversing
Detection Methodology: The indicator identifies sweeps using multiple criteria:
Price must penetrate beyond the structural high/low (creating the sweep)
The candle must close back on the opposite side of the structure (confirming rejection)
The sweep distance is measured against ATR to distinguish manipulation from normal volatility
The sweep multiplier setting allows you to adjust sensitivity based on market conditions
Visual Indicators:
Orange Down Arrows: Mark liquidity sweeps above structural highs
Lime Up Arrows: Mark liquidity sweeps below structural lows
Liquidity Zone Boxes: Semi-transparent colored boxes highlight the exact range of the swept area
Persistent Display: Zones remain visible for several bars to maintain context
Trading Applications:
Reversal Trading: Liquidity sweeps often mark excellent reversal points. After a sweep:
Wait for the sweep to complete (candle closes back inside structure)
Look for a Change of Character signal for confirmation
Enter in the direction opposite to the sweep
Place stops beyond the sweep high/low
Target the opposite side of the range or next structural level
Continuation Filtering: Not all sweeps lead to reversals. During strong trends:
Sweeps of minor structure in a trending market often precede continuation
Use higher timeframe structure to determine if a sweep is counter-trend (likely reversal) or with-trend (likely continuation)
Entry Refinement: In ranging markets, trade from swept lows to highs and vice versa, as institutions accumulate at the extremes.
Advanced Sweep Analysis:
Double Sweeps: When both sides of a range are swept, expect a strong breakout
Sweep Rejection Quality: Fast, strong rejections of sweeps are more reliable than slow grinding returns
Timeframe Consideration: Daily timeframe sweeps are significantly more important than 15-minute sweeps
Volume Profile: Sweeps with low volume followed by high volume reversals confirm manipulation
What Makes a High-Quality Sweep Signal: ✅ Penetrates structure by at least 0.5-1x ATR
✅ Strong rejection candle (long wick, decisive close)
✅ Occurs at a higher timeframe structural level
✅ Creates a Change of Character on the following move
✅ Sweeps an obvious level where retail stops cluster
4. Change of Character (CHOCH) - Major Reversal Signals
What It Is: A Change of Character represents the most significant shift in market dynamics—when the entire structural bias of the market flips from bullish to bearish or bearish to bullish. CHOCH signals are the crown jewel of SMC trading because they identify the exact moment when institutional positioning fundamentally changes.
The Anatomy of a CHOCH: A valid CHOCH requires a specific sequence:
Established Trend: A clear directional bias with multiple BOS in one direction
Liquidity Engineering: A sweep of structure in the current trend direction (the manipulation phase)
Structural Break: Price then breaks structure in the OPPOSITE direction (the revelation phase)
This combination shows that institutions have:
Completed their accumulation/distribution at favorable prices (via the sweep)
Shifted their positioning from bullish to bearish (or vice versa)
Begun a new directional campaign
Visual Presentation:
Bullish CHOCH (Cyan Triangle Up): Appears when bearish structure is broken after a low sweep, signaling the shift to bullish control
Bearish CHOCH (Red Triangle Down): Appears when bullish structure is broken after a high sweep, signaling the shift to bearish control
Prominent Markers: Larger and more visually distinct than BOS signals, reflecting their importance
Why CHOCH Signals Are So Powerful:
Trend Reversal Identification: They mark the earliest possible confirmation of a trend change
High Win Rate: When combined with proper risk management, CHOCH signals have among the highest success rates in SMC trading
Risk-Reward Ratio: Entering at CHOCH gives you the best possible risk-reward since you're entering at the beginning of a new trend
Institutional Confirmation: The sequence of sweep + structure break proves institutional repositioning, not just retail sentiment
Trading CHOCH Signals:
The Perfect CHOCH Setup:
Identify the Sweep: Watch for a liquidity sweep of structural lows (for bullish) or highs (for bearish)
Wait for the Break: Don't enter on the sweep—wait for structure to break in the opposite direction
CHOCH Confirmation: The indicator fires the CHOCH signal—this is your entry trigger
Entry Execution:
Aggressive: Enter immediately on CHOCH confirmation
Conservative: Wait for a pullback to the first Fair Value Gap or broken structure (now turned support/resistance)
Stop Placement: Beyond the swept liquidity point
Target Selection: Previous swing in the opposite direction, or let it run to the next CHOCH
Multiple Timeframe CHOCH Strategy: The most powerful setups occur when CHOCHs align across timeframes:
Daily CHOCH: Signals major institutional trend change, target 500+ pips (Forex) or significant point moves
4H CHOCH: Confirms daily direction, provides swing trade opportunities
1H CHOCH: Offers precise entry timing within the higher timeframe trend
15M CHOCH: Used for position scaling and intraday management
Example Trade Flow:
Daily Chart: Bullish CHOCH appears after weeks of downtrend
↓
4H Chart: Wait for pullback after the daily CHOCH, then catch the 4H bullish CHOCH
↓
1H Chart: Enter on the 1H bullish CHOCH that aligns with both higher timeframes
↓
Result: You've entered at the beginning of a major trend with multiple confirmations
CHOCH Quality Grading:
A-Grade CHOCH (Highest Probability):
Occurs at major higher timeframe structure
Following a clear liquidity sweep
Volume spike on the structural break
Multiple timeframe alignment
Creates a large Fair Value Gap on the break
B-Grade CHOCH (Good Probability):
Valid sweep and structure break
Single timeframe signal
Moderate volume
Occurs at minor structure
C-Grade CHOCH (Lower Probability):
Choppy, ranging market context
Weak sweep or unclear structure
Counter to higher timeframe trend
Low volume confirmation
Common Mistakes with CHOCH Trading: ❌ Entering on the sweep instead of waiting for the structure break
❌ Ignoring higher timeframe context
❌ Taking every CHOCH regardless of quality
❌ Not waiting for pullbacks on aggressive trends
❌ Placing stops too tight, getting caught in volatility
Advanced CHOCH Concepts:
Failed CHOCH: Occasionally, what appears to be a CHOCH will fail (price reverses back into the previous trend). This often indicates:
Insufficient institutional conviction for the reversal
Fake-out to grab liquidity in the opposite direction
Need to wait for a higher timeframe CHOCH for confirmation
When a CHOCH fails, it often sets up an even stronger continuation of the original trend.
CHOCH vs BOS Decision Matrix:
If in doubt about trend direction → wait for CHOCH
If confident in trend → trade BOS continuations
After a CHOCH → next signals in the new direction are BOS
5. Fair Value Gaps (FVG) - Institutional Retracement Zones
What It Is: Fair Value Gaps represent price imbalances where the market moved so quickly that it left behind inefficient pricing. These gaps form when there's no overlap between the current candle's wick and the candle from two bars ago—a void in the price action that creates a "gap" in the order flow.
The Institutional Logic: When institutions execute large market orders, they can push price rapidly through levels without allowing normal two-way trading. This creates unfilled orders and imbalanced order books. Institutions often return to these gaps to:
Fill additional orders at more favorable prices
Allow the market to "breathe" before the next push
Create support/resistance at the gap for the next move
Restore balance to the order book
FVG Formation Criteria: This indicator uses enhanced FVG detection logic:
Bullish FVG (Upward Gap):
Current candle's low is above the high from 2 candles ago
Creates a visible gap where no trading occurred
Gap size must exceed 30% of ATR (filtering minor gaps)
Typically forms on strong bullish momentum candles
Market moved up so fast it left unfilled sell orders
Bearish FVG (Downward Gap):
Current candle's high is below the low from 2 candles ago
Creates a visible gap where no trading occurred
Gap size must exceed 30% of ATR
Typically forms on strong bearish momentum candles
Market moved down so fast it left unfilled buy orders
Visual Presentation:
Bullish FVG Zones: Semi-transparent cyan boxes extending from gap bottom to top
Bearish FVG Zones: Semi-transparent red boxes extending from gap top to bottom
Dynamic Management: Gaps automatically removed when filled or expired
Clean Display: Only active, unfilled gaps shown to prevent chart clutter
FVG Trading Strategies:
Strategy 1: FVG Retracement Entries After a CHOCH or strong BOS, wait for price to retrace into the FVG for entry:
Identify trend direction via CHOCH or BOS
Locate the nearest FVG in the direction of the trend
Set limit orders within the FVG zone
Stop loss beyond the FVG
Target the next structural level or previous swing
Strategy 2: FVG Breakout Confirmation When price breaks through an FVG without filling it:
Signals extreme institutional urgency
Indicates the move is likely to continue strongly
The unfilled gap becomes a "no-go zone" for counter-trend entries
Strategy 3: Multiple FVG Management When multiple FVGs form in sequence:
The first FVG is most likely to be filled
If price skips the first FVG, it signals exceptional strength
Sequential gaps create a "gap ladder" for scaling into positions
FVG Quality Assessment:
High-Quality FVGs (Best Trading Zones):
Large gap size (1.5x+ ATR)
Formed on high volume impulse moves
Aligned with higher timeframe structure
Created during CHOCH or strong BOS
Positioned between current price and key structure
Low-Quality FVGs (Use Caution):
Small gaps (< 0.5 ATR)
Formed during choppy, ranging conditions
Multiple overlapping gaps in the same area
Counter to higher timeframe trend
Very old gaps (50+ bars ago)
FVG Lifecycle Management:
The indicator intelligently manages FVG zones:
Gap Filling:
Bullish FVG is "filled" when price touches the bottom of the gap
Bearish FVG is "filled" when price touches the top of the gap
Filled gaps are automatically removed from the chart
Partial fills count as complete fills (institutions got their orders)
Gap Expiration:
Gaps older than the extension period (default 10 bars) are removed
This keeps the chart clean and focuses on relevant levels
Adjustable from 5-50 bars based on timeframe and trading style
Gap Priority: When multiple gaps exist, closest gap to current price is most relevant
Advanced FVG Concepts:
Nested FVGs: Sometimes FVGs form within larger FVGs. The smaller, more recent gap typically gets filled first, providing a secondary entry within the larger gap.
FVG Clusters: When 3+ FVGs stack in the same zone, this area becomes a major institutional reaccumulation zone—excellent for swing entries.
Inverted FVGs: Bullish FVGs in downtrends or bearish FVGs in uptrends can act as resistance/support where rallies/dips fail.
FVG + Liquidity Sweep Combination: The ultimate entry setup:
Liquidity sweep occurs
CHOCH confirms reversal
Price retraces into FVG created during the CHOCH move
Enter with exceptional risk-reward ratio
FVG Statistics & Probabilities:
Research on FVG behavior shows:
Approximately 70% of FVGs get filled within 20 bars
FVGs formed during CHOCH have 80%+ fill rate
Larger gaps (2x+ ATR) have lower but higher-quality fill rates
Higher timeframe FVGs are more magnetic than lower timeframe
Timeframe Considerations:
Daily FVGs:
Can remain unfilled for weeks
Major institutional zones
Often mark the absolute best entry prices for swing trades
When filled, usually result in strong reactions
4H FVGs:
Typically fill within 3-7 days
Excellent for swing trading
Balance between frequency and reliability
1H FVGs:
Usually fill within 1-3 days
Good for short-term position trading
More frequent signals
15M FVGs:
Often fill same day
Best used for intraday refinement
Should align with higher timeframe gaps
🔧 Customization & Settings Guide
Structure Detection Settings
Swing Lookback Period (3-50 bars): This is arguably the most important setting as it determines what the indicator considers "structure."
Low Values (3-7):
Identifies minor swings and frequent structure points
More BOS and CHOCH signals
Better for scalping and day trading
Risk: More false signals in choppy markets
Best for: 15M-1H charts, active traders
Medium Values (8-15):
Balanced approach capturing meaningful swings
Default setting works well for most traders
Good signal-to-noise ratio
Best for: 1H-4H charts, swing traders
High Values (16-50):
Only major structural points identified
Fewer but higher-quality signals
Cleaner charts with less noise
Better for trending markets
Best for: 4H-Daily charts, position traders
ATR Period (1-50): Controls how volatility is measured for liquidity sweep detection.
Shorter Periods (7-14):
More responsive to recent volatility changes
Better during high volatility events
May overreact to short-term spikes
Longer Periods (15-30):
Smoother, more stable volatility measurement
Better for swing trading
Reduces sensitivity to short-term noise
Liquidity Sweep Multiplier (0.5-3.0): Determines how far beyond structure price must move to qualify as a sweep.
Low Multiplier (0.5-0.9):
Catches smaller, more frequent sweeps
More signals but lower reliability
Good for scalping or high-frequency trading
Use in ranging markets
Medium Multiplier (1.0-1.5):
Balanced sensitivity
Default 1.2 works for most situations
Good signal quality
High Multiplier (1.6-3.0):
Only major, obvious sweeps detected
Fewer but very high-quality signals
Best for trending markets
Use when you want only the clearest setups
Display Options
Toggle Controls: Each component can be individually enabled/disabled:
Show Market Structure:
Turn off when chart becomes too cluttered
Essential for understanding context, generally keep ON
Disable only when you know structure from higher timeframe
Show Liquidity Zones:
Highlights swept areas with boxes
Can be disabled if you prefer cleaner charts
Keep ON when learning to spot manipulation
Show Break of Structure:
BOS labels can be disabled if trading only reversals
Keep ON for trend following strategies
Show Change of Character:
Core SMC signal, usually keep ON
Only disable if focusing purely on continuation trading
Show Fair Value Gaps:
OFF by default to prevent overwhelming new users
Turn ON once comfortable with basic structure
Can generate many zones on lower timeframes
FVG Extension Period (5-50 bars): Determines how long unfilled gaps remain displayed.
Short Extension (5-10):
Keeps charts very clean
Only shows very recent gaps
Good for day trading
May remove gaps before they fill
Medium Extension (11-25):
Balanced approach
Captures most gap fills
Good for swing trading
Long Extension (26-50):
Shows historical gap context
Better for position trading
Higher timeframe analysis
Can make charts busy on lower timeframes
Color Scheme Customization
Why Colors Matter: Visual clarity is crucial for quick decision-making. The color scheme should:
Clearly distinguish bullish vs bearish elements
Work well with your chart background (dark/light mode)
Be visible but not distracting
Match your personal preference for aesthetics
Default Colors:
Bullish: Cyan (
#00ffff) - visibility and association with "cool" buying
Bearish: Red (
#ff0051) - visibility and universal danger/selling association
FVG Bullish: 85% transparent cyan - visible but not overpowering
FVG Bearish: 85% transparent red - visible but not overpowering
Customization Tips:
Increase transparency if zones overwhelm price action
Use higher contrast colors on light backgrounds
Keep bullish/bearish colors visually distinct
Test colors across different market conditions
Optimization by Market Type
Forex (24-hour markets):
Structure Lookback: 10-15
ATR Period: 14-21
Sweep Multiplier: 1.0-1.5
Best Timeframes: 15M, 1H, 4H
Stocks (Session-based):
Structure Lookback: 8-12
ATR Period: 14
Sweep Multiplier: 1.2-1.8
Best Timeframes: 5M, 15M, 1H, Daily
Note: Gaps at market open/close aren't FVGs
Cryptocurrency (High volatility):
Structure Lookback: 12-20 (filter noise)
ATR Period: 10-14 (responsive to volatility)
Sweep Multiplier: 1.5-2.5 (larger sweeps)
Best Timeframes: 15M, 1H, 4H
Indices (Moderate volatility):
Structure Lookback: 10-15
ATR Period: 14-20
Sweep Multiplier: 1.0-1.5
Best Timeframes: 1H, 4H, Daily
📈 Complete Trading System & Strategies
The Complete SMC Trading Process
Step 1: Higher Timeframe Analysis (Daily/4H) Begin every trading session by analyzing higher timeframes:
Identify the prevailing market structure (bullish or bearish)
Mark key swing highs and lows
Note any recent CHOCHs that signal trend changes
Identify major Fair Value Gaps that could act as targets or entry zones
Determine areas of liquidity (obvious highs/lows where stops cluster)
Step 2: Trading Timeframe Setup (1H/4H) Move to your primary trading timeframe:
Wait for alignment with higher timeframe bias
Look for CHOCH signals if expecting reversal
Look for BOS signals if expecting continuation
Identify liquidity sweeps that create trading opportunities
Note nearby FVGs for entry refinement
Step 3: Entry Timeframe Execution (15M/1H) Use lower timeframe for precise entry:
After higher timeframe signal, wait for lower timeframe confirmation
Enter on FVG fills, structure breaks, or CHOCH signals
Place stop beyond swept liquidity or broken structure
Set targets at next structure level or opposite side of range
Step 4: Management Active trade management increases profitability:
Move stop to breakeven after price moves 1R (risk unit)
Take partial profits at first target (structure level)
Let remainder run to major targets
Trail stop using FVGs or structure breaks in your direction
Exit if a counter-trend CHOCH appears
High-Probability Trading Setups
Setup 1: The Classic CHOCH Reversal
Market Context:
Extended trend in one direction
Price reaching obvious highs/lows where liquidity pools
Setup Requirements:
Liquidity sweep of the high/low
CHOCH signal fires
(Optional) Wait for pullback to FVG
Entry: On CHOCH confirmation or FVG fill
Stop: Beyond swept liquidity
Target: Previous swing in opposite direction
Example (Bullish):
Market in downtrend for 2 weeks
Price sweeps below obvious daily low
Bullish CHOCH fires (breaks previous lower high)
Enter immediately or wait for pullback to bullish FVG
Stop below swept low
Target: Previous lower high, then previous high
Risk-Reward: Typically 1:3 to 1:5+
Setup 2: BOS Continuation with FVG Entry
Market Context:
Established trend with recent CHOCH
Strong momentum in trend direction
Setup Requirements:
Recent CHOCH established trend direction
BOS signal confirms continuation
Wait for pullback into FVG created on the BOS move
Entry: Limit order within FVG zone
Stop: Beyond FVG (invalid if exceeded)
Target: Next structural level
Example (Bearish):
Bearish CHOCH 2 days ago
Price makes BOS breaking new low
Large bearish FVG created during the break
Price retraces into FVG zone
Enter short at FVG fill
Stop above FVG
Target: Next major low or daily FVG below
Risk-Reward: 1:2 to 1:4
Setup 3: Liquidity Sweep Fade
Market Context:
Ranging market between defined highs/lows
Obvious liquidity on both sides of range
Setup Requirements:
Clear range established (minimum 20-30 bars)
Price sweeps one side of range (high or low)
Strong rejection back into range
Entry: After sweep rejection confirmed
Stop: Beyond swept level
Target: Opposite side of range
Example:
Range between 1.0850-1.0920 (EUR/USD)
Price sweeps above 1.0920 to 1.0935
Strong bearish rejection candle back below 1.0920
Enter short at 1.0915
Stop at 1.0940 (above sweep high)
Target: 1.0850 (range low)
Risk-Reward: 1:2.6
Setup 4: Multi-Timeframe CHOCH Alignment
Market Context:
Major trend change occurring
Multiple timeframes showing reversal signals
Setup Requirements:
Daily timeframe shows CHOCH
Wait for 4H CHOCH in same direction
Enter on 1H CHOCH that aligns
Entry: 1H CHOCH confirmation
Stop: Below 4H structure
Target: Daily structural level
Example (Bullish):
Daily bearish trend for months
Daily bullish CHOCH appears
4H shows bullish CHOCH next day
1H bullish CHOCH provides entry
Enter long on 1H signal
Stop: Below 4H swing low
Target: Daily previous high
Risk-Reward: 1:5 to 1:10+
Position: Larger size due to alignment
Setup 5: Failed CHOCH Continuation
Market Context:
Strong trend temporarily looks like reversing
"False" CHOCH creates trap for counter-trend traders
Setup Requirements:
Apparent CHOCH against main trend
Price fails to follow through
Original trend resumes with strong BOS
Entry: On BOS in original trend direction
Stop: Recent swing
Target: Extension of original trend
Example:
Strong daily uptrend
Bearish CHOCH appears (potential reversal)
Price consolidates but doesn't follow through down
Bullish BOS breaks above recent consolidation
Enter long on BOS
Stop: Below failed CHOCH low
Target: New high extension
Risk-Reward: 1:3 to 1:6
Note: Failed reversals often lead to explosive continuations
Risk Management Framework
Position Sizing: Never risk more than 1-2% of account per trade, even on A+ setups.
Risk Calculation:
Position Size = (Account Size × Risk %) / (Entry - Stop Loss in pips/points)
Example:
Account: $10,000
Risk: 1% = $100
Entry: 1.0900
Stop: 1.0870 (30 pips)
Position Size: $100 / 30 pips = $3.33 per pip
Lot Size (Forex): 0.33 lots
Stop Loss Placement:
For CHOCH Reversals:
Place stop 5-10 pips beyond swept liquidity
Gives room for volatility while protecting capital
If swept liquidity is violated, setup is invalidated
For BOS Continuations:
Place stop beyond the FVG or structure that provided entry
Typically tighter stops (closer to entry)
Can trail stop to breakeven quickly
For Range Trading:
Stop beyond the swept level
Generally tight stops work well in ranges
Exit quickly if range boundaries break
Take Profit Strategy:
Scaling Out Method (Recommended):
First Target (50% of position): First structural level (1:1 to 1:2)
Second Target (30% of position): Major structure (1:3 to 1:5)
Trail Stop (20% of position): Let run to full extension
Full Exit Method:
Hold entire position to predetermined target
Requires more discipline
Higher reward but also higher risk of giveback
Trade Management Rules:
Breakeven Rule: Move stop to breakeven after 1R profit
Partial Profit Rule: Take partials at structure levels
Trailing Rule: Trail stop
