MACD+RSI+BBDESCRIPTION
The MACD + RSI + Bollinger Bands Indicator is a comprehensive technical analysis tool designed for traders and investors to identify potential market trends and reversals. This script combines three indicators: the Moving Average Convergence Divergence (MACD), the Relative Strength Index (RSI), and Bollinger Bands. Each of these indicators provides unique insights into market behavior.
FEATURES
MACD (Moving Average Convergence Divergence)
The MACD is a trend-following momentum indicator that shows the relationship between two moving averages of a security’s price.
The script calculates the MACD line, the signal line, and the histogram, which visually represents the difference between the MACD line and the signal line.
RSI (Relative Strength Index)
The RSI is a momentum oscillator that measures the speed and change of price movements. It ranges from 0 to 100 and is typically used to identify overbought or oversold conditions.
The script allows users to set custom upper and lower thresholds for the RSI, with default values of 70 and 30, respectively.
Bollinger Bands
Bollinger Bands consist of a middle band (EMA) and two outer bands (standard deviations away from the EMA). They help traders identify volatility and potential price reversals.
The script allows users to customize the length of the Bollinger Bands and the multiplier for the standard deviation.
Color-Coding Logic
The histogram color changes based on the following conditions:
Black: If the RSI is above the upper threshold and the closing price is above the upper Bollinger Band, or if the RSI is below the lower threshold and the closing price is below the lower Bollinger Band.
Green (#4caf50): If the RSI is above the upper threshold but the closing price is not above the upper Bollinger Band.
Light Green (#a5d6a7): If the histogram is positive and the RSI is not above the upper threshold.
Red (#f23645): If the RSI is below the lower threshold but the closing price is not below the lower Bollinger Band.
Light Red (#faa1a4): If the histogram is negative and the RSI is not below the lower threshold.
Inputs
Bollinger Bands Settings
Length: The number of periods for the moving average.
Basis MA Type: The type of moving average (SMA, EMA, SMMA, WMA, VWMA).
Source: The price source for the Bollinger Bands calculation.
StdDev: The multiplier for the standard deviation.
RSI Settings
RSI Length: The number of periods for the RSI calculation.
RSI Upper: The upper threshold for the RSI.
RSI Lower: The lower threshold for the RSI.
Source: The price source for the RSI calculation.
MACD Settings
Fast Length: The length for the fast moving average.
Slow Length: The length for the slow moving average.
Signal Smoothing: The length for the signal line smoothing.
Oscillator MA Type: The type of moving average for the MACD calculation.
Signal Line MA Type: The type of moving average for the signal line.
Usage
This indicator is suitable for various trading strategies, including day trading, swing trading, and long-term investing.
Traders can use the MACD histogram to identify potential buy and sell signals, while the RSI can help confirm overbought or oversold conditions.
The Bollinger Bands provide context for price volatility and potential breakout or reversal points.
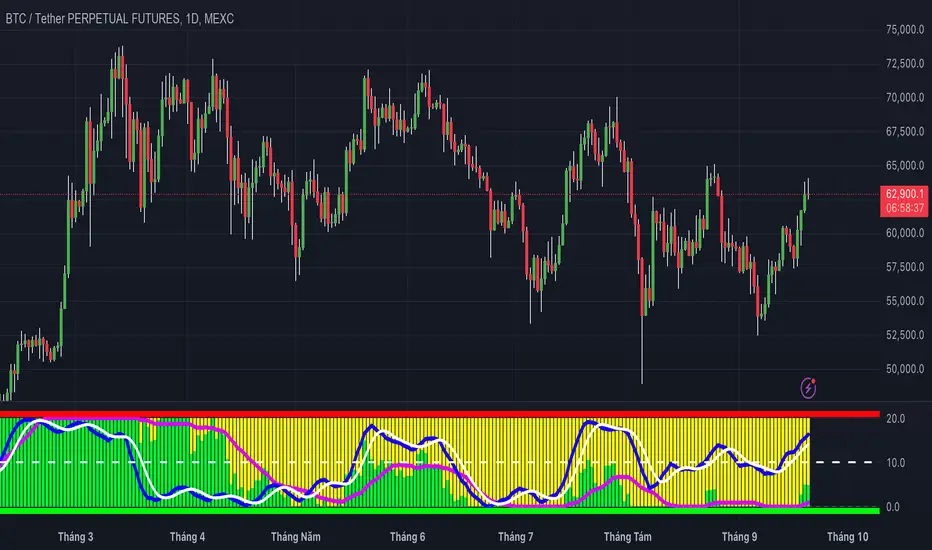
Example:
From the example, it can clearly see that the Selling Climax and Buying Climax, marked as orange circle when a black histogram occurs.
Conclusion
The MACD + RSI + Bollinger Bands Indicator is a versatile tool that combines multiple technical analysis methods to provide traders with a comprehensive view of market conditions. By utilizing this script, traders can enhance their analysis and improve their decision-making process.
스크립트에서 "rsi"에 대해 찾기

MCDX+RSI+SMA[THANHCONG]### Detailed Analysis of the MCDX+RSI+SMA Indicator
The MCDX+RSI+SMA indicator is designed to help investors conduct a deeper analysis of market trends by combining multiple technical factors into a single chart. This integration of popular indicators such as RSI, SMA, and Stochastic RSI provides investors with a comprehensive view of market movements, particularly in distinguishing between "Banker" and "Hot Money"—representing large and small capital flows.
#### Key Components of the Indicator:
1. **RSI for Banker and Hot Money:**
- **RSI (Relative Strength Index)** is a momentum oscillator that measures the speed and change of price movements, indicating overbought or oversold conditions. In this indicator, there are two distinct RSI lines configured for Banker (large capital) and Hot Money (small capital).
- Investors can adjust parameters like the RSI calculation period, baseline levels, and sensitivity for each type of capital flow, providing flexibility to adapt to varying market conditions.
2. **Moving Average (MA) of RSI:**
- The indicator employs two common types of Moving Averages: **SMA (Simple Moving Average)** and **EMA (Exponential Moving Average)**. These help smooth the RSI signals for Banker, offering a clearer view of the long-term trend of large capital in the market.
- Investors can select the type and period of the MA, allowing them to optimize the indicator for their trading style.
3. **Stochastic RSI:**
- The **Stochastic RSI** is incorporated to monitor overbought and oversold conditions over a specified timeframe. Parameters related to %K and %D of the Stochastic can also be adjusted to refine the accuracy of market signal analysis.
- A notable feature is the normalization of %K and %D on a 0-20 scale, making these lines compatible with other RSI charts, thus providing consistency in evaluating market strength.
4. **Overbought and Oversold Levels:**
- The indicator includes reference lines for overbought and oversold levels, aiding investors in identifying potential reversal zones in the market. This helps to avoid buying at excessively high prices or selling at excessively low prices.
#### Benefits for Investors:
- **Comprehensive View:** The indicator combines insights from both large (Banker) and small (Hot Money) capital flows, enabling investors to analyze not just trends but also the participation of each type of capital in the market.
- **Enhanced Technical Analysis:** By integrating multiple technical indicators within a single chart, investors can track important factors such as market momentum, overbought/oversold conditions, and capital flow shifts without needing to switch between various charts.
- **Flexibility and Customization:** The indicator allows adjustment of key parameters like the RSI period, sensitivity, type of MA, and Stochastic RSI settings, enabling investors to tailor the indicator to their trading strategy and timeframe.
- **Higher Reliability:** The combination of indicators like RSI, Stochastic RSI, and MA helps investors confirm trading signals more confidently. For instance, when both RSI and Stochastic RSI indicate overbought conditions, the likelihood of a reversal may be higher, reducing risk for investors.
#### Unique Features of the Indicator:
The MCDX+RSI+SMA indicator is a unique tool that integrates various market analysis factors into a single framework. This not only provides investors with a complete view of capital flows but also aids in optimizing decision-making based on multiple market aspects. Furthermore, its customizable parameters make it suitable for various trading strategies, from short-term to long-term.
RishiMoney RSIRishiMoney RSI
The "RishiMoney RSI" indicator is designed for traders who want to leverage the power of the Relative Strength Index (RSI) across multiple timeframes.
In addition to regular RSI, this script allows the users to select custom timeframes for two additional RSI calculations, making it easier to identify trends, reversals, and potential entry or exit points.
USAGE
While Returning the same information as a regular RSI the RishiMoney RSI provides two more RSI calculations One for Lagrgest Timeframe and one for middle Timeframe so that the users need not to check for higher timeframes separately Which is very Time consuming. This script solves the problem of time taking process of checking different timeframes RSI calculations.
This script is ideal for traders who want to confirm their analysis across multiple timeframes. By comparing the main RSI with larger and intermediate timeframes, traders can better understand the market's momentum and make more informed decisions.
The RishiMoney RSI crossing above the overbought level can be indicative of a strong uptrend which is highlighted as a green gradient area, while when RishiMoney RSI is crossing under the oversold level can be indicative of a strong downtrend which is highlighted as a red area.
Key Features:
Customizable RSI Period: Set your preferred RSI period for precise calculation and analysis.
Multi-Timeframe RSI:
Largest RSI Timeframe: Choose the largest timeframe for your analysis (Monthly, Weekly, Daily, Hourly, 15 minutes, or 5 minutes).
Middle RSI Timeframe: Select an intermediate timeframe for comparison with the main RSI.
Overbought and Oversold Levels: The indicator includes customizable overbought and oversold levels, which are clearly marked on the chart with dynamic bands.
Alerts: Set up alerts for when the RSI crosses into overbought or oversold territory, so you never miss a potential trading opportunity.
Visual Clarity: The script plots the RSI for your selected timeframes with distinct colors, helping you quickly identify trends across different timeframes.
This script is provided for educational purposes only and should not be considered financial advice. Always conduct your own research and consult with a financial advisor before making any trading decisions.

Market Cipher B by WeloTradesMarket Cipher B by WeloTrades: Detailed Script Description
//Overview//
"Market Cipher B by WeloTrades" is an advanced trading tool that combines multiple technical indicators to provide a comprehensive market analysis framework. By integrating WaveTrend, RSI, and MoneyFlow indicators, this script helps traders to better identify market trends, potential reversals, and trading opportunities. The script is designed to offer a holistic view of the market by combining the strengths of these individual indicators.
//Key Features and Originality//
WaveTrend Analysis:
WaveTrend Channel (WT1 and WT2): The core of this script is the WaveTrend indicator, which uses the smoothed average of typical price to identify overbought and oversold conditions. WT1 and WT2 are calculated to track market momentum and cyclical price movements.
Major Divergences (🐮/🐻): The script detects and highlights major bullish and bearish divergences automatically, providing traders with visual cues for potential reversals. This helps in making informed decisions based on divergence patterns.
Relative Strength Index (RSI):
RSI Levels: RSI is used to measure the speed and change of price movements, with specific levels indicating overbought and oversold conditions.
Customizable Levels: Users can configure the overbought and oversold thresholds, allowing for a tailored analysis based on individual trading strategies.
MoneyFlow Indicator:
Fast and Slow MoneyFlow: This indicator tracks the flow of capital into and out of the market, offering insights into the underlying market strength. It includes configurable periods and multipliers for both fast and slow MoneyFlow.
Vertical Positioning: The script allows users to adjust the vertical position of MoneyFlow plots to maintain a clear and uncluttered chart.
Stochastic RSI:
Stochastic RSI Levels: This combines the RSI and Stochastic indicators to provide a momentum oscillator that is sensitive to price changes. It is used to identify overbought and oversold conditions within a specified period.
Customizable Levels: Traders can set specific levels for more precise analysis.
//How It Works//
The script integrates these indicators through advanced algorithms, creating a synergistic effect that enhances market analysis. Here’s a detailed explanation of the underlying concepts and calculations:
WaveTrend Indicator:
Calculation: WaveTrend is based on the typical price (average of high, low, and close) smoothed over a specified channel length. WT1 and WT2 are derived from this typical price and further smoothed using the Average Channel Length. The difference between WT1 and WT2 indicates momentum, helping to identify cyclical market trends.
RSI (Relative Strength Index):
Calculation: RSI calculates the average gains and losses over a specified period to measure the speed and change of price movements. It oscillates between 0 and 100, with levels set to identify overbought (>70) and oversold (<30) conditions.
MoneyFlow Indicator:
Calculation: MoneyFlow is derived by multiplying price changes by volume and smoothing the results over specified periods. Fast MoneyFlow reacts quickly to price changes, while Slow MoneyFlow offers a broader view of capital movement trends.
Stochastic RSI:
Calculation: Stochastic RSI is computed by applying the Stochastic formula to RSI values, which highlights the RSI’s relative position within its range over a given period. This helps in identifying momentum shifts more precisely.
//How to Use the Script//
Display Settings:
Users can enable or disable various components like WaveTrend OB & OS levels, MoneyFlow plots, and divergence alerts through checkboxes.
Example: Turn on "Show Major Divergence" to see major bullish and bearish divergence signals directly on the chart.
Adjust Channel Settings:
Customize the data source, channel length, and smoothing periods in the "WaveTrend Channel SETTINGS" group.
Example: Set the "Channel Length" to 10 for a more responsive WaveTrend line or adjust the "Average Channel Length" to 21 for smoother trends.
Set Overbought & Oversold Levels:
Configure levels for WaveTrend, RSI, and Stochastic RSI in their respective settings groups.
Example: Set the WaveTrend Overbought Level to 60 and Oversold Level to -60 to define critical thresholds.
Money Flow Settings:
Adjust the periods and multipliers for Fast and Slow MoneyFlow indicators, and set their vertical positions for better visualization.
Example: Set the Fast Money Flow Period to 9 and Slow Money Flow Period to 12 to capture both short-term and long-term capital movements.
//Justification for Combining Indicators//
Enhanced Market Analysis:
Combining WaveTrend, RSI, and MoneyFlow provides a more comprehensive view of market conditions. Each indicator brings a unique perspective, making the analysis more robust.
WaveTrend identifies cyclical trends, RSI measures momentum, and MoneyFlow tracks capital movement. Together, they provide a multi-dimensional analysis of the market.
Improved Decision-Making:
By integrating these indicators, the script helps traders make more informed decisions. For example, a bullish divergence detected by WaveTrend might be validated by an RSI moving out of oversold territory and supported by increasing MoneyFlow.
Customization and Flexibility:
The script offers extensive customization options, allowing traders to tailor it to their specific needs and strategies. This flexibility makes it suitable for different trading styles and timeframes.
//Conclusion//
The indicator stands out due to its innovative combination of WaveTrend, RSI, and MoneyFlow indicators, offering a well-rounded tool for market analysis. By understanding how each component works and how they complement each other, traders can leverage this script to enhance their market analysis and trading strategies, making more informed and confident decisions.
Remember to always backtest the indicator first before implying it to your strategy.

Heikin Ashi RSI + OTT [Erebor]Relative Strength Index (RSI)
The Relative Strength Index (RSI) is a popular momentum oscillator used in technical analysis to measure the speed and change of price movements. Developed by J. Welles Wilder, the RSI is calculated using the average gains and losses over a specified period, typically 14 days. Here's how it works:
Description and Calculation:
1. Average Gain and Average Loss Calculation:
- Calculate the average gain and average loss over the chosen period (e.g., 14 days).
- The average gain is the sum of gains divided by the period, and the average loss is the sum of losses divided by the period.
2. Relative Strength (RS) Calculation:
- The relative strength is the ratio of average gain to average loss.
The RSI oscillates between 0 and 100. Traditionally, an RSI above 70 indicates overbought conditions, suggesting a potential sell signal, while an RSI below 30 suggests oversold conditions, indicating a potential buy signal.
Pros of RSI:
- Identifying Overbought and Oversold Conditions: RSI helps traders identify potential reversal points in the market due to overbought or oversold conditions.
- Confirmation Tool: RSI can be used in conjunction with other technical indicators or chart patterns to confirm signals, enhancing the reliability of trading decisions.
- Versatility: RSI can be applied to various timeframes, from intraday to long-term charts, making it adaptable to different trading styles.
Cons of RSI:
- Whipsaws: In ranging markets, RSI can generate false signals, leading to whipsaws (rapid price movements followed by a reversal).
- Not Always Accurate: RSI may give false signals, especially in strongly trending markets where overbought or oversold conditions persist for extended periods.
- Subjectivity: Interpretation of RSI levels (e.g., 70 for overbought, 30 for oversold) is somewhat subjective and can vary depending on market conditions and individual preferences.
Checking RSIs in Different Periods:
Traders often use multiple timeframes to analyze RSI for a more comprehensive view:
- Fast RSI (e.g., 8-period): Provides more sensitive signals, suitable for short-term trading and quick decision-making.
- Slow RSI (e.g., 32-period): Offers a smoother representation of price movements, useful for identifying longer-term trends and reducing noise.
By comparing RSI readings across different periods, traders can gain insights into the momentum and strength of price movements over various timeframes, helping them make more informed trading decisions. Additionally, divergence between fast and slow RSI readings may signal potential trend reversals or continuation patterns.
Heikin Ashi Candles
Let's consider a modification to the traditional “Heikin Ashi Candles” where we introduce a new parameter: the period of calculation. The traditional HA candles are derived from the open 01, high 00 low 00, and close 00 prices of the underlying asset.
Now, let's introduce a new parameter, period, which will determine how many periods are considered in the calculation of the HA candles. This period parameter will affect the smoothing and responsiveness of the resulting candles.
In this modification, instead of considering just the current period, we're averaging or aggregating the prices over a specified number of periods . This will result in candles that reflect a longer-term trend or sentiment, depending on the chosen period value.
For example, if period is set to 1, it would essentially be the same as traditional Heikin Ashi candles. However, if period is set to a higher value, say 5, each candle will represent the average price movement over the last 5 periods, providing a smoother representation of the trend but potentially with delayed signals compared to lower period values.
Traders can adjust the period parameter based on their trading style, the timeframe they're analyzing, and the level of smoothing or responsiveness they prefer in their candlestick patterns.
Optimized Trend Tracker
The "Optimized Trend Tracker" is a proprietary trading indicator developed by TradingView user ANIL ÖZEKŞİ. It is designed to identify and track trends in financial markets efficiently. The indicator attempts to smooth out price fluctuations and provide clear signals for trend direction.
The Optimized Trend Tracker uses a combination of moving averages and adaptive filters to detect trends. It aims to reduce lag and noise typically associated with traditional moving averages, thereby providing more timely and accurate signals.
Some of the key features and applications of the OTT include:
• Trend Identification: The indicator helps traders identify the direction of the prevailing trend in a market. It distinguishes between uptrends, downtrends, and sideways consolidations.
• Entry and Exit Signals: The OTT generates buy and sell signals based on crossovers and direction changes of the trend. Traders can use these signals to time their entries and exits in the market.
• Trend Strength: It also provides insights into the strength of the trend by analyzing the slope and momentum of price movements. This information can help traders assess the conviction behind the trend and adjust their trading strategies accordingly.
• Filter Noise: By employing adaptive filters, the indicator aims to filter out market noise and false signals, thereby enhancing the reliability of trend identification.
• Customization: Traders can customize the parameters of the OTT to suit their specific trading preferences and market conditions. This flexibility allows for adaptation to different timeframes and asset classes.
Overall, the OTT can be a valuable tool for traders seeking to capitalize on trending market conditions while minimizing false signals and noise. However, like any trading indicator, it is essential to combine its signals with other forms of analysis and risk management strategies for optimal results. Additionally, traders should thoroughly back-test the indicator and practice using it in a demo environment before applying it to live trading.
The following types of moving average have been included: "SMA", "EMA", "SMMA (RMA)", "WMA", "VWMA", "HMA", "KAMA", "LSMA", "TRAMA", "VAR", "DEMA", "ZLEMA", "TSF", "WWMA". Thanks to the authors.
Thank you for your indicator “Optimized Trend Tracker”. © kivancozbilgic
Thank you for your programming language, indicators and strategies. © TradingView
Kind regards.
© Erebor_GIT

Trending RSI [ChartPrime]Trending RSI takes a new approach to RSI intended to provide all of the missing information that traditional RSI lacks. Questions such as "why does the price continue to decline even during an oversold period?" can be aided using the Trending RSI.
These types of movements are due to the market still trending and traditional RSI can not tell traders this. Trending RSI fixes this by introducing trend information back into the oscillator. By reverse engineering RSI we have been able to make a new indicator that is no longer bound between 0 and 100. Instead it provides the traditional 70 and 30 zones as bands, and 50 as a center line that still represent these zones perfectly. This transforms RSI into a centered oscillator instead of a normalized oscillator. When the market is trending our indicator represents this as the center line being below or above 0. Just like MACD the center line is colored to represent the market phases. This helps in identifying reversals more clearly by adding a layer of confluence to the already renowned RSI. We have also included a novel filtering technique that has a low lag to smoothing ratio. This is primarily used to smooth the bands by default but you can also utilize this on the RSI. Several alerts have been included to provide users with easy to configure signals.
You can use the center line as a directional filter for your trades by only picking trades in the direction of the center line. When the center line is above 0, the market is trending up. Conversely, when the center line is below 0 the market is trending down trend. Use the polarity of the center line to estimate the strength of retracements from the oversold and overbought zones. We have also included a special moving average to help you find the momentum of a move. The Binomial MA filter approximates a normal curve making it similar to a gaussian filter. We have also included standard divergences which are fully configurable in the settings. Finally, we have built this indicator to be compatible with the built in multi time frame option to allow users to freely pick the time frame they wish to use. It is worth noting that due to the limitations of the standard MTF implementation divergences will not plot as expected when using time frames outside of the charts time frame. This is standard and also affects the built in RSI.
All of the colors are fully adjustable with the option to enable or disable the glow effect. We have also designed this indicator to only display the information for plots that are enabled to reduce clutter and provide a cleaner charting experience. All alerts are built to work with the standard alert builder and do not have to be enabled or disabled inside of the indicator.
Included Alerts:
RSI Cross Over Center
RSI Cross Under Center
RSI Cross Under Upper Range
RSI Cross Over Upper Range
RSI Cross Over Lower Range
RSI Cross Under Lower Range
RSI Cross Over MA
RSI Cross Under MA
RSI Cross Over 0
RSI Cross Under 0
Center Cross Over 0
Center Cross Under 0
Center Bullish
Center Bearish
Bullish Divergence
Bearish Divergence
In wrapping up, the Trending RSI aims to enhance the conventional RSI by adding trend insights directly into the oscillator, addressing the gap that traditional RSI leaves regarding market trends. This version of RSI breaks away from the 0 to 100 range, offering bands and a center line that better represent market conditions. It includes a set of features like the Binomial MA for momentum analysis, configurable settings for divergence detection, and compatibility with multi-time frame analysis. The color customization and glow effects aim to improve visual clarity, and the inclusion of alerts is designed to streamline alert configuration. Overall, this indicator is designed to provide a more view of the markets, suitable for traders looking to incorporate trend analysis into their RSI-based strategies.
Enjoy

DOUBLE RSI+MA ALERTS SETUPThis is an indicator that provides two verses of relative force indices (RSI) - an RSI Rapid and an RSI Normal, but as moving media (MA) applied with an RSI Rapid for suavização.
Rapid RSI and Normal RSI:
Or RSI is a momentum indicator that mediates the speed and alteração of preço movements of an ativo. No script, we calculate the RSI variations:
O RSI Rápido, com um período configurável que por padrão é but curto (5 períodos), para reactor but quickly to these mudanças no preço.
Or RSI Normal, with a configured period, but with a maximum value (14 periods), proportionate to an analysis but correct.
Media Móvel do RSI Rápido:
We have a simple mobile media (SMA) application with RSI Rapido, using the same number of times as RSI to monitor variations and facilitate viewing of the direction of the trend.
Levels of Overbought and Oversold:
These are the levels of overbought (sobrevendido) and oversold (sobrecomprado). Therefore, the overbought level is set at 80 and the overbought level is 20, depending on the classic RSI settings.
Alert Conditions:
Criamos alert conditions to inform you when the RSI of each type is ultrapassed or they are not defined as overbought and oversold. Assim, we can be notified of potential entry points or conditions based on these extreme market conditions. These messages are personalized to ensure that you quickly identify when the RSI has disappeared or alerted you if it is an overbought or oversold condition.
Visualization Graphic:
The indicator plots as RSI Rapid and RSI Normal lines not graphically for visual analysis, but with horizontal lines indicating the level of overbought and oversold. A cor dessas linehas éjustável para clareza.
Informative Table:
The tab is added to the lower side of the graphic fornecendo values at the real time of the RSI Fast as the RSI Normal, making it easier to visualize quickly and to compare unless it is necessary to print directly for the graphic.
This script has a powerful ferrament for operators that provides integrated analysis of RSI into its strategies, offering flexibility to monitor the dynamics of the preço and different tempo scales. Personal alerts are particularly important to be aware of marketing conditions without the need for constant monitoring. Algum additional functionality that you find useful or extra personalization that you want?

Unbound RSIUnbound RSI
Description
The Unbound RSI or de-oscillated RSI indicator is a novel technical analysis indicator that combines the concepts of the Relative Strength Index (RSI) and moving averages, applied directly over the price chart. This indicator is unique in its approach by transforming the oscillatory nature of the RSI into a format that aligns with the price action, thereby offering a distinctive view of market momentum and trends.
Key Features
Multi-Length RSI Analysis: Incorporates three different lengths of RSI (short, medium, and long), providing insights into the momentum and trend strength at various timeframes.
Deoscillation of RSI: The RSI for each length is 'deoscillated' by adjusting its scale to align with the actual price movements. This is achieved by shifting and scaling the RSI values, effectively merging them with the price line.
Average True Range (ATR) Scaling: The deoscillation process includes scaling by the Average True Range (ATR), making the indicator responsive to the asset’s volatility.
Optional Smoothing: Provides an option to apply a simple moving average (SMA) smoothing to each deoscillated RSI line, reducing noise and highlighting more significant trends.
Dynamic Moving Average (MA) Baseline: Features a moving average calculated from the medium length (default value) de-oscillated RSI, serving as a dynamic baseline to identify overarching trends.
How It’s Different
Unlike standard RSI indicators that oscillate in a fixed range, this indicator transforms the RSI to move in tandem with the price, offering a unique perspective on momentum and trend changes. The use of multiple timeframes for RSI and the inclusion of a dynamic MA baseline provide a multifaceted view of market conditions.
Potential Usage
Trend Identification: The position of the price in relation to the different deoscillated RSI lines and the MA baseline can indicate the prevailing market trend.
Momentum Shifts: Crossovers of the price with the deoscillated RSI lines or the MA baseline can signal potential shifts in momentum, offering entry or exit points.
Volatility Awareness: The ATR-based scaling of the deoscillated RSI lines means the indicator adjusts to changes in volatility, potentially offering more reliable signals in different market conditions.
Comparative Analysis: By comparing the short, medium, and long deoscillated RSI lines, traders can gauge the strength of trends and the convergence or divergence of momentum across timeframes.
Best Practices
Backtesting: Given its novel nature, it’s crucial to backtest the indicator across different assets and market conditions.
Complementary Tools: Combine with other technical analysis tools (like support/resistance levels, other oscillators, volume analysis) for more robust trading signals.
Risk Management: Always use sound risk management strategies, as no single indicator provides foolproof signals.

[blackcat] L3 Inverted VixFix Indicator with RSI ScalingThis pine script that creates a custom indicator called the Inverted VixFix Indicator with RSI Scaling. This indicator combines two well-known technical indicators - the VixFix and the RSI - to create a more comprehensive view of market conditions.
The VixFix is a technical indicator that helps identify market trends and volatility. It is based on the highest close of the past 22 bars and the lowest low of the same period. The VixFix is calculated as 100 times the difference between the highest close and the current low divided by the highest close. The indicator is inverted, meaning that high values indicate low volatility and low values indicate high volatility.
The RSI (Relative Strength Index) is a momentum indicator that measures the strength of price action in a given period. It is calculated based on the closing prices of the selected asset. The RSI is scaled to a range between 0 and 100, with values above 70 indicating overbought conditions and values below 30 indicating oversold conditions.
The Inverted VixFix Indicator with RSI Scaling combines these two indicators to give a more comprehensive view of market conditions. The RSI is first scaled to a range between 0 and 100 using the RSI Length, RSI Overbought, and RSI Oversold inputs. The Inverted VixFix is then scaled to the same range as the RSI using the RSI Overbought and RSI Oversold inputs. The two indicators are then combined to create the Inverted VixFix Indicator with RSI Scaling.
To smooth out the RSI, the script also uses the ALMA (Arnaud Legoux Moving Average) function. This function is a type of moving average that uses a variable smoothing factor to give more weight to recent price action. In this script, the ALMA is applied to the scaled RSI with a length of 3, a offset of 0.58, and a sigma of 6.
To help visualize the indicator, the script also creates visual elements such as threshold lines and fills. The Bull Threshold line is drawn at the RSI Overbought level and the Bear Threshold line is drawn at the RSI Oversold level. A fill is then created between these two lines using the color purple and opacity set to 70%.
Overall, the Inverted VixFix Indicator with RSI Scaling is a useful tool for traders looking for a more comprehensive view of market conditions. By combining the VixFix and RSI indicators, this script provides a more nuanced view of market trends and volatility.

Xeeder - Comparison RSI IndicatorXeeder - Comparison RSI Indicator (CRI)
The "Xeeder - Comparison RSI Indicator" (CRI) is a sophisticated tool designed to assist traders in analyzing and comparing the Relative Strength Index (RSI) and Moving Averages (MA) of two different securities simultaneously. This indicator is instrumental in identifying potential shifts in market momentum and strength between two assets.
Details of the Indicator:
Security Input Settings: This feature allows traders to input the symbols of two securities they wish to compare. The input is facilitated through text boxes where traders can enter the ticker symbols of their chosen securities.
Moving Average (MA) Settings: Traders have the option to select different types of moving averages such as SMA, EMA, WMA, among others. The settings also allow for the adjustment of the length of the moving average and the standard deviation multiplier for Bollinger Bands.
RSI Settings: This section allows traders to specify the length of the RSI calculation, which is used to analyze the momentum of the securities.
Dynamic RSI and MA Plotting: The indicator plots the RSI and its moving average for both securities dynamically on the chart, with distinct colors for easy differentiation and analysis.
RSI Bands: The indicator displays multiple RSI bands (Upper Band 1 & 2, Middle Band, Lower Band 1 & 2) as dashed horizontal lines, helping traders identify potential overbought and oversold regions.
Gradient Fill for Overbought and Oversold Regions: The indicator features a gradient fill between the RSI plot and the middle line, visually representing the overbought and oversold regions in different colors.
How to Use the Indicator:
Input Security Symbols: Start by entering the symbols of the two securities you wish to compare in the respective input boxes.
Configure MA and RSI Settings: Adjust the settings for the moving average type, length, and RSI length according to your trading strategy and analysis needs.
Analyze RSI and MA Plots: Observe the plotted RSI and moving averages for both securities to analyze and compare their momentum and trend characteristics.
Utilize RSI Bands: Use the RSI bands as reference points to identify potential overbought and oversold regions, and to gauge the relative strength between the two securities.
Interpret Gradient Fill: Pay attention to the gradient fill regions which visually represent overbought and oversold conditions, assisting in the identification of potential reversal points.
Example of Usage:
As a trader with a knack for developing innovative trading strategies, you can utilize the CRI indicator to enhance your swing trading approach. Here's how you might integrate this tool into your strategy:
Select Securities: Choose two securities that you are interested in comparing, perhaps from sectors you have identified as having potential based on your macroeconomic and geopolitical analysis.
Adjust Settings: Configure the RSI and MA settings to align with the characteristics of the selected securities and your trading strategy.
Analysis and Comparison: Analyze the RSI and MA plots to identify potential divergences or correlations between the two securities, which might indicate trading opportunities.
Utilize RSI Bands: Use the RSI bands to identify potential entry and exit points, aligning them with your analysis of broader market conditions and your trading strategy.
Content Creation: Leverage the insights gained from using the CRI indicator to create captivating content for your audience, sharing your analysis and perspectives on the selected securities and market conditions.
Remember, the CRI indicator serves as a powerful tool in your trading arsenal, offering a unique perspective on market dynamics and facilitating a deeper analysis of securities. Always consider the broader market context and your trading strategy when utilizing this tool.

Zaree - RSI Gradient FillDescription:
The "Zaree - RSI Gradient Fill" (RGF) indicator is a technical analysis tool designed to enhance the interpretation of the Relative Strength Index (RSI) by incorporating visual cues through gradient fill. This indicator aids traders in identifying potential overbought and oversold conditions in the market using the RSI as a key reference.
Details of the Indicator:
The indicator calculates the RSI of a selected source based on user-defined settings for length and source.
Traders have the option to choose from various types of moving averages (SMA, EMA, SMMA, WMA) to calculate the RSI.
RSI values and their corresponding moving average values are plotted on the chart for visual analysis.
The indicator offers customization through input settings for RSI length, RSI source, and moving average type and length.
Upper and lower bands for the RSI are displayed on the chart, providing visual cues for potential overbought and oversold conditions.
A center line is plotted on the chart to help traders identify the equilibrium point of the RSI.
The gradient fill feature enhances the visualization by coloring the space between the RSI plot and the center line based on RSI levels.
How to Use the Indicator:
Specify the RSI length and source for calculation.
Choose the desired moving average type and set the length for the moving average.
Observe the RSI values, moving average lines, and the center line plotted on the chart.
Pay attention to the position of the RSI values relative to the upper and lower bands. Values above the upper band suggest potential overbought conditions, while values below the lower band indicate potential oversold conditions.
Interpret the gradient fill between the RSI plot and the center line. The color changes provide additional visual cues about the RSI's strength compared to the center line.
Example of Usage:
As an experienced swing trader, you can leverage the RGF indicator to fine-tune your trading decisions. Here's an example of how you might use the indicator:
Select your preferred RSI length and source, such as the closing price.
Choose "SMA" as the moving average type and set the length to 14.
Observe the RSI values plotted on the chart along with the upper and lower bands.
Pay special attention to the gradient fill between the RSI plot and the center line. This coloring offers valuable insights into the RSI's position relative to equilibrium.
Look for instances where the RSI values cross above or below the upper and lower bands. These crossings can signal potential trend shifts or reversals.
Use the gradient fill colors to quickly assess the strength of the RSI's deviation from the center line.
Remember that the RGF indicator is a powerful tool to complement your trading strategy. Consider combining its insights with other technical and fundamental analyses for well-informed trading decisions.
Feel free to adjust the indicator settings according to your trading preferences and style. While the RGF indicator provides valuable visual cues, always consider the broader context of the market before making trading choices.

Zaree - FX Index RSI IndicatorDescription:
The "Zaree - FX Index RSI Indicator" (FIRI) is a technical analysis tool designed to provide insights into the relative strength of two selected currency indices using the Relative Strength Index (RSI). It allows traders to compare the RSI values of a primary currency index and a secondary currency index, helping them identify potential overbought and oversold conditions in the currency market.
Details of the Indicator:
The indicator calculates the RSI for both the primary and secondary currency indices based on the user's selections.
Traders can choose from a variety of currency indices to use as the primary and secondary indices for comparison.
The indicator offers settings for customizing the calculation of the RSI, including selecting the type of moving average (SMA, EMA, WMA, SMMA) and adjusting the length of the RSI and moving average.
Upper and lower RSI bands are displayed on the chart to highlight potential overbought and oversold conditions.
The RSI values and their corresponding moving average values are plotted on the chart, allowing traders to visually analyze the relative strength of the indices.
How to Use the Indicator:
Select the primary and secondary currency indices you want to compare from the provided dropdown menus. These indices will serve as the basis for RSI calculation.
Choose the type of moving average (SMA, EMA, WMA, SMMA) to use for RSI calculation and set the desired length for the moving average.
Decide whether you want to visualize the RSI and moving average values for the primary and secondary indices on the chart.
Observe the RSI values and moving averages plotted on the chart. The indicator's upper and lower bands can help you identify potential overbought (above the upper band) and oversold (below the lower band) conditions.
Pay attention to the intersections between the RSI values and the moving average lines. These intersections can provide insights into potential trend changes or reversals in the currency market.
Example of Usage:
Let's say you're a swing trader focusing on currency pairs involving the US Dollar (USD) and Euro (EUR). You want to compare the relative strength of the USD Index (USDINX) and the EUR Index (EURINX) to identify potential trading opportunities. Here's how you can use the FIRI indicator:
Select "USDINX" as the primary index and "EURINX" as the secondary index.
Choose "SMA" as the moving average type and set the RSI length to 14.
Enable the visualization of RSI values for both the primary and secondary indices.
Observe the chart to identify instances where the RSI values of the indices cross above the upper band (potential overbought) or below the lower band (potential oversold).
Look for intersections between the RSI values and the moving average lines. A bullish signal may occur when the RSI crosses above the moving average, indicating potential upward momentum, while a bearish signal may occur when the RSI crosses below the moving average, indicating potential downward momentum.
Remember that the FIRI indicator is a tool to assist you in your analysis. It's important to consider other technical and fundamental factors before making trading decisions.
Feel free to adjust the settings of the indicator based on your trading preferences and strategy. Keep in mind that no indicator is foolproof, and it's recommended to use the FIRI indicator in conjunction with other analysis techniques for a comprehensive trading approach.

Pro RSI CalculatorThe "Pro RSI Calculator" indicator is the latest addition to a series of custom trading tools that includes the "Pro Supertrend Calculator" and the "Pro Momentum Calculator."
Building upon this series, the "Pro RSI Calculator" is designed to provide traders with further insights into market trends by leveraging the Relative Strength Index (RSI) indicator.
Its primary objective remains consistent: to analyze historical price data and make informed predictions about future price movements, with a specific focus on identifying potential bullish (green) or bearish (red) candlestick patterns.
1. RSI Calculation:
The indicator begins by computing the RSI, a widely used momentum oscillator. It calculates two crucial RSI parameters:
RSI Length: This parameter determines the lookback period for RSI calculations.
RSI Upper and Lower Bands: These thresholds define overbought and oversold conditions, typically set at 70 and 30, respectively.
2. RSI Bands Visualization:
The RSI values obtained from the calculation are skillfully plotted on the price chart, appearing as two distinct lines:
Red Line: Represents the RSI when indicating a bearish trend, anticipating potential price declines.
Teal Line: Represents the RSI in bullish market conditions, signaling the possibility of price increases.
3. Consecutive Candlestick Analysis:
The indicator's core functionality revolves around tracking consecutive candlestick patterns based on their relationship with the RSI lines.
To be included in the analysis, a candlestick must consistently close either above (green candles) or below (red candles) the RSI lines for multiple consecutive periods.
4. Labeling and Enumeration:
To communicate the count of consecutive candles displaying consistent trend behavior, the indicator meticulously assigns labels to the price chart.
Label positioning varies depending on the trend's direction, appearing either below (for bullish patterns) or above (for bearish patterns) the candlesticks.
The color scheme aligns with the candle colors: green labels for bullish candles and red labels for bearish ones.
5. Tabular Data Presentation:
The indicator enhances its graphical analysis with a customizable table that prominently displays comprehensive statistical insights.
Key data points in the table include:
- Consecutive Candles: The count of consecutive candles displaying consistent trend characteristics.
- Candles Above Upper RSI: The number of candles closing above the upper RSI threshold during the consecutive period.
- Candles Below Lower RSI: The number of candles closing below the lower RSI threshold during the consecutive period.
- Upcoming Green Candle: An estimated probability of the next candlestick being bullish, derived from historical data.
- Upcoming Red Candle: An estimated probability of the next candlestick being bearish, also based on historical data.
6. Custom Configuration:
To cater to various trading strategies and preferences, the indicator offers extensive customization options.
Traders can fine-tune parameters like RSI length, upper, and lower bands, label and table placement, and table size to align with their unique trading approaches.

Enhanced Smoothed RSIThe "Enhanced Smoothed RSI Factor" indicator is a robust technical analysis tool designed to assist traders in identifying potential trends and reversals. This indicator combines elements of the Relative Strength Index (RSI) with a smoothed factor, enhancing its reliability and responsiveness. By visualizing the Enhanced Smoothed RSI Factor alongside the standard RSI and their associated upper and lower bands, traders gain insights into potential overbought and oversold conditions, facilitating more informed trading decisions.
How to Use:
Inputs Configuration : Adjust the indicator's parameters according to your trading preferences. Modify the source data (source) to suit the price data you want to analyze. Set the RSI period (rsiPeriod) for RSI calculations, the moving average period (movingAvgPeriod) for the bands, and the smoothing factor (factor) for enhanced responsiveness.
Enhanced Smoothed RSI Factor : The indicator calculates the Enhanced Smoothed RSI Factor by applying an exponential moving average (EMA) to the RSI values. This factor reflects changes in price momentum.
Comparison with Standard RSI : Observe the Enhanced Smoothed RSI Factor and the standard RSI side by side on your chart. While the standard RSI offers insights into price momentum, the Enhanced Smoothed RSI Factor adds an extra layer of smoothing for potentially clearer trend indications.
Bands and Bar Coloring : The indicator plots upper and lower bands, which are derived from weighted and simple moving averages of the Enhanced Smoothed RSI Factor. The color of the bars changes based on the position of the Enhanced Smoothed RSI Factor relative to the bands. Green bars indicate values above the upper band, red bars indicate values below the lower band, and gray bars indicate values within the bands.
Overbought and Oversold Levels : The indicator provides horizontal lines at levels 140 and 80. When the Enhanced Smoothed RSI Factor crosses above 140, it suggests a potential bullish trend, while crossing below 80 suggests a potential bearish trend. Additionally, levels 200 and 180 indicate overbought conditions, and levels 100 and 80 indicate oversold conditions.
Additional Insights : The indicator's upper and lower bands provide valuable insights into potential trend reversals. When the Enhanced Smoothed RSI Factor crosses above the upper band, it may signal an overextended bullish trend. Conversely, a crossover below the lower band may indicate an overextended bearish trend.
Important Considerations :
This indicator is most effective when used in conjunction with other technical analysis tools and strategies.
It's recommended to avoid making trading decisions solely based on the Enhanced Smoothed RSI Factor. Combine it with other indicators, chart patterns, and fundamental analysis.
Adjust the overbought and oversold levels to align with your trading strategy and the specific market conditions.
Please remember that trading involves risks, and the indicator's signals are not guaranteed. Always conduct thorough research and consider using a practice account before implementing any trading strategy.

Hancock - RSI [Session]This is an improvement of my RSI Volume indicator.
I have made a session based RSI indicator which helps to aid the decision making upon session opens and gives a good indication of trend during. It also has various fixes for bugs found in the above indicator.
It has multiple settings to configure:
Use session: This toggles the RSI to be session based mode.
Session - Time: The session hours for the RSI .
Session - Days of Week: This is the days for the session based RSI to use.
Session - Mode: The RSI is reset when a new session starts. This mode adjusts how the initial value of the RSI is calculated:
OC: RSI uses the absolute open - close * volume value.
TR: RSI uses the true range * volume value.
VOL: RSI uses the volume value.
TF - Resolution: This is the lower time frame to be used in calculating the wick adjusted buy and sell volume used in the calculation of Volume weighted RSI . A lower time frame produces more accurate buy and sell volumes.
Use Volume: Enabling this produces a Volume weighted RSI . Disabled produces a normal RSI .
Use Wicks: Enabling this adjusts the calculation for buy and sell volume by taking wicks into account.
RSI - Length: This is the length to be used for the RSI . If session based this is the maximum value the RSI length can be - length can be shorter to not include previous session data.
RSI - Overbought: This is the "overbought" level for the RSI .
RSI - Oversold: This is the "oversold" level for the RSI .
RSI - Threshold: This is the threshold used to indicate trend change colours on the RSI .
Happy Trading
Hancock

Indicators: 6 RSI variationsAs we all know, as published by Wilder, RSI makes use of "CLOSE" values. You probably have experimented changing the input to hl2 or hlc3 . I have included many other RSI variations in this chart. Refer to the developers section below to learn how you can use this code in your scripts.
1) RSI with Volume
---------------------------------------------
Suggested by Morris, this idea adds volume to the RSI indicator. Because volume offers one means of determining whether money is entering or leaving a market, this would provide additional information with which to make trading decisions.
2) RSI using last Open
---------------------------------------------
This is RSI with yesterday's open, This basically compares two full days of price action and in the process produces a smoother RSI line.
RSI of today's close is used as a signal (blue line).
3) RSI using SMA
---------------------------------------------
Wilder used his own MA for calculating RSI (check my post on Wilders MA here - -- This closely resembles EMA). One of Morris's suggestion is to try out SMA.
Compared to normal RSI, you will see more squiggles here.
4) RSI using EMA
---------------------------------------------
Same idea as above, but using EMA.
5) RSI with Fibs
---------------------------------------------
How much does RSI retrace? This makes it easy to determine that :)
6) RSI of MACD
---------------------------------------------
As I mentioned earlier, RSI is a pluggable formula. You can substitute "close" with any data series to derive an index out of it.
This shows RSI of MACD. Note that this is range bound.
More info on RSI variations:
drive.google.com
For Pinescript developers:
---------------------------------------------
You can substitute your favorite indicator in the RSI function. I have made the RSI calculation a separate function in all the indicators above.
Following are the reusable functions (simply copy to your script and call with proper arguments):
* WiMA(src, length)
* calc_rsi(fv, length): This is equivalent to stock rsi() in TV.
* calc_rsi_volume(fv, length)
* calc_rsi_sma(fv, length)
* calc_rsi_ema(fv, length)
* calc_rsi_lastopen(fv, length)
* calc_macd(src, fast, slow)
You can also pick up fibs drawing code and put in on any indicator.
