Relative Volume (RVOL) - Beasley SavageRelative Volume, often times called RVOL, is an indicator that tells traders how current volume is compared to past trading volumes over a given period. It is kind of a like a radar for how “in-play” a stock is. The higher the relative volume is the more in play it is.
Relative Volume is displayed as a ratio. So if it is showing 3.5 relative volume, that means it is trading at 3.5 times its normal volume.
스크립트에서 "relative volume"에 대해 찾기

Relative Volume EMA (RVOL)Relative Volume EMA (RVOL) measures the current bar’s volume relative to its typical volume over a selected lookback period.
It helps traders identify whether a price move is supported by real participation or if it’s occurring on weak, low-quality volume.
This version uses:
RVOL = Current Volume ÷ Volume EMA
Volume EMA Length: adjustable
Signal Threshold: a customizable horizontal line (default = 1.2)
How to Use
1. RVOL > 1.2 → High-Quality Momentum
A value above 1.2 indicates that the current bar has at least 20% more volume than normal, suggesting:
Strong conviction
Algorithmic activity
Momentum-backed breakout or breakdown
Higher probability trend continuation
These bars are ideal for confirming entries after a technical setup (e.g., pullback, engulfing pattern, Ichimoku trend confirmation, etc.).
2. RVOL < 1.0 → Weak or Low-Quality Move
When RVOL is below 1.0:
Volume is below average
Moves are more likely to fail or reverse
Breakouts are unreliable
Triggers lack institutional participation
These bars are best avoided for trade entries.
Why This Indicator Is Useful
In many strategies, price alone is not enough.
RVOL acts as a filter to ensure that your signals occur during times when the market is actually active and committed.
Typical use cases:
Confirm trend-following entries
Validate pullbacks and breakout candles
Filter out low-volume chop
Identify session-based volume surges
Improve risk-to-reward quality by entering only during true momentum
Recommended Settings
EMA Length: 20
Threshold Line: 1.2
Works well on Forex, Crypto, and Indices
Best used on 15m, 30m, 1H, and 4H charts

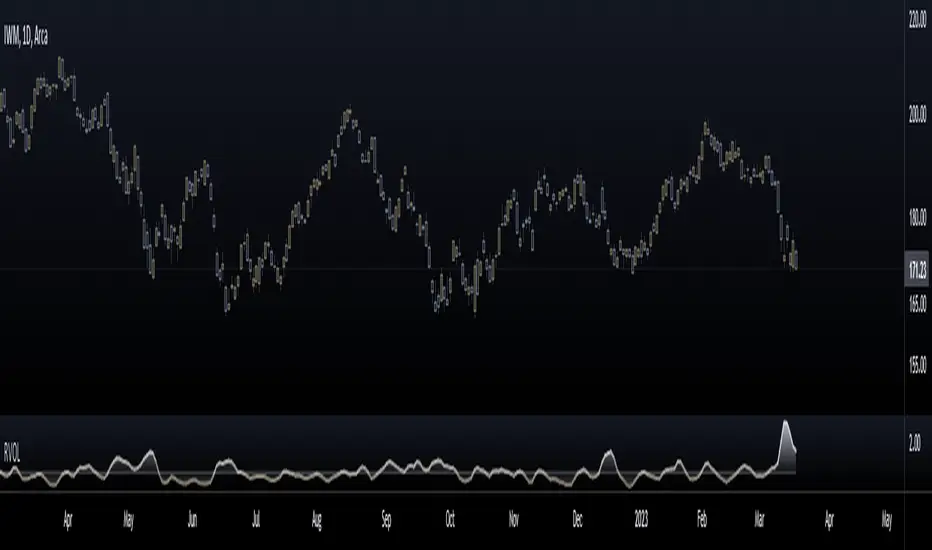
Relative Volume RVOL AlertsRelative Volume or RVOL is an indicator used to help determine the amount of volume change over a given period of time.
It is often used to help traders determine how in-play a ticker is.
General rule of thumb is the higher the RVOL, the more in play a stock is.
I myself like to use it as a substitute of the volume indicator itself.
Basic Calculation:
Relative Volume = Current Volume / Average Volume
Crossover Signals:
Any time there is a volume spike which causes a crossover of the user set 'Smoothed Moving Average' or 'Threshold' a green/red dot will appear at the top. The color of the dot is dependent on closing of the candle. Therefore it does not necessarily mean price will continue in that direction since volume spikes often happen in peaks or valleys.
Threshold:
The level at which custom alerts and signal can be set. The higher the value, the more volume required to trigger.
Built in Alerts:
You can set custom alerts for the crossovers of the adjustable threshold, or the average RVOL band.

Relative Volume (Multi-TF, D, W, M)Relative Volume (Multi-TF, Candle-Matched Colors)
This indicator measures Relative Volume (RVOL) — the ratio of current volume to average historical volume — across any higher timeframe (Daily, Weekly, or Monthly) and displays it as color-coded columns that match the candle colors of the chart you’re viewing.
RVOL reveals how active today’s market participation is compared to its typical rhythm.
RVOL = 1.0 → normal volume
>1.5 → rising interest
>2.0–3.0 → strong institutional participation
>5.0 → climax or exhaustion levels
Features
Works on any chart timeframe while computing RVOL from your chosen higher timeframe (e.g., show Daily RVOL while trading on a 5-minute chart).
Column colors automatically match your chart’s candle colors (green/red/neutral).
Adjustable lookback period (len) and selectable source timeframe (D, W, or M).
Pre-drawn horizontal guide levels at 1.0, 1.2, 1.5, 2, 3, and 5 for quick interpretation.
Compatible with all chart types, including Heikin Ashi or custom color schemes.
Typical Use
Swing trading:
Look for quiet bases where RVOL stays 0.4–0.9, then expansion ≥2 on breakout days.
Confirm follow-through when green days keep RVOL ≥1.2–1.5 and red pullbacks stay below 1.0.
Day trading:
Watch intraday RVOL (on 1–5m charts) for bursts ≥2 that sustain for several bars — this signals crowd engagement and valid momentum.
Interpretation Summary
RVOL Value Meaning Typical Action
0.4–0.9 Quiet base / low interest Watch for setup
1.0 Normal activity Neutral
1.2–1.5 Valid participation Early confirmation
2–3 Strong expansion Momentum / breakout
≥5 Climax / exhaustion Take profits or avoid new entries
Author’s note:
RVOL isn’t directional; it tells how many players are active, not who’s winning. Combine it with structure (levels, VWAP, or trend) to see when the market crowd truly commits.

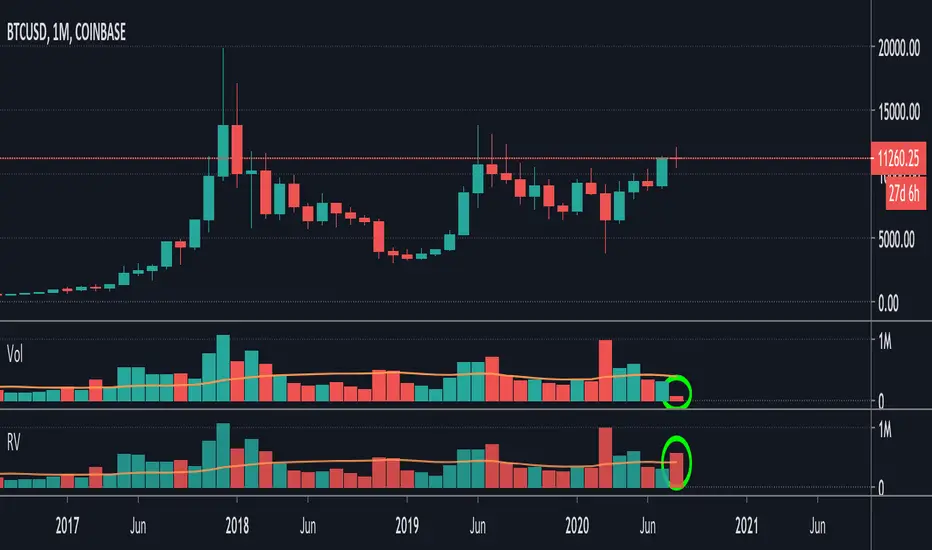
Relative Volume (RV)Relative Volume take the volume at a given time of day and compares it to the average volume at that time of day. You can either use the current volume or the cumulative volume in this analysis. You have the option to either see the average and the current volume or a comparative view where you see the percent difference between now and the average.
My implementation of relative volume uses a key-value pair to simplify the process of getting the average volume for the time of day. This reduces the lines of code needed and makes it easier to understand. I have added the normal features you would find in a relative volume indicator with the addition of an average above/below average section for comparing the significance of above/below average moves are. I hope this script is not only useful but educational.
Enjoy

Relative Volume (RVOL)Relative Volume is calculated by taking the ratio of current volume relative to a moving average of your choice. It gives you a quick way to see how much volume is involved in the current movement relative to a recent period.
Features:
-Customizable Moving Average: You can choose the period (default is 21) and type (SMA or EMA)
-Customizable base level: Default setting is 1.
-Smoothing option: Uses a Hull moving average to smooth out the RVOL area plot, by default its turned off.
Enjoy!

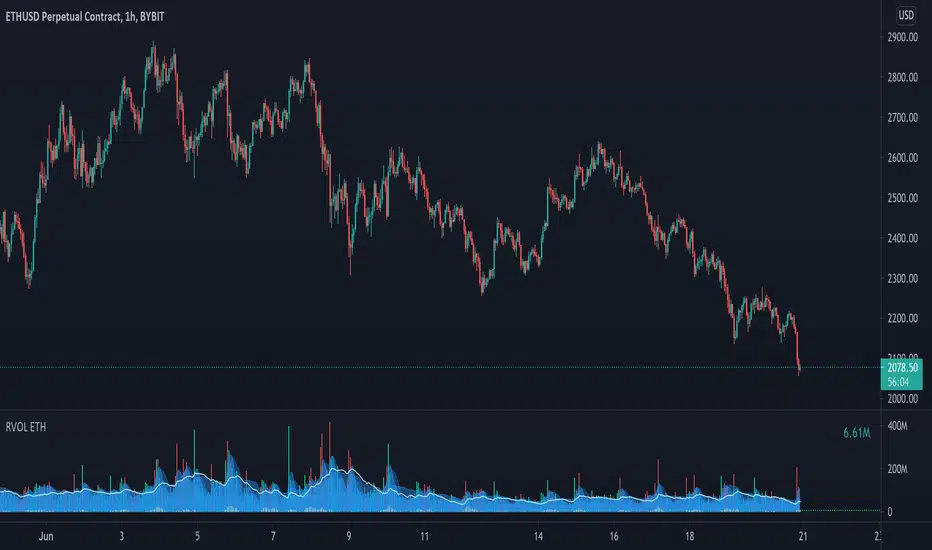
Relative Volume - ETHEREUMRelative Volume indicator that pulls data from 9 different Ethereum exchanges. Please note that this indicator only works with ETH and will not use data from your current chart.
Includes the following exchanges:
BYBIT:ETHUSD
BITFINEX:ETHUSD
BITSTAMP:ETHUSD
INDEX:ETHUSD
COINBASE:ETHUSD
FTX:ETHUSD
PHEMEX:ETHUSD
BITTREX:ETHUSD
POLONIEX:ETHUSDT
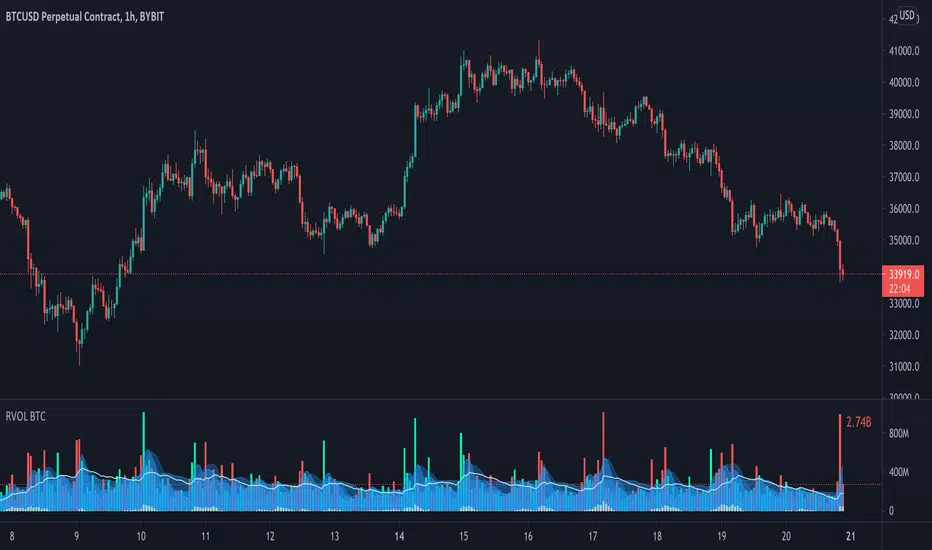
Relative Volume - BITCOINRelative Volume indicator that pulls data from 9 different Bitcoin exchanges. Please note that this indicator only works with BTC and will not use data from your current chart.
Includes the following exchanges:
BYBIT:BTCUSD
BITFINEX:BTCUSD
BITSTAMP:BTCUSD
INDEX:BTCUSD
COINBASE:BTCUSD
FTX:BTCUSD
PHEMEX:BTCUSD
BITTREX:BTCUSD
POLONIEX:BTCUSDT
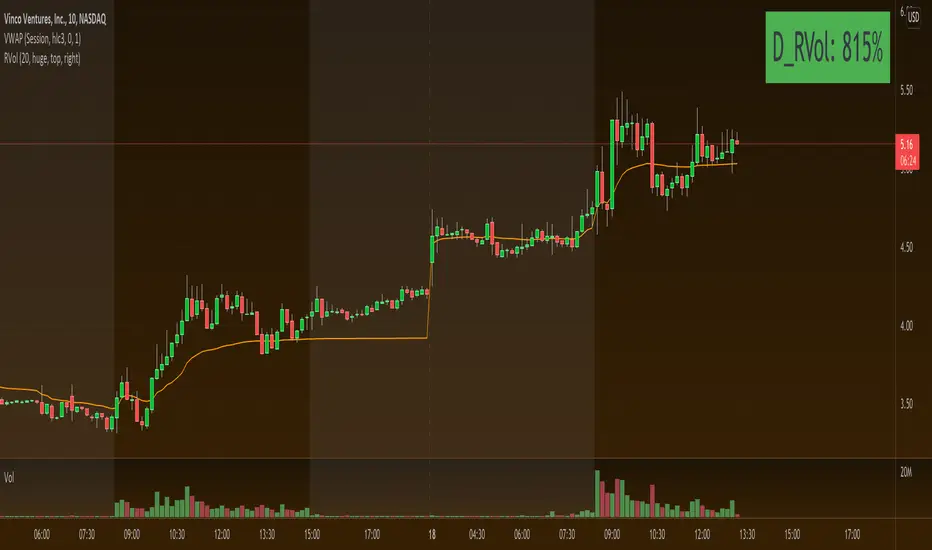
Relative VolumeRelative Volume label in percent. So 400% RVol means, today's volume is 4x compared to avg volume for the length you selected.

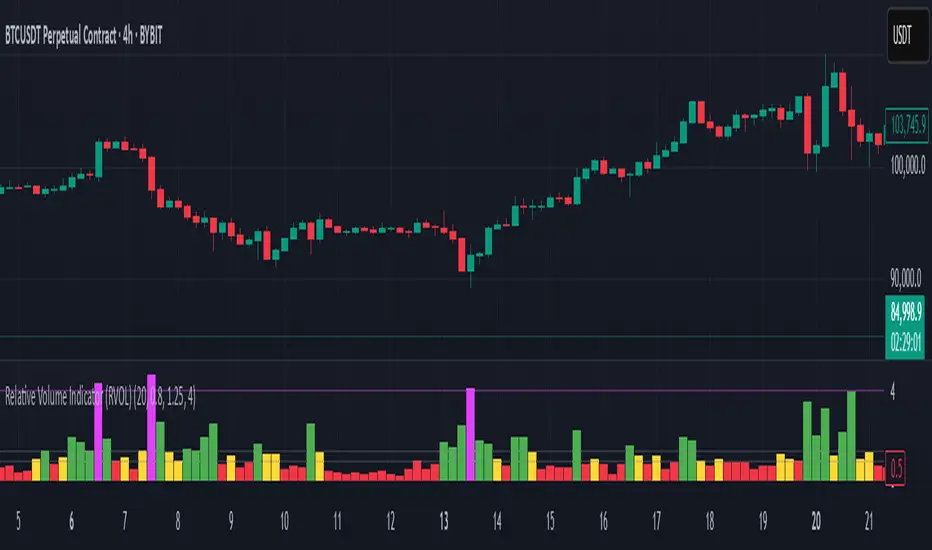
Relative Volume Indicator (RVOL)Relative Volume Indicator (RVOL) is a powerful tool designed for intraday traders who want to quickly identify key areas of interest based on relative volume activity.
This indicator compares the current candle’s volume with the historical average volume over a customizable lookback period (default is 20). It highlights when volume is:
🔴 Below average
🟡 Average
🟢 Above average
🟣 Extremely high
⚙️ Customizable Settings:
Lookback period for average volume
Volume thresholds (average, above average, extreme)
Custom colors for each volume zone
🎯 Best suited for:
Scalping strategies
Breakout confirmation
Volume-based entries at key support/resistance levels
Spotting unusual or algorithmic trading activity
📈 Works across all timeframes.
🎨 Fully customizable from the settings panel.
🔔 Alerts coming in future versions.

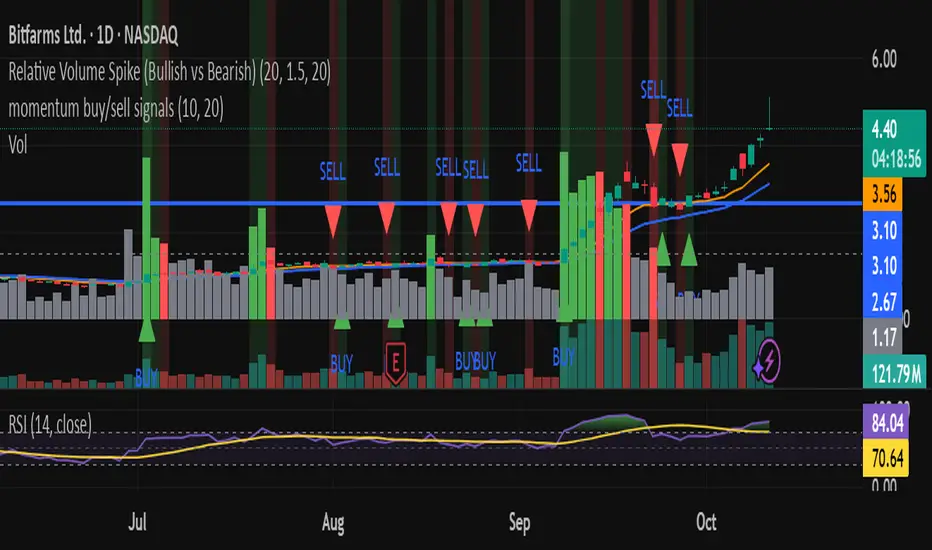
Relative Volume Spike (Bullish vs Bearish)relative volume compared to 20day averages
used to detect when big money is coming in.
Relative Volume Candles [QuantVue]In the words of Dan Zanger, "Trying to trade without using volume is like trying to drive a few hundred miles without putting gas in your tank. Trying to trade without chart patterns is like leaving without having an idea how to get there!"
Volume tends to show up at the beginning and the end of trends. As a general rule, when a stock goes up on low volume, it's seen as negative because it means buyers aren't committed. When a stock goes down on low volume, it means that not many people are trying to sell it, which is positive.
The Relative Volume Candles indicator is based on the Zanger Volume Ratio and designed to help identify key volume patterns effortlessly, with color coded candles and wicks.
The indicator is designed to be used on charts less than 1 Day and calculates the average volume for the user selected lookback period at the given time of day. From there a ratio of the current volume vs the average volume is used to determine the candle’s colors.
The candles wicks are color coded based on whether or not the volume ratio is rising or falling.
So when is it most important to have volume? When prices break out of a consolidation pattern like a bull flag or cup and handle pattern, volume plays a role. When a stock moves out of a range, volume shows how committed buyers are to that move.
Note in order to see this indicator you will need to change the visual order. This is done by selecting the the 3 dots next to the indicator name, scrolling down to visual order and selecting bring to front.
Indicator Features
🔹Selectable candle colors
🔹Selectable ratio levels
🔹Custom lookback period***
***TradingView has a maximum 5,000 bar lookback for most plans. If you are on a lower time frame chart and you select a lookback period larger than 5,000 bars the indicator will not show and you will need to select a shorter lookback period or move to a higher time frame chart.
Give this indicator a BOOST and COMMENT your thoughts!
We hope you enjoy.
Cheers!

Relative Volume Index [PhenLabs]Relative Volume Index (RVI)
Version: PineScript™ v6
Description
The Relative Volume Index (RVI) is a sophisticated volume analysis indicator that compares real-time trading volume against historical averages for specific time periods. By analyzing volume patterns and statistical deviations, it helps traders identify unusual market activity and potential trading opportunities. The indicator uses dynamic color visualization and statistical overlays to provide clear, actionable volume analysis.
Components
• Volume Comparison: Real-time volume relative to historical averages
• Statistical Bands: Upper and lower deviation bands showing volume volatility
• Moving Average Line: Smoothed trend of relative volume
• Color Gradient Display: Visual representation of volume strength
• Statistics Dashboard: Real-time metrics and calculations
Usage Guidelines
Volume Strength Analysis:
• Values > 1.0 indicate above-average volume
• Values < 1.0 indicate below-average volume
• Watch for readings above the threshold (default 6.5x) for exceptional volume
Trading Signals:
• Strong volume confirms price moves
• Divergences between price and volume suggest potential reversals
• Use extreme readings as potential reversal signals
Optimal Settings:
• Start with default 15-bar lookback for general analysis
• Adjust threshold (6.5x) based on market volatility
• Use with multiple timeframes for confirmation
Best Practices:
• Combine with price action and other indicators
• Monitor deviation bands for volatility expansion
• Use the statistics panel for precise readings
• Pay attention to color gradients for quick assessment
Limitations
• Requires quality volume data for accurate calculations
• May produce false signals during pre/post market hours
• Historical comparisons may be skewed during unusual market conditions
• Best suited for liquid markets with consistent volume patterns
Note: For optimal results, use in conjunction with price action analysis and other technical indicators. The indicator performs best during regular market hours on liquid instruments.

Relative Volume (rVol), Better Volume, Average Volume ComparisonThis is the best version of relative volume you can find a claim which is based on the logical soundness of its calculation.
I have amalgamated various volume analysis into one synergistic script. I wasn't going to opensource it. But, as one of the lucky few winners of TradingClue 2. I felt obligated to give something back to the community.
Relative volume traditionally compares current volume to prior bar volume or SMA of volume. This has drawbacks. The question of relative volume is "Volume relative to what?" In the traditional scripts you'll find it displays current volume relative to the last number of bars. But, is that the best way to compare volume. On a daily chart, possibly. On a daily chart this can work because your units of time are uniform. Each day represents a full cycle of volume. However, on an intraday chart? Not so much.
Example: If you have a lookback of 9 on an hourly chart in a 24 hour market, you are then comparing the average volume from Midnight - 9 AM to the 9 AM volume. What do you think you'll find? Well at 9:30 when NY exchanges open the volume should be consistently and predictably higher. But though rVol is high relative to the lookback period, its actually just average or maybe even below average compared to prior NY session opens. But prior NY session opens are not included in the lookback and thus ignored.
This problem is the most visibly noticed when looking at the volume on a CME futures chart or some equivalent. In a 24 hour market, such as crypto, there are website's like skew can show you the volume disparity from time of day. This led me to believe that the traditional rVol calculation was insufficient. A better way to calculate it would be to compare the 9:30 am 30m bar today to the last week's worth of 9:30 am 30m bars. Then I could know whether today's volume at 9:30 am today is high or low based on prior 9:30 am bars. This seems to be a superior method on an intraday basis and is clearly superior in markets with irregular volume
This led me to other problems, such as markets that are open for less than 24 hours and holiday hours on traditional market exchanges. How can I know that the script is accurately looking at the correct prior relevant bars. I've created and/or adapted solutions to all those problems and these calculations and code snippets thus have value that extend beyond this rVol script for other pinecoders.
The Script
This rVol script looks back at the bars of the same time period on the viewing timeframe. So, as we said, the last 9:30 bars. Averages those, then divides the: . The result is a percentage expressed as x.xxx. Thus 1.0 mean current volume is equal to average volume. Below 1.0 is below the average and above 1.0 is above the average.
This information can be viewed on its own. But there are more levels of analysis added to it.
Above the bars are signals that correlate to the "Better Volume Indicator" developed by, I believe, the folks at emini-watch and originally adapted to pinescript by LazyBear. The interpretation of these symbols are in a table on the right of the indicator.
The volume bars can also be colored. The color is defined by the relationship between the average of the rVol outputs and the current volume. The "Average rVol" so to speak. The color coding is also defined by a legend in the table on the right.
These can be researched by you to determine how to best interpret these signals. I originally got these ideas and solid details on how to use the analysis from a fellow out there, PlanTheTrade.
I hope you find some value in the code and in the information that the indicator presents. And I'd like to thank the TradingView team for producing the most innovative and user friendly charting package on the market.
(p.s. Better Volume is provides better information with a longer lookback value than the default imo)
Credit for certain code sections and ideas is due to:
LazyBear - Better Volume
Grimmolf (From GitHub) - Logic for Loop rVol
R4Rocket - The idea for my rVol 1 calculation
And I can't find the guy who had the idea for the multiples of volume to the average. Tag him if you know him
Final Note: I'd like to leave a couple of clues of my own for fellow seekers of trading infamy.
Indicators: indicators are like anemometers (The things that measure windspeed). People talk bad about them all the time because they're "lagging." Well, you can't tell what the windspeed is unless the wind is blowing. anemometers are lagging indicators of wind. But forecasters still rely on them. You would use an indicator, which I would define as a instrument of measure, to tell you the windspeed of the markets. Conversely, when people talk positively about indicators they say "This one is great and this one is terrible." This is like a farmer saying "Shovels are great, but rakes are horrible." There are certain tools that have certain functions and every good tool has a purpose for a specific job. So the next time someone shares their opinion with you about indicators. Just smile and nod, realizing one day they'll learn... hopefully before they go broke.
How to forecast: Prediction is accomplished by analyzing the behavior of instruments of measure to aggregate data (using your anemometer). The data is then assembled into a predictive model based on the measurements observed (a trading system). That predictive model is tested against reality for it's veracity (backtesting). If the model is predictive, you can optimize your decision making by creating parameter sets around the prediction that are synergistic with the implications of the prediction (risk, stop loss, target, scaling, pyramiding etc).
<3

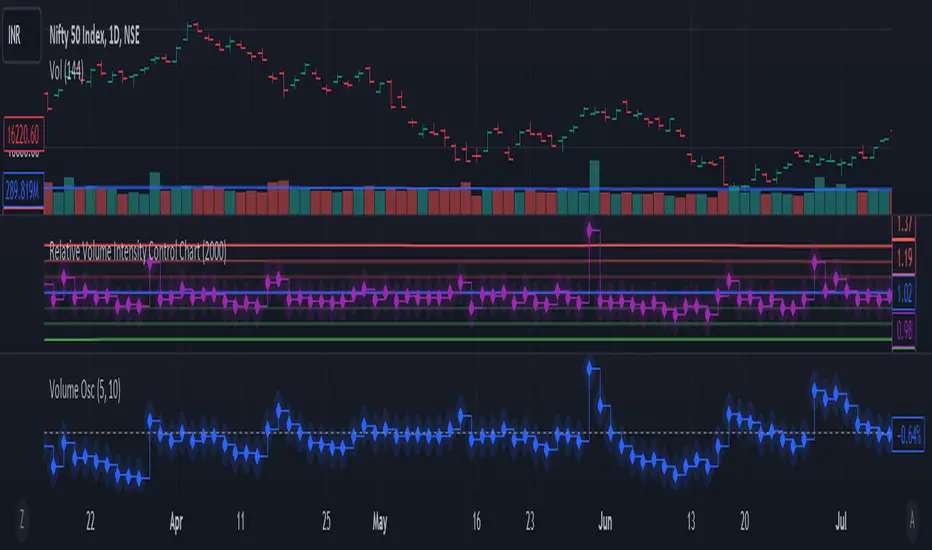
Relative Volume Intensity Control Chart***NOTE THE VOLUME OSCILATOR PROVIDED AT THE BOTTOM IS FOR COMPARSION AND IS NOT PART OF THE INDICATOR****
This indicator provides a comprehensive and a nuanced representation of volume relative to historical volume. The indicator aims to provide insights into the relative intensity of trading volume compared to historical data. It calculates two types of relative volume intensity: mean volume intensity and point volume intensity. The final indicator, "Relative_volume_intensity," is a combination of these two.
1. Point Volume Intensity:
Calculate the ratio of the current volume to the corresponding SMA from the previous period for each of the periods.
Normalize each ratio by dividing it by the corresponding normalized SMA.
Assign weights to each normalized ratio and calculate the point volume intensity.
Point volume intensity calculates the intensity of the current trading volume at a specific point in time relative to its historical moving average. It assesses how much the current volume deviates from the previous historical average for different lookback periods(current volume/ average volume of previous n days). The calculation involves dividing the current volume by the corresponding previous historical moving average and normalizing the result. The purpose of point volume intensity is to capture the immediate impact of the current volume on the overall intensity, providing a more dynamic and responsive measure.
2. Mean Volume Intensity:
Calculate the simple moving averages (SMA) of the volume for different periods (5, 8, 13, 21, 34, 55, 89, 144).
Normalize each SMA by dividing it by the SMA with the longest lookback (144).
Assign weights to each normalized SMA and calculate the mean volume intensity.
Mean volume intensity, on the other hand, takes a broader approach by looking at the mean (average) of various historical moving averages of volume. Instead of focusing on the current volume alone, it considers the historical average intensity over multiple periods. The purpose of mean volume intensity is to provide a smoother and more stable representation of the overall historical volume intensity. It helps filter out short-term fluctuations and provides a more comprehensive view of how the current volume compares to historical norms.
Purpose of Both:
Both point volume intensity and mean volume intensity contribute to the calculation of the final indicator, "Relative_volume_intensity." The idea is to combine these two perspectives to create a more comprehensive measure of relative volume intensity. By assigning equal weights to both components and taking a balanced approach, the indicator aims to capture both short-term spikes in volume and trends in volume intensity over a relatively extended periods.
In calculation of both point volume intensity and mean volume intensity, shorter-term moving averages (e.g., 5, 8) have higher weights, suggesting a greater emphasis on recent volume behavior.
Visualization:
The script then calculates the mean and standard deviation of the relative volume intensity over a specified lookback length.
Plot lines for the centerline (mean), upper and lower 3 standard deviations, upper and lower 2 standard deviations, and upper and lower 1 standard deviation.
Plot the relative volume intensity as a step line with diamond markers.
It is displayed like a control chart where we can see how the relative intensity is behaving when compared to longer historical lookback period.
Relative Volume & RSI PopThis is a basic idea/script designed to take a breakout trade by taking advantage of volume spikes when price/strength is extended (either long or short).
The script only utilises two indicators, the Relative Volume (RV) and the Relative Strength Index (RSI). The script allows the user to select a RSI value between 69 up to 100 for a long trade and between 35 down to 0 for short trade and then pair this with RV from 0 - 10. The period for both the RSI and RV can also be amended by the user but I found in most cases there was no benefit gained by changing away from normal "14" period lookback. The script typically only has small draw downs as the script is designed to exit the trade when the RSI returns back to "normalised" level, therefore the trades are generally quite short. The exit condition for a long trade is when RSI crosses back below 69 (which is why you cannot enter a long below this value) and for a short the, trade will close when RSI crosses back above 35 (which is why you cannot enter a short above this value). These exit values are locked.
By allowing RSI value to go all the way up to "100" on the long side and "0" on the short side this in effect is a way of eliminating the script from taking either longs or shorts if lets say you wanted to back test the script for long only spikes or short only spike. E.G. By setting RSI upper value to "75" the RV to "1" and RSI lower value to "0" then no short trades will not be taken in your back test as the RSI never really gets down to zero.
I put this together with meme stocks in mind and back tested it on day charts for AMC and then a few trending style stocks too. It typically worked best as long only and with RSI settings between 71 - 75 and RV at 1 or 1.5. I also found it had okay results on some lower 1hr timeframe futures markets and weekly time frames too (albeit trades were few and far between on weekly timeframe).
The beauty of such a basic script you could easily set up a trading view screener to look for these opportunities everyday and perhaps even add in an ADX filter on the screener to see if the trend is increasing. Then use this script to run a back test on the stocks that you've selected from the screener.

Relative Volume Bollinger Band %
The Relative Volume Bollinger Band % indicator is a powerful tool designed for traders seeking insights into volume, Bollinger band and relative strength dynamics. This indicator assesses the deviation of a security's trading volume relative to the Bollinger band % indicator and the RSI moving average. Together, these shed light on potential zones of interests where market shifts have a high probability of occurring.
Key Features:
Period: Tailor the indicator's sensitivity by adjusting the period of the smooth moving average and/or the period of the Bollinger band.
How it Works:
Moving Average Calculation: The script computes the simple moving average (SMA) of the relative strength over a defined period. When the higher SMA (orange line) is in the top grey zone, the security is in a zone where it has a high probability of becoming bullish. When the higher SMA is in the lower grey zone, the security is in a zone where it has a high probability of becoming bearish.
-Bollinger Band %: The script also computes the BB% which is primarily used to confirm overbought and oversold areas. When overbought, it turns white and remains white until the overbuying pressure is released indicating that the security is about to become bearish. The script indicates a bearish reversal when the BB% and RVOL bars are both red or when there are no more yellow RVOL bars, if present. When the BB% is<0 and rising, it will also appear white with yellow RVOL bars above. This is a good indication that bulls are beginning to enter buying positions. Confirmation here is indicated when the yellow RVOL bars change to green.
Relative Volume: The indicator then also normalizes the difference volume to indicate areas of high and low volatility. This shows where higher than normal volumes are being traded and can be used as a good indication of when to enter or exit a trade when the above criterions are met.
Visual Representation: The result is visually represented on the chart using columns. Bright green columns signify bullish relative volume values that are much greater than normal. Green columns signify bullish relative volume values that are significant. Red columns represent bearish values that are significant. Blue columns on the BB% indicator represent significant bullish buying in overbought areas. Red columns on the BB% indicator that are < 0 represent a bearish trend that is in an oversold area. This is there to prevent early entry into the market.
Enhancements:
Areas of Interest: Optionally, Areas of interest are represented by red, yellow and green circles on the higher SMA line, aiding in the identification of significant deviations.

Relative Volume at Time█ OVERVIEW
This indicator calculates relative volume, which is the ratio of present volume over an average of past volume.
It offers two calculation modes, both using a time reference as an anchor.
█ CONCEPTS
Calculation modes
The simplest way to calculate relative volume is by using the ratio of a bar's volume over a simple moving average of the last n volume values.
This indicator uses one of two, more subtle ways to calculate both values of the relative volume ratio: current volume:past volume .
The two calculations modes are:
1 — Cumulate from Beginning of TF to Current Bar where:
current volume = the cumulative volume since the beginning of the timeframe unit, and
past volume = the mean of volume during that same relative period of time in the past n timeframe units.
2 — Point-to-Point Bars at Same Offset from Beginning of TF where:
current volume = the volume on a single chart bar, and
past volume = the mean of volume values from that same relative bar in time from the past n timeframe units.
Timeframe units
Timeframe units can be defined in three different ways:
1 — Using Auto-steps, where the timeframe unit automatically adjusts to the timeframe used on the chart:
— A 1 min timeframe unit will be used on 1sec charts,
— 1H will be used for charts at 1min and less,
— 1D will be used for other intraday chart timeframes,
— 1W will be used for 1D charts,
— 1M will be used for charts at less than 1M,
— 1Y will be used for charts at greater or equal than 1M.
2 — As a fixed timeframe that you define.
3 — By time of day (for intraday chart timeframes only), which you also define. If you use non-intraday chart timeframes in this mode, the indicator will switch to Auto-steps.
Relative Relativity
A relative volume value of 1.0 indicates that current volume is equal to the mean of past volume , but how can we determine what constitutes a high relative volume value?
The traditional way is to settle for an arbitrary threshold, with 2.0 often used to indicate that relative volume is worthy of attention.
We wanted to provide traders with a contextual method of calculating threshold values, so in addition to the conventional fixed threshold value,
this indicator includes two methods of calculating a threshold channel on past relative volume values:
1 — Using the standard deviation of relative volume over a fixed lookback.
2 — Using the highs/lows of relative volume over a variable lookback.
Channels calculated on relative volume provide meta-relativity, if you will, as they are relative values of relative volume.
█ FEATURES
Controls in the "Display" section of inputs determine what is visible in the indicator's pane. The next "Settings" section is where you configure the parameters used in the calculations. The "Column Coloring Conditions" section controls the color of the columns, which you will see in three of the five display modes available. Whether columns are plotted or not, the coloring conditions also determine when markers appear, if you have chosen to show the markers in the "Display" section. The presence of markers is what triggers the alerts configured on this indicator. Finally, the "Colors" section of inputs allows you to control the color of the indicator's visual components.
Display
Five display modes are available:
• Current Volume Columns : shows columns of current volume , with past volume displayed as an outlined column.
• Relative Volume Columns : shows relative volume as a column.
• Relative Volume Columns With Average : shows relative volume as a column, with the average of relative volume.
• Directional Relative Volume Average : shows a line calculated using the average of +/- values of relative volume.
The positive value of relative volume is used on up bars; its negative value on down bars.
• Relative Volume Average : shows the average of relative volume.
A Hull moving average is used to calculate the average used in the three last display modes.
You can also control the display of:
• The value or relative volume, when in the first three display modes. Only the last 500 values will be shown.
• Timeframe transitions, shown in the background.
• A reminder of the active timeframe unit, which appears to the right of the indicator's last bar.
• The threshold used, which can be a fixed value or a channel, as determined in the next "Settings" section of inputs.
• Up/Down markers, which appear on transitions of the color of the volume columns (determined by coloring conditions), which in turn control when alerts are triggered.
• Conditions of high volatility.
Settings
Use this section of inputs to change:
• Calculation mode : this is where you select one of this indicator's two calculation modes for current volume and past volume , as explained in the "Concepts" section.
• Past Volume Lookback in TF units : the quantity of timeframe units used in the calculation of past volume .
• Define Timeframes Units Using : the mode used to determine what one timeframe unit is. Note that when using a fixed timeframe, it must be higher than the chart's timeframe.
Also, note that time of day timeframe units only work on intraday chart timeframes.
• Threshold Mode : Five different modes can be selected:
— Fixed Value : You can define the value using the "Fixed Threshold" field below. The default value is 2.0.
— Standard Deviation Channel From Fixed Lookback : This is a channel calculated using the simple moving average of relative volume
(so not the Hull moving average used elsewhere in the indicator), plus/minus the standard deviation multiplied by a user-defined factor.
The lookback used is the value of the "Channel Lookback" field. Its default is 100.
— High/Low Channel From Beginning of TF : in this mode, the High/Low values reset at the beginning of each timeframe unit.
— High/Low Channel From Beginning of Past Volume Lookback : in this mode, the High/Low values start from the farthest point back where we are calculating past volume ,
which is determined by the combination of timeframe units and the "Past Volume Lookback in TF units" value.
— High/Low Channel From Fixed Lookback : In this mode the lookback is fixed. You can define the value using the "Channel Lookback" field. The default value is 100.
• Period of RelVol Moving Average : the period of the Hull moving average used in the "Directional Relative Volume Average" and the "Relative Volume Average".
• High Volatility is defined using fast and slow ATR periods, so this represents the volatility of price.
Volatility is considered to be high when the fast ATR value is greater than its slow value. Volatility can be used as a filter in the column coloring conditions.
Column Coloring Conditions
• Eight different conditions can be turned on or off to determine the color of the volume columns. All "ON" conditions must be met to determine a high/low state of relative volume,
or, in the case of directional relative volume, a bull/bear state.
• A volatility state can also be used to filter the conditions.
• When the coloring conditions and the filter do not allow for a high/low state to be determined, the neutral color is used.
• Transitions of the color of the volume columns determined by coloring conditions are used to plot the up/down markers, which in turn control when alerts are triggered.
Colors
• You can define your own colors for all of the oscillator's plots.
• The default colors will perform well on light or dark chart backgrounds.
Alerts
• An alert can be defined for the script. The alert will trigger whenever an up/down marker appears in the indicator's display.
The particular combination of coloring conditions and the display settings for up/down markers when you create the alert will determine which conditions trigger the alert.
After alerts are created, subsequent changes to the conditions controlling the display of markers will not affect existing alerts.
• By configuring the script's inputs in different ways before you create your alerts, you can create multiple, functionally distinct alerts from this script.
When creating multiple alerts, it is useful to include in the alert's message a reminder of the particular conditions you used for each alert.
• As is usually the case, alerts triggering "Once Per Bar Close" will prevent repainting.
Error messages
Error messages will appear at the end of the chart upon the following conditions:
• When the combination of the timeframe units used and the "Past Volume Lookback in TF units" value create a lookback that is greater than 5000 bars.
The lookback will then be recalculated to a value such that a runtime error does not occur.
• If the chart's timeframe is higher than the timeframe units. This error cannot occur when using Auto-steps to calculate timeframe units.
• If relative volume cannot be calculated, for example, when no volume data is available for the chart's symbol.
• When the threshold of relative volume is configured to be visible but the indicator's scale does not allow it to be visible (in "Current Volume Columns" display mode).
█ NOTES
For traders
The chart shown here uses the following display modes: "Current Volume Columns", "Relative Volume Columns With Average", "Directional Relative Volume Average" and "Relative Volume Average". The last one also shows the threshold channel in standard deviation mode, and the TF Unit reminder to the right, in red.
Volume, like price, is a value with a market-dependent scale. The only valid reference for volume being its past values, any improvement in the way past volume is calculated thus represents a potential opportunity to traders. Relative volume calculated as it is here can help traders extract useful information from markets in many circumstances, markets with cyclical volume such as Forex being one, obvious case. The relative nature of the values calculated by this indicator also make it a natural fit for cross-market and cross-sector analysis, or to identify behavioral changes in the different futures contracts of the same market. Relative volume can also be put to more exotic uses, such as in evaluating changes in the popularity of exchanges.
Relative volume alone has no directional bias. While higher relative volume values always indicate higher trading activity, that activity does not necessarily translate into significant price movement. In a tightly fought battle between buyers and sellers, you could theoretically have very large volume for many bars, with no change whatsoever in bid/ask prices. This of course, is unlikely to happen in reality, and so traders are justified in considering high relative volume values as indicating periods where more attention is required, because imbalances in the strength of buying/selling power during high-volume trading periods can amplify price variations, providing traders with the generally useful gift of volatility.
Be sure to give the "Directional Relative Volume Average" a try. Contrary to the always-positive ratio widely used in this indicator, the "Directional Relative Volume Average" produces a value able to determine a bullish/bearish bias for relative volume.
Note that realtime bars must be complete for the relative volume value to be confirmed. Values calculated on historical or elapsed realtime bars will not recalculate unless historical volume data changes.
Finally, as with all indicators using volume information, keep in mind that some exchanges/brokers supply different feeds for intraday and daily data, and the volume data on both feeds can sometimes vary quite a bit.
For coders
Our script was written using the PineCoders Coding Conventions for Pine .
The description was formatted using the techniques explained in the How We Write and Format Script Descriptions PineCoders publication.
Bits and pieces of code were lifted from the MTF Selection Framework and the MTF Oscillator Framework , also by PineCoders.
█ THANKS
Thanks to dgtrd for suggesting to add the channel using standard deviation.
Thanks to adolgov for helpful suggestions on calculations and visuals.
Look first. Then leap.

Relative Volume Indicator (RVOL)Relative Volume Indicator (RVOL)
The Relative Volume Indicator (RVOL) helps traders identify unusual volume activity by comparing the current volume to the average historical volume. This makes it easier to spot potential breakouts, reversals, or significant market events that are accompanied by volume confirmation.
What This Indicator Shows
This indicator displays volume as a multiple of average volume, where:
- 1.0x means 100% of average volume
- 2.0x means 200% of average volume (twice the average)
- 0.5x means 50% of average volume (half the average)
Color Coding
The volume bars are color-coded based on configurable thresholds:
- Red: Below average volume (< Average Volume Threshold)
- Yellow: Average volume (between Average Volume and Above Average thresholds)
- Green: Above average volume (between Above Average and Extreme thresholds)
- Magenta: Extreme volume (> Extreme Volume Threshold)
Horizontal Reference Lines
Three dotted horizontal reference lines help you visualize the thresholds:
- Lower gray line: Average Volume Threshold (default: 0.8x)
- Upper gray line: Above Average Threshold (default: 1.25x)
- Magenta line: Extreme Volume Threshold (default: 4.0x)
How To Use This Indicator
1. Volume Confirmation: Use green bars to confirm breakouts or trend changes - stronger moves often come with above-average volume.
2. Low Volume Warning: Red bars during price movements may indicate weak conviction and potential reversals.
3. Extreme Volume Events: Magenta bars (extreme volume) often signal major market events or potential exhaustion points that could lead to reversals.
4. Volume Divergence: Look for divergences between price and volume - for example, if price makes new highs but volume is decreasing (more yellow/red bars), the move may be losing strength.
Settings Configuration
- Average Volume Lookback Period: Number of bars used to calculate the average volume (default: 20)
- Average Volume Threshold: Volume below this level is considered below average (default: 0.8x)
- Above Average Threshold: Volume above this level is considered above average (default: 1.25x)
- Extreme Volume Threshold: Volume above this level is considered extreme (default: 4.0x)
- Colors: Customize colors for each volume category
Important Note: Adjust threshold values only through the indicator settings (not in the Style tab). Changing values in the Style tab will not adjust the coloring of the volume bars.
Adjust these settings based on the specific asset being analyzed and your trading timeframe. More volatile assets may require higher thresholds, while less volatile ones might need lower thresholds.
Relative Volume Standard DeviationThe Relative Volume Standard Deviation indicator is a powerful tool designed for traders seeking insights into volume dynamics. This indicator assesses the deviation of a security's trading volume from its moving average, shedding light on potential shifts in market sentiment.
Key Features:
-Length: Tailor the indicator's sensitivity by adjusting the length of the moving average.
-Number of Deviations: Customize the analysis by specifying the number of standard deviations to consider.
-Show Negative Values: Toggle the visibility of negative values in the plot for a comprehensive view.
How it Works:
-Moving Average Calculation: The script computes the simple moving average (SMA) of the trading volume over the specified length, providing a baseline for comparison.
-Standard Deviation Analysis: It calculates the standard deviation of the volume, identifying deviations from the average volume.
-Relative Volume Standard Deviation: The indicator then normalizes the difference between the volume and its moving average by the calculated standard deviation, producing a relative measure of volume deviation.
-Visual Representation: The result is visually represented on the chart using columns. Green columns signify relative volume standard deviation values greater than or equal to the specified number of deviations, while red columns represent values below this threshold.
-Enhancements:
Show Deviation Level: Optionally, a dashed horizontal line at the specified deviation level adds an extra layer of analysis, aiding in the identification of significant deviations.
Relative VolumeIt is difficult to know how much volume is going on DURING the last bar,
therefore this "Relative Volume" (RV) script, previous bars are as usual, but the last one
adjusts the measured volume by comparing how much time passed and multiplying
this with the volume.
Examples:
Here (5 minute bar) there are 31 sec passed of the 5 minutes
The standard volume show little volume (since there is only 31s passed)
The "RV" multiplies this so you'll see how much this volume would be over 5 minutes,
IF everything goes the same for the rest of the 5'.
1' 5sec passed:
(so relatively more volume)
3' 4sec passed:
(With about 2' to go, you see there is a lot going on with the volime,
while seeing the standard volume, nothing much...)
Little 4' passed:
4,5':
Almost 5' gone:
Important:
This "RV" volume can diminish when during the bar the volume fades.
I think this can help evaluating the volume during the last bar
W example:
M example:
(You can clearly see that during the first 4 days there is a lot going on!)