SpaceTime RemasteredSpaceTime Remastered
SpaceTime Remastered provides a new code base for TPO Calculations. Significantly enhanced and some differences justifying leaving both choices for users to choose between. Using the PineV5 library, providing the ability to create a profile of price and time.
The main advantage is now being able to run multiple sessions simultaneously whilst also being more efficient. This has allowed for synchronous data generation for multi profile uses and still executing at a faster speed. Additionally this has given the rise to London, New York and Asia sessions as options with this new knowledge in mind. However, the sessions can be utilised beyond this in the form of D,W,M at the same time as an example with a multitude of possible combinations up to the users interest.
Tick for the multiple sessions to determine the segmented data generation of the TPO, can be split between the sessions and work independently of one another. This tick is vital alongside time and price. The generation of this tool can be used to highlight trending and ranging conditions and opportunities to spot both can be used to take trades, e.g. using value migration in use of trend development.
The release of the AutoTick improvements is significant as well providing more consistency and less affected reaction to the volatility in its calculation leading to a more accurate profile tool. AutoTick is a global controller and will handle tick generation for any enabled session.
The words and their abbreviation plus key.
POC: Point Of Control
VA: Value Area
SP: Single Print
EXS: Excess *sell or buy tail
PHL: Poor High/Low
TPO: Time Price Opportunity
N = Naked e.g. NPOC Naked Point of Control
D = Developing e.g. DVA Developing Value Area
VAStyles and POCStyles exist to better customise the representation of datak,
Show Text Data is toggleable to give the text representation of key inflection points and data. TPO Count, TickSize used, Excess location boundaries, Single Print Location Boundaries.
Display modes exist for All data, VA + Levels and Levels up to the users choosing.
Session timings are adjustable.
ToDo:
Add Initial balance if requested.
Add User Settings for select members of the community.
Add TPO lettering, delayed as mostly unused in predecessor.
Add Rotation Factor
스크립트에서 "poc"에 대해 찾기

Key Levels Importer (blockFlow)Introduction
This script was inspired by the Chart Champions team who generously share the key levels that they are monitoring with the group.
It provides a way for TradingView users to import the levels from a text file (known as the “dataset”) which can also be shared with the community.
The script will plot the levels with different colours depending on whether they are daily, weekly, monthly. volume or fibs.
It will also calculate and draw the high/low for the previous day.
The dataset
The format for the dataset is as follows:
:=::
The type value can be:
D - Daily level
W - Weekly level
M- Monthly level
V - Volume level (eg. VAH, POC, VAL)
F - Fib level
Alternatively you can use freeform text for the type but it may not be colour-coded as you wish
Note, lines and fields without an “=“ are ignored.
Example dataset
:#BTCUSD
:
:---------------------------
:Daily levels
:---------------------------
:
:D=57220:
:D=47724:
:D=40711:
:D=38190:
:D=29775.5:
:
:---------------------------
:Weekly levels
:---------------------------
:
:W=65560.5:
:W=50776:
:W=43190:
:W=31773:
:
:---------------------------
:Monthly levels
:---------------------------
:
:M=61421.5:
:M=43800:
:M=35027:
:
:---------------------------
:Fib levels MTF/HTF
:---------------------------
:
:F=59693.5:
:F=58521.5:
:F=44180.5:
:F=42481.5:
:F=28773:
:F=25984:
:
:---------------------------
:Other levels
:---------------------------
:
:nPOC=47980.5:
:nPOC=48340:
:Global_VAH=63775:
:Global_POC=57364.5:
:Global_VAL=40217:
:MTF_POC=47174:
:MTF_POC=34125.5:
How to import the dataset
It is recommended to create the dataset with a text editor.
To import it:
Open the indicator settings
Click the ‘Import Dataset’ field, press Control-A and Delete to clear out the contents
Copy/paste the dataset into the field
Click Ok
Additional settings
You can choose the line colour for each type of level
Show imported datarows - Check this box to displays the imported dataset values in tabular format on the bottom-left of the chart
Show yellow dots - Show yellow diamonds when price touches a level - see alerting below.
Hide levels > N% from current price - Levels more than 20% away from the current price will be hidden if this box is checked. The percentage value can be changed.
Alerting
The script can raise alerts when the price touches any of the levels.
This is visually represented on the chart by a yellow dot when the "show yellow dots option" is checked.
To avoid duplicate alerts when price repeatedly touches the level, the following criteria must be satisfied before an alert is raised (or a yellow dot printed).
1) Price first touches the level (open,high,low or close)
2) Price did not touch the level in the previous 10 candles

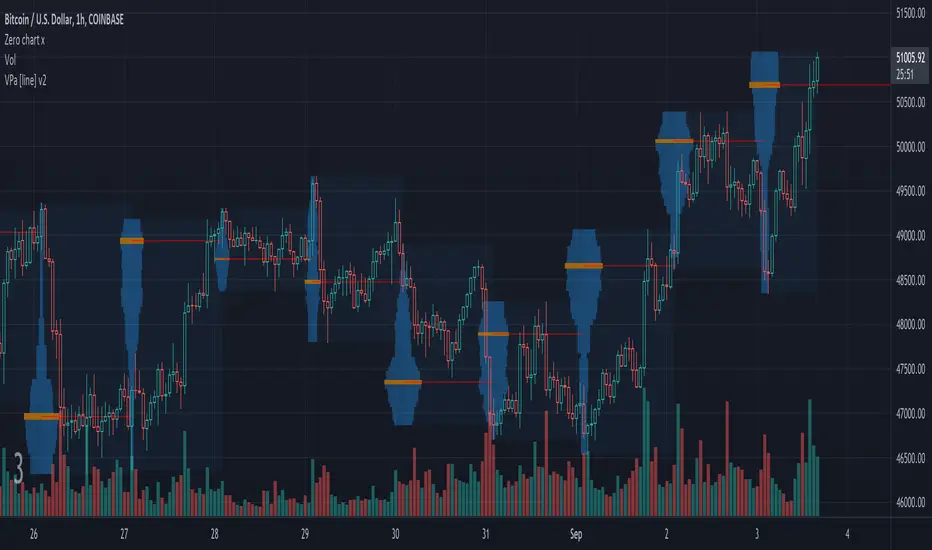
Volume Profile Auto [line]This project is about:
- VPSV
- array.new_line()
- array.new_box()
VPSV (pine) is one of the rare features that draws lines/figures BETWEEN bars
It doesn't run on Pine script, which makes it possible to do such things.
I wanted to have something similar while a restriction of Pine script is the impossibility to draw between bars, the only way I could think of is by using line width
In this script the higher timeframe is started with several lines (left) and a box, this box goes further until the higher timeframe ends.
During the creation of the box, each candle (lower timeframe) in this box (higher timeframe - period) is checked for position and volume, the volume is added to the left line, so when you see a thicker line, this means at that level there is more volume traded.
One of the big differences with other volume profiles is that many look back to a previous period, here when a period starts, the lines collect data - volume until the period ends, it is especially very visible in very low TF's (seconds)
This is my first script with array.new_line() - array.new_box(), which is a very nice Pine feature!
I hope this script can be helpful to see the possibilities
Settings:
'Parts' -> amount of lines (left of box)
5 Parts:
15 Parts:
25 Parts:
50 Parts:
'Max Width' -> Sets the max width of the lines
'Automatic Settings' -> Sets the higher time frame automatically, see the tooltip ⓘ for more info
The yellow line is the max volume line of that period, last period has a red line (POC), also referring the max.
Cheers!
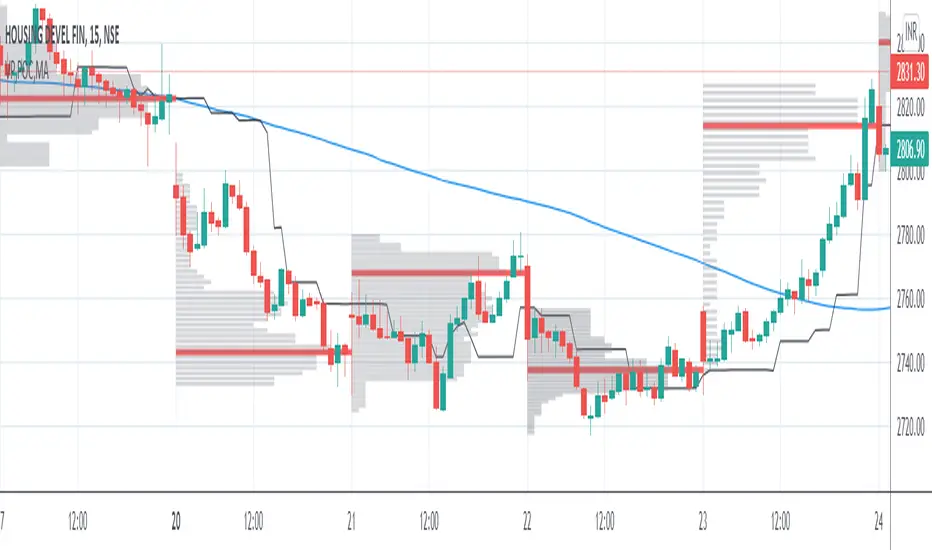
VP and POCThis code is credited to juliangonzaconde. Have taken his help to modify his beautiful creation.
Volume profile is a key study when comes to understanding the auction trading process. Volume Profiles will show you exactly how much volume, as well as relative volume, occurred at each price as well as the exact number of contracts for the entire session. It is a visualization tool to understand the high activity zone and low activity zone.
Volume profile measures the confidence of the traders in the market. From short term trading perspective monitoring the developing volume profile in realtime make more sense to track current market participation behavior to take better trading decisions.
Hope this helps you in trading on daily timeframe.
Happy Trading.
Volume Profile / Fixed RangeHello All,
This script calculates and shows Volume Profile for the fixed range . Recently we have box.new() feature in Pine Language and it's used in this script as an example. Thanks to Pine Team and Tradingview!..
Sell/Buy volumes are calculated approximately!.
Options:
"Number of Bars" : Number of the bars that volume profile will be calculated/shown
"Row Size" : Number of the Rows
"Value Area Volume % " : the percent for Value Area
and there are other options for coloring and POC line style
Enjoy!

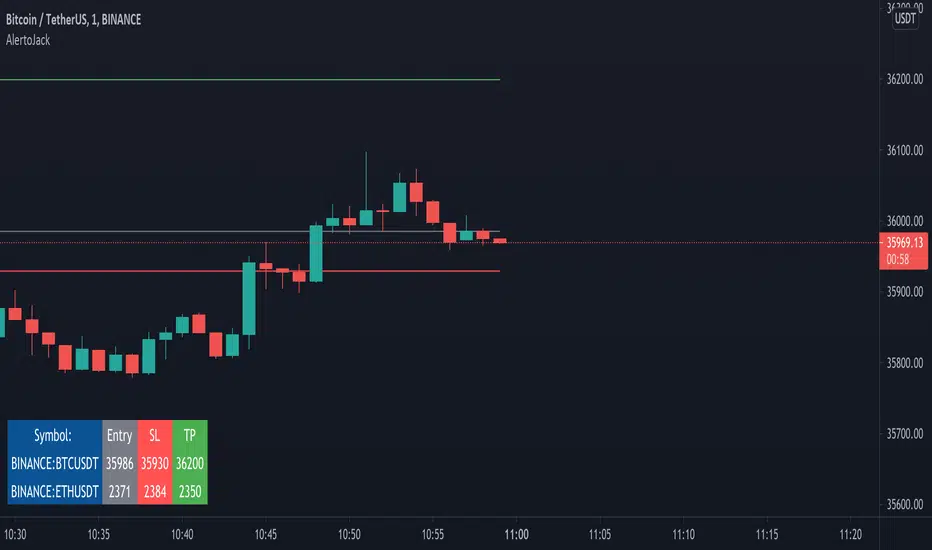
AlertoJack AlertoJack
v0.1a
coded by Bogdan Vaida
This indicator was created to provide easily defined alerts on multiple symbols.
It's still POC code.
Usage:
- Add it on any coin,
- The chart timeframe will be the timeframe for the alerts;
- Configure it with the symbols you want to be alerted on,
- Add the prices to be alerted for,
- Use Add Alert -> condition AlertoJack -> "Any alert() function call"
- Check the Alerts log.
Notes:
- Alert happens when candle crosses the price.
- Because of how Trading View functions, if you modify the indicator settings
you'll need to add the alerts again (because an alert uses the code version
it was created from).
- The alert runs once per current bar's timeframe (e.g. once per minute
if you're on the 1m).
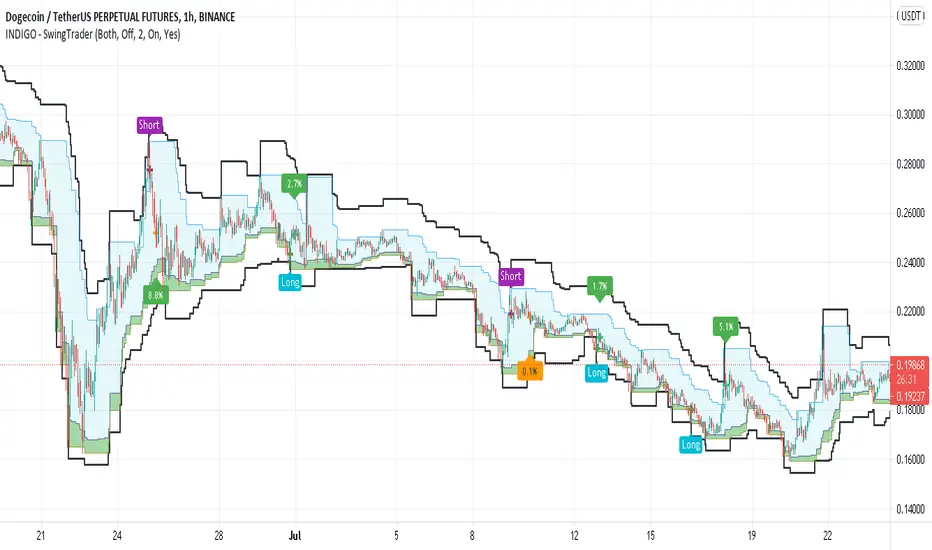
INDIGO - SwingTraderThis is a script that uses a couple of other indicators to find good swing trade entry's and exit's. You can choose which signals the script uses to calculate the position of the signals.
It uses the following:
- Stoch RSI
- MACD
- POC
- INDIGO Cloud
Also added are volume candles, acceleration of momentum indicators (triangle) and MACD candles. This way you can see more info to decide if the entry is valid.
I have used a couple of public scripts and tried to give credit to the original creators. If there is any script that hasn't been credited, please contact me.
Feedback is very much appreciated, positive and negative. Also If you have any question, feel free to ask me. I'll try to answer asap.
Enjoy the script :)
SpaceTime Profiles Non Overlay SpacemanBTCSpaceTime Profiles Non Overlay is a tool used by many traders that aim to get more confluence with their trading style.
ALPHA V1.0.0
Typically, market profile can be used to help determine high value areas where a likely reaction is to occur when price reaches this level, this can provide market generated support and resistance . This indicator uses time price interaction to accurately create a market profile for TradingView, a feature that is useful for many traders who want to expand their knowledge.
User can choose to enable or disable lettering, and further features such as tick size and color are customizable.
Soon I will include additional features such as point of control extending the area of interest.
Currently works in non overlay mode, apply to existing panel to make it easier to chart lines.
Further more an overlay version is in the works
Looking forward to everyone trying this, you can appropriately message me for access.

Arbitrage Sniper (POC)Good Morning Traders!
Today I want to share with you the proof-of-concept of how you would be able to do arbitrage with crypto pairs.
THE INDICATOR MUST BE PLACED ON THE TRADING PAIR OF THE TWO CURRENCIES (i.e. ETH/BTC, EOS/ETH etc.)
This arbitrage method is based on the transitional decorrelation between the crypto treding pair and the price ratio of the involved currencies, of course computing commissions as well.
Whenever the non-arbitrage condition is not respected, there is an arbitrage oportunity.
This indicator won't consider the chance of shorting, so if the arbitrage oportunity occurs the indicator will suggest you just the chance of buying the relative-undervalued currency (but inside the code you will know how to do the alternative method as well, by shorting the relative-overvalued currency)
Let's take the trading pair ETH/BTC (as in the graph) → if we assume commissions for the 0.075% of the order, the non-arbitrage condition will be presented like this
This arbitrage method will need three orders, so n=3
So let's assume that P(ETH)/(P(BTC)*P(ETH/BTC))>(1-0.075)^(-3) → it means that the price of Ethereum is currently overreated enough (relatively to the trading pair) for doing arbitrage.
We have two alternatives:
• Buy BTC, change it into ETH (by "buying" ETH in the trading pair ETH/BTC) and then sell ETH
• Sell ETH, buy BTC, change it into ETH (by "buying" ETH in the trading pair ETH/BTC)
On the other hand, if P(ETH)/(P(BTC)*P(ETH/BTC))<(1-0.075)^(-3) → it means that the price of Ethereum is currently underrared enough (relatively to the trading pair) for doing arbitrage.
We have two alternatives:
• Buy ETH, change it into BTC (by "selling" ETH in the trading pair ETH/BTC) and then sell BTC
• Sell BTC, buy ETH, change it into BTC (by "selling" ETH in the trading pair ETH/BTC)
I'm saying that is nothing more than a proof-of-concept since:
- Arbitrage Oportunities will emerge frequently just nearly zero commissions
- Data of prices are retrieved using security() function and there can be some delay (so the arbitrage oportunity will be already extinguished by the time the signal is retrieved)
- In order to have the freshest data, repiainting will occurr

Trading Ideas - Chart Champions Value - Points of Interest Trading Ideas is based on having visual Points of Interest.
The indicator displays:
- dOpen : Daily Open
- dPOC: Developing Point of Control
- pdPOC : Previous Day Point of Control
- dbyPOC : Day Before Yesterday Point of Control
Initial Balance (High, low, mid points for the first hour (UTC 0000)
- IB High : Initial Balance High
- IB Mid : Initial Balance Middle
- IB Low : Initial Balance Low
Chart Champions Value ( CCV ) is based on Daniel - Chart Champions theory explained in his educational videos.
That if the previous day is a range day and price action (PA) closes:
Above the previous days Value Area High (pdVAH) then there is an 80% chance of it retracing back to previous days Value Area Low (pdVAL)
Below the previous days Value Area Low (pdVAL) then there is an 80% chance of it going back up to the previous days Value Area High (pdVAH)
The CCV check can be ticked on and off for a quick visual to see if the setup could potentially be in play (if green then CCV could be play for that day).
Settings/Configuration
The calculated Value Area (VA) can be amended.
It is recommend to change the resolution to that of your symbol. For example BTC resolution 1, XRP resolution 0.00001.
As seen below having key Points of Interest can make you think twice before going into a trade:
My thanks go to:
ahancock for allowing usage of his script.
AnyDozer and Bjorn Mistiaen on Stack Overflow for all their assistance.
Any feedback will be gratefully received.

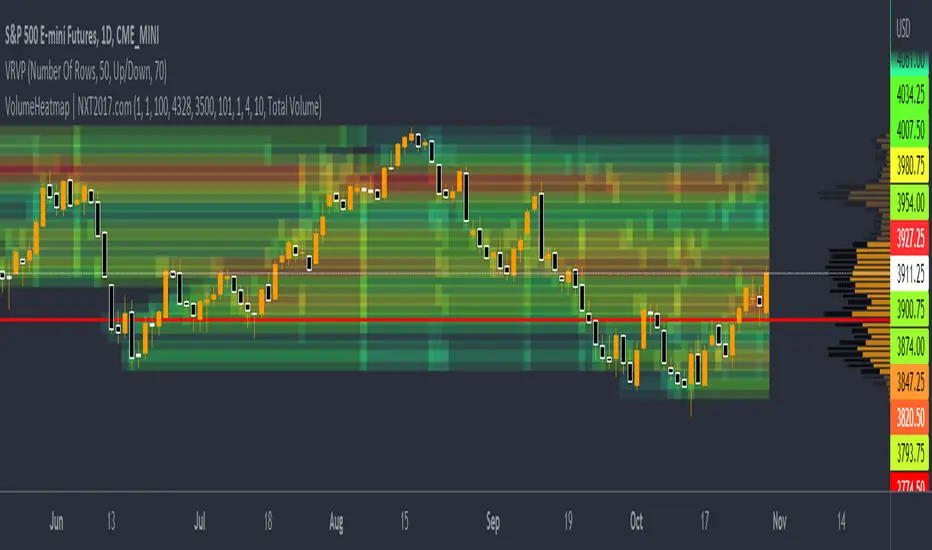
VolumeHeatmap | Experimental Version of Marketorders MatrixDear all,
I wish a Happy New Year!
The last time I tried to developing a Volume Heatmap, that the Marketorders made.
With the currently version I achieve my skills for that and I present it for everyone - some bugs I cannot solve today.
It also possible to see the POC - also the dynamic of volume developing:
The background for that is to find the pricelevel with the most volume - this is for valuetrading always the target.
If someone find it useful or have question - let me know!
Kind regards
NXT2017
Market ProfileHello All,
This is Market Profile script. "Market Profile is an intra-day charting technique (price vertical, time/activity horizontal) devised by J. Peter Steidlmayer. Steidlmayer was seeking a way to determine and to evaluate market value as it developed in the day time frame. The concept was to display price on a vertical axis against time on the horizontal, and the ensuing graphic generally is a bell shape--fatter at the middle prices, with activity trailing off and volume diminished at the extreme higher and lower prices." You better search it on the net for more information, you can find a lot of articles and books about the Market Profile.
You have option to see Value Area, All Channels or only POC line, you can set the colors as you wish.
Also you can choose the Higher Time Frame from the list or the script can choose the HTF for you automatically.
Enjoy!

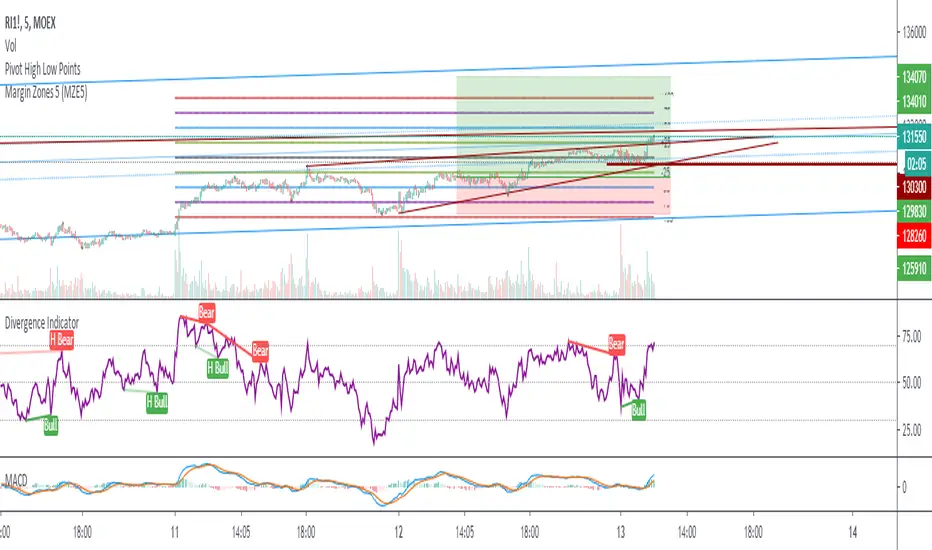
Margin Zones 5 (MZE5)Extended version of MZE script.
This indicator can be set up for 5 different tickers, so you can fill up your favourite tikers as fixed and switch between them without changing settings options of Tick Count, Margin and POC
Using option "Show default Zones if not Matched" - you can set up default options,
switching off "Show default Zones if not Matched" - will hide indicator for not matched tikers
By default option is Off
RUS:
Расширенная версия индикатора MZE, которая позволяет сделать настройки одновременно для 5 разных тикеров, соответственно переключаясь между отслеживаемыми тикерами не нужно каждый раз менять настройки. Достаточно один раз настроить базовые настройки к любимым тикерам и только корректировать значение Маржи и Обеспечения.
Используя Опцию "Show default Zones if not Matched" ("Показывать, когда нет совпадения") - индикатор будет отображаться для всех тикеров с настройками по умолчанию.
И наоборот (по умолчанию): при снятой галочке - индикатор будет отображаться только на тех тикерах, к которым привязан, и не будет мешать на остальных
Hancock - Volume HeatSimple script that shows the volume profile over a moving period as a heat map. Value area is the green area with the white line as the POC.
Happy trading
Hancock

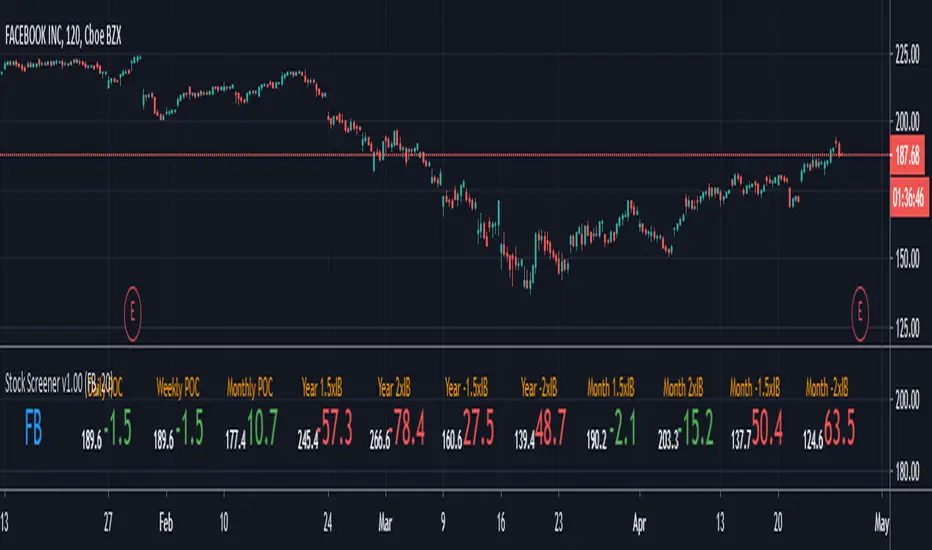
Stock Screener v1.00This script will show you the distance from the selected levels after entering your ticker. The first levels are POCs from the daily, weekly and monthly timeframes, the others are levels specially selected from multiples of the initial ballance on the monthly and higher timeframes. The display is in the form of a lowercase level and the distance of the current price from the level, where red indicates more distant levels and green means that the current price is close to the given level (default is 20 USD away)
send PM or visit website to get access
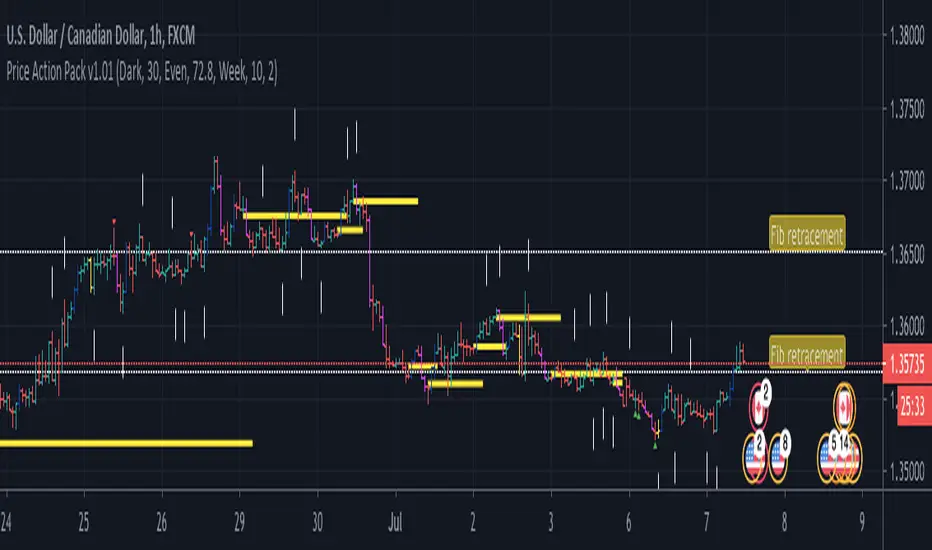
Price Action Pack v1.00With the Price Action Pack you can read buying and selling activity, view strong pivot highs / lows, see GAP pattern or StarGap formation. Next you can use fibonacci retracement with even and odd setting, fibo extensions, timeframe could be changed to daily, weekly, monthly or more. You can have for example monthly Initial ballance (fibo extensions) within for example 30 minutes chart. The indicator has more features like VWAP POC on every bar, volume based reversal signal devivated from volume change and candle patterns which often start new trend. If you find area with more then one level on your chart it is likely very strong zone to watch for rebounce or breakout.
send PM or visit website to get access
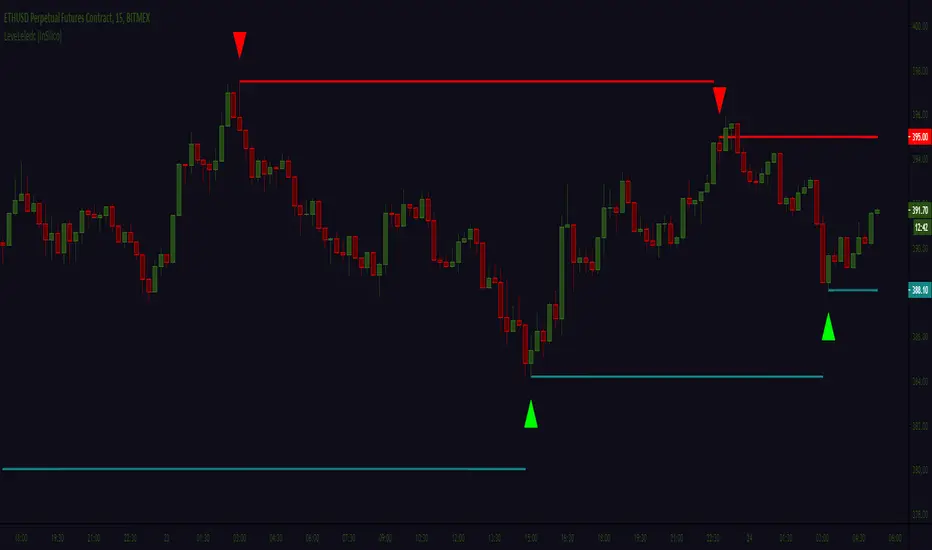
Leledc levels (IS) LeveLeledc - Exhaustion levels (InSilico)
Method for zero confirmation support/resistance level detection using Leledc Exhaustion Bars
Study is extension/mod of glaz script ,its implementing simple but unorthodox use-case for "Leledc Exhaustion Bars"
More information on core function in source scripts page ->
P.s Written quickly and spontaneously
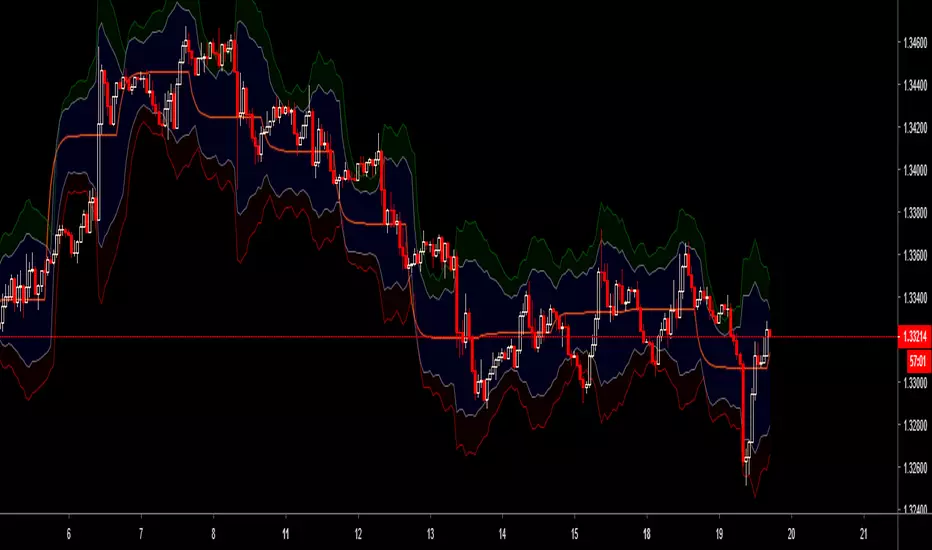
Baseline-C [ID: AC-P]The "AC-P" version of jiehonglim's NNFX Baseline script is my personal customized version of the NNFX Baseline concept as part of the NNFX Algorithm stack/structure for 1D Trend Trading for Forex. Everget's JMA implementation is used for the baseline smoothing method, with optional ATR bands at 1.0x and 1.5x from the baseline.
NNFX = No Nonsense Forex
Baseline = Component of the NNFX Algorithm that consists of a single moving average
Baseline ---> Meant to be used in conjunction with ATR/C1/C2/Vol Indicator/Exit Indicator as per NNFX Algorithm setup/structure. C1 is 1st Confirmation Indicator, C2 is 2nd Confirmation Indicator.
JMA (Jurik Moving Average) is used for the baseline and slow baseline.
A slow baseline option is included, but disabled by default.
The faint orange/purple lines are 1.0x/1.5x ATR from the Baseline, and are what I use as potential TP/SL targets or to evaluate when to stay out of a trade (chop/missed entry/exit/other/ATR breach), depending on the trade setup (in conjunction with C1/C2/Vol Indicator/Exit Indicator)
This script is heavily based upon jiehonglim's NNFX Baseline script for signaling, barcoloring, and ATR.
SSL Channel option included but disabled by default (Erwinbeckers SSL component)
POC (Point of Control) from Volume Profile is included/enabled by default for both the current timeframe and 12HR timeframe
03.freeman's InfoPanel Divergence Indicator was used a reference to replace the current/previous ATR information infopanel/info draw from jiehonglim's script. I'm not sure whether I like the previous way ATR info was displayed vs how I have it currently, but it's something that is completely optional:
Specifically: I am tuning this baseline/indicator for 1D trading as part of the NNFX system, for Forex.
DO NOT USE THIS INDICATOR WITHOUT PROPER TUNING/ADJUSTMENT for your timeframe and asset class.
Note about lack of alerts:
Alerts for baseline crosses (and other crosses) have been purposefully omitted for this version upon initial publication. While getting alerts for baseline crosses under certain conditions/filtered conditions that eliminate low-importance signals and crossover whipsaw would be great, it's something I'm still looking into.
SPECIFICALLY: There are entry, exit, take profit, and continuation signal components in relation to the Baseline to the rest of the NNFX Algorithm stack (ATR/C1/C2/Vol Indicator/Exit Indicator), including but limited to the "1 candle rule" and the "7 candle rule" as per NNFX.
Implementing alerts that are significant that also factor in these rules while reducing alert spam/false signals would be ideal, but it's also the HTF/Daily chart - visually, entry/exit/continuation signal alignment is easy to spot when trading 1D - alerts may be redundant/a pursuit in diminishing returns (for now).
//-------------------------------------------------------------------
// Acknowledgements/Reference:
// jiehonglim, NNFX Baseline Script - Moving Averages
//
// Fractured, Many Moving Averages
//
// everget, Jurik Moving Average/JMA
//
// 03.freeman, InfoPanel Divergence Indicator
//
// Ggqmna Volume stops
//
// Libertus RSI Divs
//
// ChrisMoody, CM_Price-Action-Bars-Price Patterns That Work
//
// Erwinbeckers SSL Channel
//

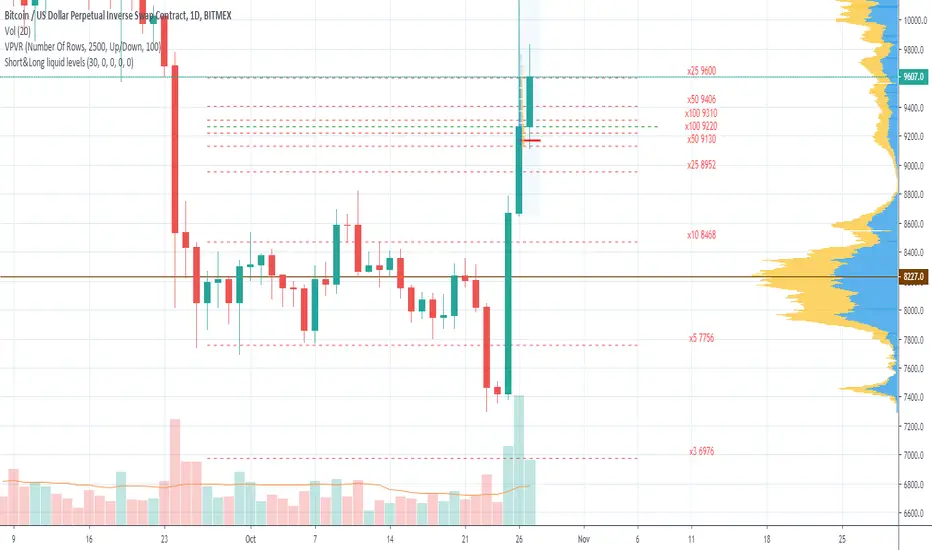
Short&Long liquid levels (XBT & ETH)Shows liquidation levels of marginal LONG and SHORT positions on BITMEX for XBTUSD and ETHUSD pairs.
Levels are calculated from the basis price, which you can change manually. The best choice is using the Volume Profile indicator in conjunction, so you can take POC for the basis price. As well, you can use significant horizontal levels or a middle line of a price channel. In order to prevent chart collapse, last candle open price is used by default.
Indicator presents x100, x50, x25, x10, x5, x3, x2 levels for XBTUSD and x50, x35, x25, x20, x10, x5, x3 for ETHUSD. Each level is marked with labels by default, and you can turn the labels off in the styles menu.
The indicator is only visible on XBTUSD, BTCUSD, BTCUSDT, ETHUSD, ETHUSDT pairs.
You can turn on/off Short or Long liquidation levels.
The basis price is the same for Longs and shorts by default, specify separate price for short if you need.
If you have any advice to improve the indicator or if you find any mistake, please leave your feedback.
RSI+A free addon for Profitable RSI . Equipped with RSI Values Distribution Profile, Point of Control, Value Area (customizable % based) and alert system.

MULTITIMEFRAME_VWAP_MANOJVWAP is a powerful concept.
It denotes the fair price that is traded in the market.
In other words, it represents a variance of POINT OF CONTROL (POC) which is a Market Profile / Volume Profile Concept.
It is a leading indicator as it is dependent on the price and volume .
Usually VWAP is used for intraday trades and Trading view as an in built indicator which works only for intraday.
This script plots daily vwap , monthly vwap , quarterly vwap and yearly vwap .
The suggested combination is :
intraday charts - daily vwap
daily charts - monthly and / or quarterly vwap
weekly charts - quarterly and / or yearly vwap

Flunki Spelgubbs Pivot Palava Custom POC pivots with broad transgression detection ; non-standard tweak-able parameters for fine tuning - keeping private for now as the calls are good but could be better with some trend based options - catch me on Onex discord discord.gg - come chill trade and learn.
