Simple AverageSimple average, with builtin plot of a true Weekly, Monthly, Quarterly and Yearly average
(A variation on Pivots, with only the P line (HLC/3))
스크립트에서 "pivot"에 대해 찾기

Orderblock Footprints [AlgoAlpha]🟠 OVERVIEW
This script highlights orderblocks and then drills into what actually trades inside them. Zones are created only after an abnormal directional impulse, measured with a z-score on consecutive candle bodies, so the orderblocks are tied to real expansion rather than simple pivots. Once a zone exists, the script overlays lower-timeframe volume footprints inside the candle when price trades back into that zone. The goal is to show not just where an orderblock sits, but whether price is being accepted or absorbed when it is revisited.
🟠 CONCEPTS
Orderblocks are detected after extreme bullish or bearish impulses. The script tracks consecutive body movement up or down, normalizes that distance with a rolling z-score, and only triggers when the move is statistically large. The last opposite candle before that impulse defines the orderblock range. These zones then extend forward until they are either mitigated by price closing through them or they expire by age.
Inside an active zone, the script switches to a lower timeframe and builds a footprint-style profile for each bar. Each candle is split into price rows, counting time-at-price and volume delta. Positive and negative delta are colored separately. Absorption is flagged when opposing delta prints appear in the wick that rejects the zone. In practice: the impulse defines context ; the footprint shows interaction .
🟠 FEATURES
Separate bullish and bearish zones with automatic extension
Volume split inside each zone candle (up vs down volume)
Lower-timeframe footprint with TPO-style rows and delta gradient
Absorption detection using opposing delta in rejection wicks
Alerts for zone creation and absorption events
🟠 USAGE
Setup : Add the script to your chart. It works on any market and timeframe. The lower timeframe for footprints is fixed at 5 minutes, so higher chart timeframes show clearer structure. Use the Z-Score Window to control how strict impulse detection is and Max Box Age to limit how long old zones stay on the chart.
Read the chart : Bullish orderblocks are created after strong upward impulses and are invalidated when price closes below them. Bearish orderblocks are created after strong downward impulses and are invalidated when price closes above them. When price trades inside a zone, footprint rows appear. Green-tinted rows show positive delta; red-tinted rows show negative delta. Absorption labels appear when opposing delta prints into a rejecting wick.
Settings that matter : Increasing the Z-Score Window makes orderblocks rarer but more significant. Disabling Prevent Overlap allows stacked zones if you want to study clustering. Adjusting Rows per bar changes footprint resolution—lower values are cleaner, higher values show more detail but use more objects.

ULTIMATE ORDER FLOW SYSTEM🔥 ULTIMATE ORDER FLOW SYSTEM
Overview
This comprehensive order flow analysis tool combines **Volume Profile**, **Cumulative Delta**, and **Large Order Detection** to identify high-probability trading setups. The script analyzes institutional order flow patterns and volume distribution to pinpoint key levels where price is likely to react.
📊 Core Components & Methodology
🔥 ULTIMATE ORDER FLOW SYSTEM
Overview
This comprehensive order flow analysis tool combines Volume Profile, Cumulative Delta, and Large Order Detection to identify high-probability trading setups. The script analyzes institutional order flow patterns and volume distribution to pinpoint key levels where price is likely to react.
________________________________________
📊 Core Components & Methodology
1. Volume Profile Analysis
The script constructs a horizontal volume profile by:
• Dividing the price range into configurable rows (default: 20)
• Accumulating volume at each price level over a lookback period (default: 50 bars)
• Separating buy volume (green bars close > open) from sell volume (red bars)
• Identifying three critical levels:
o POC (Point of Control): Price level with highest traded volume - acts as a strong magnet
o VAH/VAL (Value Area High/Low): Contains 70% of total volume - defines fair value zone
o HVN (High Volume Nodes): Resistance zones where institutions accumulated positions
o LVN (Low Volume Nodes): Thin zones that price moves through quickly - ideal targets
Why This Matters: Institutional traders leave footprints through volume. HVN zones show where large players defended levels, making them reliable support/resistance.
________________________________________
2. Cumulative Delta (Order Flow)
Tracks the running total of buying vs selling pressure:
• Bar Delta: Difference between buy and sell volume per candle
• Cumulative Delta: Sum of all bar deltas - shows net directional pressure
• Delta Moving Average: Smoothed delta (20-period) to identify trend
• Delta Divergences:
o Bullish: Price makes lower low, but delta makes higher low (absorption at bottom)
o Bearish: Price makes higher high, but delta makes lower high (exhaustion at top)
How It Works: When cumulative delta trends up while price consolidates, it signals accumulation. Delta divergences reveal when smart money is positioned opposite to retail expectations.
________________________________________
3. Large Order Detection
Identifies institutional-sized orders in real-time:
• Compares current bar volume to 20-period moving average
• Flags orders exceeding 2.5x average volume (configurable multiplier)
• Distinguishes bullish (green circles below) vs bearish (red circles above) large orders
Rationale: Sudden volume spikes at key levels indicate institutional participation - the "fuel" needed for breakouts or reversals.
________________________________________
🎯 Trading Signal Logic
Combined Setup Criteria
The script generates SHORT and LONG signals when multiple conditions align:
SHORT Signal Requirements:
1. Price reaches an HVN resistance zone (within 0.2%)
2. Large sell order detected (volume spike + red candle)
3. Cumulative delta is bearish OR bearish divergence present
4. 10-bar cooldown between signals (prevents overtrading)
LONG Signal Requirements:
1. Price reaches an HVN support zone
2. Large buy order detected (volume spike + green candle)
3. Cumulative delta is bullish OR bullish divergence present
4. 10-bar cooldown enforced
________________________________________
🔧 Customization Options
Setting - Purpose - Recommendation
Volume Profile Rows - Granularity of level detection - 20 (balanced)
Lookback Period - Historical data analyzed - 50 bars (intraday), 200 (swing)
Large Order Multiplier - Sensitivity to volume spikes - 2.5x (standard), 3.5x (conservative)
HVN Threshold - Resistance zone detection - 1.3 (default)
LVN Threshold - Target zone identification - 0.6 (default)
Divergence Lookback - Pivot detection period - 5 bars (responsive)
________________________________________
📈 Dashboard Indicators
The real-time panel displays:
• POC: Current Point of Control price
• Location: Whether price is at HVN resistance
• Orders: Current large buy/sell activity
• Cumulative Δ: Net order flow value + trend direction
• Divergence: Active bullish/bearish divergences
• Bar Strength: % of candle volume that's directional (>65% = strong)
• SETUP: Current trade signal (LONG/SHORT/WAIT)
________________________________________
🎨 Visual System
• Yellow POC Line: Highest volume level - primary pivot
• Blue Value Area Box: Fair value zone (VAH to VAL)
• Red HVN Zones: Resistance/support from institutional accumulation
• Green LVN Zones: Low-liquidity targets for quick moves
• Volume Bars: Green (buy pressure) vs Red (sell pressure) distribution
• Triangles: LONG (green up) and SHORT (red down) entry signals
• Diamonds: Divergence warnings (cyan=bullish, fuchsia=bearish)
________________________________________
💡 How This Script Is Unique
Unlike standalone volume profile or delta indicators, this script:
1. Synthesizes three complementary methods - volume structure, order flow momentum, and liquidity detection
2. Requires multi-factor confirmation - signals only trigger when price, volume, and delta align at key zones
3. Adapts to market regime - delta filters ensure you're trading with the dominant order flow direction
4. Provides context, not just signals - the dashboard helps you understand why a setup is forming
________________________________________
⚙️ Best Practices
Timeframes:
• 5-15 min: Scalping (use 30-50 bar lookback)
• 1-4 hour: Swing trading (use 100-200 bar lookback)
Risk Management:
• Enter on signal candle close
• Stop loss: Beyond nearest HVN/LVN zone
• Target 1: Next LVN level
• Target 2: Opposite value area boundary
Filters:
• Avoid signals during major news events
• Require bar delta strength >65% for aggressive entries
• Wait for delta MA cross confirmation in ranging markets
________________________________________
🚨 Alerts Available
• Long Setup Trigger
• Short Setup Trigger
• Bullish/Bearish Divergence Detection
• Large Buy/Sell Order Execution
________________________________________
📚 Educational Context
This methodology is based on principles used by professional order flow traders:
• Market Profile Theory: Volume distribution reveals fair value
• Tape Reading: Large orders show institutional intent
• Auction Theory: Price seeks areas of liquidity imbalance (LVN zones)
The script automates pattern recognition that discretionary traders spend years learning to identify manually.
________________________________________
⚠️ Disclaimer
This indicator is a trading tool, not a trading system. It identifies high-probability setups based on order flow analysis but requires proper risk management, market context, and trader discretion. Past performance does not guarantee future results.
________________________________________
Version: 6 (Pine Script)
Type: Overlay + Separate Pane (Delta Panel)
Resource Usage: Moderate (500 bars history, 500 lines/boxes)
________________________________________
For questions or support, please comment below. If you find this script valuable, please boost and favorite! 🚀
1. Volume Profile Analysis
The script constructs a horizontal volume profile by:
- Dividing the price range into configurable rows (default: 20)
- Accumulating volume at each price level over a lookback period (default: 50 bars)
- Separating buy volume (green bars close > open) from sell volume (red bars)
- Identifying three critical levels:
- POC (Point of Control): Price level with highest traded volume - acts as a strong magnet
- VAH/VAL (Value Area High/Low): Contains 70% of total volume - defines fair value zone
- HVN (High Volume Nodes): Resistance zones where institutions accumulated positions
- LVN (Low Volume Nodes): Thin zones that price moves through quickly - ideal targets
Why This Matters: Institutional traders leave footprints through volume. HVN zones show where large players defended levels, making them reliable support/resistance.
---
2. Cumulative Delta (Order Flow)
Tracks the running total of buying vs selling pressure:
- **Bar Delta**: Difference between buy and sell volume per candle
- **Cumulative Delta**: Sum of all bar deltas - shows net directional pressure
- **Delta Moving Average**: Smoothed delta (20-period) to identify trend
- **Delta Divergences**:
- **Bullish**: Price makes lower low, but delta makes higher low (absorption at bottom)
- **Bearish**: Price makes higher high, but delta makes lower high (exhaustion at top)
**How It Works**: When cumulative delta trends up while price consolidates, it signals accumulation. Delta divergences reveal when smart money is positioned opposite to retail expectations.
---
### 3. **Large Order Detection**
Identifies **institutional-sized orders** in real-time:
- Compares current bar volume to 20-period moving average
- Flags orders exceeding 2.5x average volume (configurable multiplier)
- Distinguishes bullish (green circles below) vs bearish (red circles above) large orders
**Rationale**: Sudden volume spikes at key levels indicate institutional participation - the "fuel" needed for breakouts or reversals.
---
## 🎯 Trading Signal Logic
### Combined Setup Criteria
The script generates **SHORT** and **LONG** signals when multiple conditions align:
**SHORT Signal Requirements:**
1. Price reaches an HVN resistance zone (within 0.2%)
2. Large sell order detected (volume spike + red candle)
3. Cumulative delta is bearish OR bearish divergence present
4. 10-bar cooldown between signals (prevents overtrading)
**LONG Signal Requirements:**
1. Price reaches an HVN support zone
2. Large buy order detected (volume spike + green candle)
3. Cumulative delta is bullish OR bullish divergence present
4. 10-bar cooldown enforced
---
## 🔧 Customization Options
| Setting | Purpose | Recommendation |
|---------|---------|----------------|
| **Volume Profile Rows** | Granularity of level detection | 20 (balanced) |
| **Lookback Period** | Historical data analyzed | 50 bars (intraday), 200 (swing) |
| **Large Order Multiplier** | Sensitivity to volume spikes | 2.5x (standard), 3.5x (conservative) |
| **HVN Threshold** | Resistance zone detection | 1.3 (default) |
| **LVN Threshold** | Target zone identification | 0.6 (default) |
| **Divergence Lookback** | Pivot detection period | 5 bars (responsive) |
---
## 📈 Dashboard Indicators
The real-time panel displays:
- **POC**: Current Point of Control price
- **Location**: Whether price is at HVN resistance
- **Orders**: Current large buy/sell activity
- **Cumulative Δ**: Net order flow value + trend direction
- **Divergence**: Active bullish/bearish divergences
- **Bar Strength**: % of candle volume that's directional (>65% = strong)
- **SETUP**: Current trade signal (LONG/SHORT/WAIT)
---
## 🎨 Visual System
- **Yellow POC Line**: Highest volume level - primary pivot
- **Blue Value Area Box**: Fair value zone (VAH to VAL)
- **Red HVN Zones**: Resistance/support from institutional accumulation
- **Green LVN Zones**: Low-liquidity targets for quick moves
- **Volume Bars**: Green (buy pressure) vs Red (sell pressure) distribution
- **Triangles**: LONG (green up) and SHORT (red down) entry signals
- **Diamonds**: Divergence warnings (cyan=bullish, fuchsia=bearish)
---
## 💡 How This Script Is Unique
Unlike standalone volume profile or delta indicators, this script:
1. **Synthesizes three complementary methods** - volume structure, order flow momentum, and liquidity detection
2. **Requires multi-factor confirmation** - signals only trigger when price, volume, and delta align at key zones
3. **Adapts to market regime** - delta filters ensure you're trading with the dominant order flow direction
4. **Provides context, not just signals** - the dashboard helps you understand *why* a setup is forming
---
## ⚙️ Best Practices
**Timeframes:**
- 5-15 min: Scalping (use 30-50 bar lookback)
- 1-4 hour: Swing trading (use 100-200 bar lookback)
**Risk Management:**
- Enter on signal candle close
- Stop loss: Beyond nearest HVN/LVN zone
- Target 1: Next LVN level
- Target 2: Opposite value area boundary
**Filters:**
- Avoid signals during major news events
- Require bar delta strength >65% for aggressive entries
- Wait for delta MA cross confirmation in ranging markets
---
## 🚨 Alerts Available
- Long Setup Trigger
- Short Setup Trigger
- Bullish/Bearish Divergence Detection
- Large Buy/Sell Order Execution
---
## 📚 Educational Context
This methodology is based on principles used by professional order flow traders:
- **Market Profile Theory**: Volume distribution reveals fair value
- **Tape Reading**: Large orders show institutional intent
- **Auction Theory**: Price seeks areas of liquidity imbalance (LVN zones)
The script automates pattern recognition that discretionary traders spend years learning to identify manually.
---
## ⚠️ Disclaimer
This indicator is a **trading tool, not a trading system**. It identifies high-probability setups based on order flow analysis but requires proper risk management, market context, and trader discretion. Past performance does not guarantee future results.
---
**Version**: 6 (Pine Script)
**Type**: Overlay + Separate Pane (Delta Panel)
**Resource Usage**: Moderate (500 bars history, 500 lines/boxes)
---
*For questions or support, please comment below. If you find this script valuable, please boost and favorite!* 🚀

Choch Pattern Levels [BigBeluga]🔵 OVERVIEW
The Choch Pattern Levels indicator automatically detects Change of Character (CHoCH) shifts in market structure — crucial moments that often signal early trend reversals or major directional transitions. It plots the structural break level, visualizes the pattern zone with triangle overlays, and tracks delta volume to help traders assess the strength behind each move.
🔵 CONCEPTS
CHoCH Pattern: A bullish CHoCH forms when price breaks a previous swing high after a swing low, while a bearish CHoCH appears when price breaks a swing low after a prior swing high.
Break Level Mapping: The indicator identifies the highest or lowest point between the pivot and the breakout, marking it with a clean horizontal level where price often reacts.
Delta Volume Tracking: Net bullish or bearish volume is accumulated between the pivot and the breakout, revealing the momentum and conviction behind each CHoCH.
Chart Clean-Up: If price later closes through the CHoCH level, the zone is automatically removed to maintain clarity and focus on active setups only.
🔵 FEATURES
Automatic CHoCH pattern detection using pivot-based logic.
Triangle shapes show structure break: pivot → breakout → internal high/low.
Horizontal level marks the structural zone with a ◯ symbol.
Optional delta volume label with directional sign (+/−).
Green visuals for bullish CHoCHs, red for bearish.
Fully auto-cleaning invalidated levels to reduce clutter.
Clean organization of all lines, labels, and overlays.
User-defined Length input to adjust pivot sensitivity.
🔵 HOW TO USE
Use CHoCH levels as early trend reversal zones or confirmation signals.
Treat bullish CHoCHs as support zones, bearish CHoCHs as resistance.
Look for high delta volume to validate the strength behind each CHoCH.
Combine with other BigBeluga tools like supply/demand, FVGs, or liquidity maps for confluence.
Adjust pivot Length based on your strategy — shorter for intraday, longer for swing trading.
🔵 CONCLUSION
Choch Pattern Levels highlights key structural breaks that can mark the start of new trends. By combining precise break detection with volume analytics and automatic cleanup, it provides actionable insights into the true intent behind price moves — giving traders a clean edge in spotting early reversals and key reaction zones.

Reversal Point Dynamics⇋ Reversal Point Dynamics (RPD)
This is not an indicator; it is a complete system for deconstructing the mechanics of a market reversal. Reversal Point Dynamics (RPD) moves far beyond simplistic pattern recognition, venturing into a deep analysis of the underlying forces that cause trends to exhaust, pause, and turn. It is engineered from the ground up to identify high-probability reversal points by quantifying the confluence of market dynamics in real-time.
Where other tools provide a static signal, RPD delivers a dynamic probability. It understands that a true market turning point is not a single event, but a cascade of failing momentum, structural breakdown, and a shift in market order. RPD's core engine meticulously analyzes each of these dynamic components—the market's underlying state, its velocity and acceleration, its degree of chaos (entropy), and its structural framework. These forces are synthesized into a single, unified Probability Score, offering you an unprecedented, transparent view into the conviction behind every potential reversal.
This is not a "black box" system. It is an open-architecture engine designed to empower the discerning trader. Featuring real-time signal projection, an integrated Fibonacci R2R Target Engine, and a comprehensive dashboard that acts as your Dynamics Control Center , RPD gives you a complete, holistic view of the market's state.
The Theoretical Core: Deconstructing Market Dynamics
RPD's analytical power is born from the intelligent synthesis of multiple, distinct theoretical models. Each pillar of the engine analyzes a different facet of market behavior. The convergence of these analyses—the "Singularity" event referenced in the dashboard—is what generates the final, high-conviction probability score.
1. Pillar One: Quantum State Analysis (QSA)
This is the foundational analysis of the market's current state within its recent context. Instead of treating price as a random walk, QSA quantizes it into a finite number of discrete "states."
Formulaic Concept: The engine establishes a price range using the highest high and lowest low over the Adaptive Analysis Period. This range is then divided into a user-defined number of Analysis Levels. The current price is mapped to one of these states (e.g., in a 9-level system, State 0 is the absolute low, and State 8 is the absolute high).
Analytical Edge: This acts as a powerful foundational filter. The engine will only begin searching for reversal signals when the market has reached a statistically stretched, extreme state (e.g., State 0 or 8). The Edge Sensitivity input allows you to control exactly how close to this extreme edge the price must be, ensuring you are trading from points of maximum potential exhaustion.
2. Pillar Two: Price State Roc (PSR) - The Dynamics of Momentum
This pillar analyzes the kinetic forces of the market: its velocity and acceleration. It understands that it’s not just where the price is, but how it got there that matters.
Formulaic Concept: The psr function calculates two derivatives of price.
Velocity: (price - price ). This measures the speed and direction of the current move.
Acceleration: (velocity - velocity ). This measures the rate of change in that speed. A negative acceleration (deceleration) during a strong rally is a critical pre-reversal warning, indicating momentum is fading even as price may be pushing higher.
Analytical Edge: The engine specifically hunts for exhaustion patterns where momentum is clearly decelerating as price reaches an extreme state. This is the mechanical signature of a weakening trend.
3. Pillar Three: Market Entropy Analysis - The Dynamics of Order & Chaos
This is RPD's chaos filter, a concept borrowed from information theory. Entropy measures the degree of randomness or disorder in the market's price action.
Formulaic Concept: The calculateEntropy function analyzes recent price changes. A market moving directionally and smoothly has low entropy (high order). A market chopping back and forth without direction has high entropy (high chaos). The value is normalized between 0 and 1.
Analytical Edge: The most reliable trades occur in low-entropy, ordered environments. RPD uses the Entropy Threshold to disqualify signals that attempt to form in chaotic, unpredictable conditions, providing a powerful shield against whipsaw markets.
4. Pillar Four: The Synthesis Engine & Probability Calculation
This is where all the dynamic forces converge. The final probability score is a weighted calculation that heavily rewards confluence.
Formulaic Concept: The calculateProbability function intelligently assembles the final score:
A Base Score is established from trend strength and entropy.
An Entropy Score adds points for low entropy (order) and subtracts for high entropy (chaos).
A significant Divergence Bonus is awarded for a classic momentum divergence.
RSI & Volume Bonuses are added if momentum oscillators are in extreme territory or a volume spike confirms institutional interest.
MTF & Adaptive Bonuses add further weight for alignment with higher timeframe structure.
Analytical Edge: A signal backed by multiple dynamic forces (e.g., extreme state + decelerating momentum + low entropy + volume spike) will receive an exponentially higher probability score. This is the very essence of analyzing reversal point dynamics.
The Command Center: Mastering the Inputs
Every input is a precise lever of control, allowing you to fine-tune the RPD engine to your exact trading style, market, and timeframe.
🧠 Core Algorithm
Predictive Mode (Early Detection):
What It Is: Enables the engine to search for potential reversals on the current, unclosed bar.
How It Works: Analyzes intra-bar acceleration and state to identify developing exhaustion. These signals are marked with a ' ? ' and are tentative.
How To Use It: Enable for scalping or very aggressive day trading to get the earliest possible indication. Disable for swing trading or a more conservative approach that waits for full bar confirmation.
Live Signal Mode (Current Bar):
What It Is: A highly aggressive mode that plots tentative signals with a ' ! ' on the live bar based on projected price and momentum. These signals repaint intra-bar.
How It Works: Uses a linear regression projection of the close to anticipate a reversal.
How To Use It: For advanced users who use intra-bar dynamics for execution and understand the nature of repainting signals.
Adaptive Analysis Period:
What It Is: The main lookback period for the QSA, PSR, and Entropy calculations. This is the engine's "memory."
How It Works: A shorter period makes the engine highly sensitive to local price swings. A longer period makes it focus only on major, significant market structure.
How To Use It: Scalping (1-5m): 15-25. Day Trading (15m-1H): 25-40. Swing Trading (4H+): 40-60.
Fractal Strength (Bars):
What It Is: Defines the strength of the pivot detection used for confirming reversal events.
How It Works: A value of '2' requires a candle's high/low to be more extreme than the two bars to its left and right.
How To Use It: '2' is a robust standard. Increase to '3' for an even stricter definition of a structural pivot, which will result in fewer signals.
MTF Multiplier:
What It Is: Integrates pivot data from a higher timeframe for confluence.
How It Works: A multiplier of '4' on a 15-minute chart will pull pivot data from the 1-hour chart (15 * 4 = 60m).
How To Use It: Set to a multiple that corresponds to your preferred higher timeframe for contextual analysis.
🎯 Signal Settings
Min Probability %:
What It Is: Your master quality filter. A signal is only plotted if its score exceeds this threshold.
How It Works: Directly filters the output of the final probability calculation.
How To Use It: High-Quality (80-95): For A+ setups only. Balanced (65-75): For day trading. Aggressive (50-60): For scalping.
Min Signal Distance (Bars):
What It Is: A noise filter that prevents signals from clustering in choppy conditions.
How It Works: Enforces a "cooldown" period of N bars after a signal.
How To Use It: Increase in ranging markets to focus on major swings. Decrease on lower timeframes.
Entropy Threshold:
What It Is: Your "chaos shield." Sets the maximum allowable market randomness for a signal.
How It Works: If calculated entropy is above this value, the signal is invalidated.
How To Use It: Lower values (0.1-0.5): Extremely strict. Higher values (0.7-1.0): More lenient. 0.85 is a good balance.
Adaptive Entropy & Aggressive Mode:
What It Is: Toggles for dynamically adjusting the engine's core parameters.
How It Works: Adaptive Entropy can slightly lower the required probability in strong trends. Aggressive Mode uses more lenient settings across the board.
How To Use It: Keep Adaptive on. Use Aggressive Mode sparingly, primarily for scalping highly volatile assets.
📊 State Analysis
Analysis Levels:
What It Is: The number of discrete "states" for the QSA.
How It Works: More levels create a finer-grained analysis of price location.
How To Use It: 6-7 levels are ideal. Increasing to 9 can provide more precision on very volatile assets.
Edge Sensitivity:
What It Is: Defines how close to the absolute top/bottom of the range price must be.
How It Works: '0' means price must be in the absolute highest/lowest state. '3' allows a signal within the top/bottom 3 states.
How To Use It: '3' provides a good balance. Lower it to '1' or '0' if you only want to trade extreme exhaustion.
The Dashboard: Your Dynamics Control Center
The dashboard provides a transparent, real-time view into the engine's brain. Use it to understand the context behind every signal and to gauge the current market environment at a glance.
🎯 UNIFIED PROB SCORE
TOTAL SCORE: The highest probability score (either Peak or Valley) the engine is currently calculating. This is your main at-a-glance conviction metric. The "Singularity" header refers to the event where market dynamics align—the event RPD is built to detect.
Quality: A human-readable interpretation of the Total Score. "EXCEPTIONAL" (🌟) is a rare, A+ confluence event. "STRONG" (💪) is a high-quality, tradable setup.
📊 ORDER FLOW & COMPONENT ANALYSIS
Volume Spike: Shows if the current volume is significantly higher than average (YES/NO). A 'YES' adds major confirmation.
Peak/Valley Conf: This breaks down the probability score into its directional components, showing you the separate confidence levels for a potential top (Peak) versus a bottom (Valley).
🌌 MARKET STRUCTURE
HTF Trend: Shows the direction of the underlying trend based on a Supertrend calculation.
Entropy: The current market chaos reading. "🔥 LOW" is an ideal, ordered state for trading. "😴 HIGH" is a warning of choppy, unpredictable conditions.
🔮 FIB & R2R ZONE (Large Dashboard)
This section gives you the status of the Fibonacci Target Engine. It shows if an Active Channel (entry zone) or Stop Zone (invalidation zone) is active and displays the precise price levels for the static entry, target, and stop calculated at the time of the signal.
🛡️ FILTERS & PREDICTIVES (Large Dashboard)
This panel provides a status check on all the bonus filters. It shows the current RSI Status, whether a Divergence is present, and if a Live Pending signal is forming.
The Visual Interface: A Symphony of Data
Every visual element is designed for instant, intuitive interpretation of market dynamics.
Signal Markers: These are the primary outputs of the engine.
▼/▲ b: A fully confirmed signal that has passed all filters.
? b: A tentative signal generated in Predictive Mode, indicating developing dynamics.
◈ b: This diamond icon replaces the standard triangle when the signal is confirmed by a strong momentum divergence, highlighting it as a superior setup where dynamics are misaligned with price.
Harmonic Wave: The flowing, colored wave around the price.
What It Represents: The market's "flow dynamic" and volatility.
How to Interpret It: Expanding waves show increasing volatility. The color is tied to the "Quantum Color" in your theme, representing the underlying energy field of the market.
Entropy Particles: The small dots appearing above/below price.
What They Represent: A direct visualization of the "order dynamic."
How to Interpret Them: Their presence signifies a low-entropy, ordered state ideal for trading. Their color indicates the direction of momentum (PSR velocity). Their absence means the market is too chaotic (high entropy).
The Fibonacci Target Engine: The dynamic R2R system appearing post-signal.
Static Fib Levels: Colored horizontal lines representing the market's "structural dynamic."
The Green "Active Channel" Box: Your zone of consideration. An area to manage a potential entry.
Development Philosophy
Reversal Point Dynamics was engineered to answer a fundamental question: can we objectively measure the forces behind a market turn? It is a synthesis of concepts from market microstructure, statistics, and information theory. The objective was never to create a "perfect" system, but to build a robust decision-support tool that provides a measurable, statistical edge by focusing on the principle of confluence.
By demanding that multiple, independent market dynamics align simultaneously, RPD filters out the vast majority of market noise. It is designed for the trader who thinks in terms of probability and risk management, not in terms of certainties. It is a tool to help you discount the obvious and bet on the unexpected alignment of market forces.
"Markets are constantly in a state of uncertainty and flux and money is made by discounting the obvious and betting on the unexpected."
— George Soros
Trade with insight. Trade with anticipation.
— Dskyz, for DAFE Trading Systems

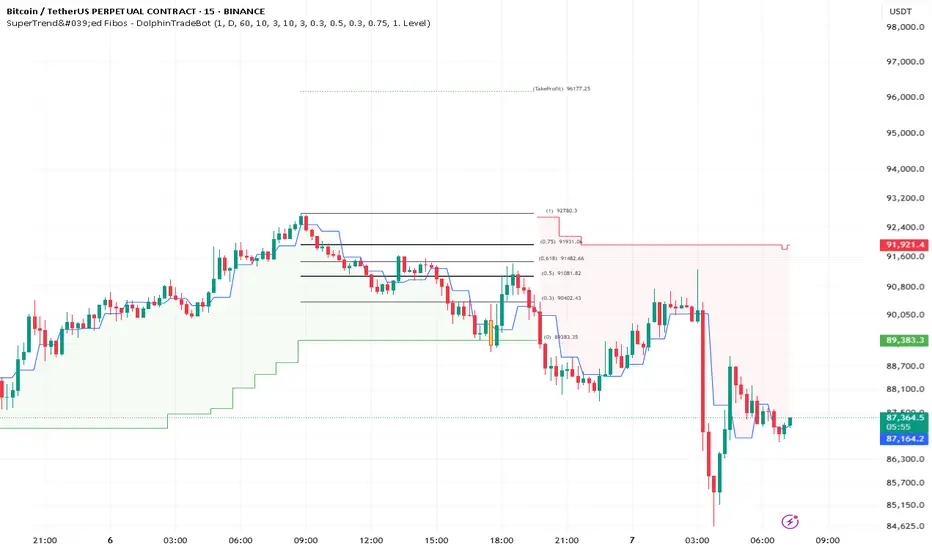
SuperTrend'ed Fibos - DolphinTradeBot
Overwiev
This indicator aims to assist in taking trades at relatively low price levels in the direction of the main trend and capturing profits at potential reversal points.
What is it for !
The indicator simply performs its calculations by using two multitimeframe SuperTrend indicators, Fibonacci levels, and pivot points. The reason for using MTF in both SuperTrend indicators is that the lengths of the levels are relatively limited, so it allows for a more detailed analysis on lower timeframes.
How is it work
When both the HTF SuperTrend and the main SuperTrend indicators are in the same direction,
For Uptrend:
Once the main SuperTrend line is violated it barcolor and draws the basic Fibonacci levels between the pivot high point and the SuperTrend line within the trend region . The TakeProfit level is drawn at a distance multiplied by the TakeProfit Multiplier, between the lowest and highest points of the level. When the main trend reverses or the TakeProfit level is violated, it stops drawing.
For Downtrend:
Once the main SuperTrend line is violated it barcolor and draws the basic Fibonacci levels between the pivot low point and the SuperTrend line within the trend region . The TakeProfit level is drawn at a distance multiplied by the TakeProfit Multiplier, between the lowest and highest points of the level. When the main trend reverses or the TakeProfit level is violated, it stops drawing.
How to Use:
To prevent the line thickness from being displayed on the screen, the indicator shows the direction of the HTF SuperTrend indicator by coloring the background. In the settings section, you can adjust:
TakeProfit Multiplier
Fibonacci line colors
HTF SuperTrend activation
HTF SuperTrend settings
Main SuperTrend settings
Fibonacci levels
Custom alert activation
Custom alert level
Alarm Section
By default, the indicator gives an alert when a level is formed or violated. Additionally, if you want to set an alert for a specific level, you can activate the Custom Alert option and choose your desired level.
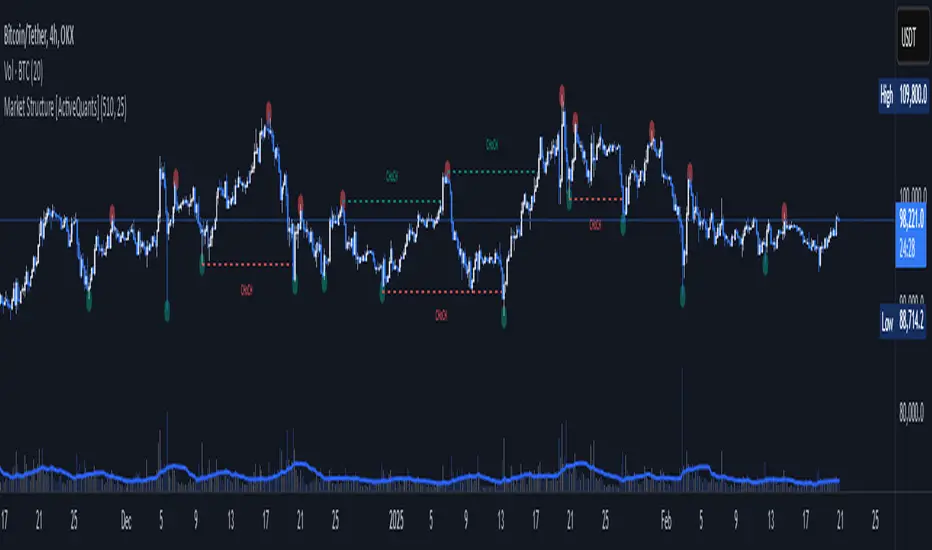
Market Structure [ActiveQuants]The Market Structure indicator is a powerful tool designed to help traders identify key market structure shifts and change of character (CHoCH) points. By plotting swing highs, swing lows, and structural breaks , this indicator allows traders to track price action dynamics, improving trade execution and strategy development.
█ KEY FEATURES
Market Structure Visualization : Automatically detects and plots pivot highs and pivot lows , highlighting structural points on the chart.
Change of Character (CHoCH) Detection : Identifies bullish and bearish CHoCH events, marking key shifts in market sentiment.
Customizable Sensitivity : Adjust the pivot sensitivity to fine-tune market structure identification based on different trading styles and timeframes.
Dynamic Labeling & Line Management : Automatically removes old lines and labels to keep the chart clean and focused on recent price action.
User-Defined Display Options : Customize the colors, visibility, and number of bars shown to match your personal trading preferences.
█ CONCLUSION
The Market Structure & CHoCH Indicator is an essential tool for traders who rely on price action and structure-based strategies. By visually mapping key swing points and structure shifts , it enhances decision-making, helping traders align with the market trend and spot potential reversals.
█ IMPORTANT
⚠ CHoCH signals should be used in conjunction with other confluences such as supply & demand zones, order flow, or trend confirmation.
⚠ Adjust pivot sensitivity based on your preferred timeframe and asset class to optimize accuracy.
Incorporate this indicator into your trading workflow to enhance market structure analysis and refine entry & exit strategies .
📈 Happy trading! 🚀
Yakloft Support and Resistance LevelsYakloft Support and Resistance Levels Indicator
The Yakloft Support and Resistance Levels indicator is a powerful tool designed to help traders identify key support and resistance levels on a price chart. By leveraging advanced pivot point calculations and customizable settings, this indicator provides clear visual cues for potential price reversals and market trends.
Key Features
Automatic Support and Resistance Levels:
Dynamic Calculation: The indicator automatically identifies and plots significant support and resistance levels based on pivot highs and lows.
Customizable Strength: Adjust the S/R Strength parameter to filter levels according to their significance. Higher values display fewer but more robust levels.
Zones Around Levels:
Support and Resistance Zones: Create zones around each support and resistance level to highlight areas of interest rather than exact price points.
High/Low Zones: Plot zones around the highest and lowest price levels within a specified period, providing additional context for potential breakouts or reversals.
Zone Width Adjustment: Customize the width of the zones using the Zone Width % parameter, calculated as a percentage of the price range over the last 300 bars.
Line Styles and Fills:
Customizable Appearance: Modify line colors, styles (Solid, Dotted, Dashed), and widths to match your chart preferences.
Line Fills: Enhance visual clarity by filling zones with semi-transparent colors, making it easier to distinguish between support and resistance areas.
Dynamic Line Management:
Automatic Line Removal: To keep your chart uncluttered, the indicator removes a support or resistance line after the price crosses it twice. This feature helps you focus on the most relevant and current levels.
Expandable Lines:
Line Extension: Choose to extend lines both forward and backward in time with the Expand S/R Lines option, providing a comprehensive view of historical support and resistance.
How It Works
The indicator analyzes price data to identify pivot highs and lows over a specified lookback period. These pivot points are potential areas where the price may reverse or experience significant support or resistance. By filtering these points based on the S/R Strength parameter, the indicator ensures that only the most significant levels are displayed.
Once the levels are identified:
Support Levels: Plotted when the price shows potential to stop falling and possibly start rising.
Resistance Levels: Plotted when the price may stop rising and potentially start falling.
The indicator enhances these levels by:
Adding Zones: By creating a buffer around each level, traders can see areas where the price might interact with support or resistance, rather than focusing on a single price point.
Line Fills: The zones are filled with a semi-transparent color corresponding to support or resistance, improving visual distinction.
Input Parameters
Enable Support & Resistance: Toggle the entire indicator on or off.
Support Color: Choose the color for support lines and fills.
Resistance Color: Choose the color for resistance lines and fills.
S/R Strength: Set the sensitivity of level detection. Higher values result in fewer, more significant levels.
Line Style: Select the style of the support and resistance lines (Solid, Dotted, Dashed).
S/R Line Width: Adjust the thickness of the support and resistance lines.
Enable Zones: Toggle the display of zones around each level.
Enable High/Low Zones: Toggle the display of zones around the highest and lowest price levels.
Zone Width %: Define the width of the zones as a percentage of the price range over the last 300 bars.
Expand S/R Lines: Choose whether to extend the lines across the entire chart or limit them to recent data.
Using the Indicator
Identifying Key Levels:
Use the plotted support and resistance levels to identify potential entry and exit points.
Pay attention to the zones, as they represent areas where the price is more likely to react.
Monitoring Price Interaction:
Observe how the price behaves around the support and resistance levels.
The automatic removal of lines after two crossings helps focus on active levels.
Customizing for Clarity:
Adjust the visual settings to match your trading style and improve chart readability.
Experiment with the S/R Strength and Zone Width % to fine-tune the indicator to different market conditions.
Best Practices
Combine with Other Analysis Tools:
Use the indicator alongside other technical analysis tools like trend lines, moving averages, and oscillators for a more comprehensive market view.
Adjust for Different Timeframes:
The indicator works on various timeframes. Adjust the parameters when switching between short-term and long-term charts to maintain effectiveness.
Stay Updated with Market Conditions:
Market volatility can affect the significance of support and resistance levels. Regularly adjust the S/R Strength parameter to align with current market dynamics.
Limitations
Not a Standalone Solution:
While the indicator provides valuable insights, it should not be used in isolation. Always consider broader market analysis and risk management practices.
Historical Data Dependency:
The accuracy of the levels depends on the availability of sufficient historical data. Ensure your chart includes enough data for the indicator to perform effectively.

Smart Money Setup 07 [TradingFinder] Liquidity Hunts & Minor OB🔵 Introduction
The Smart Money Concept relies on analyzing market structure, tracking liquidity flows, and identifying order blocks. Research indicates that traders who apply these methods can improve their accuracy in predicting market movements by up to 30%.
These elements allow traders to understand the behavior of market makers, including banks and large financial institutions, which have the ability to influence price movements and shape major market trends. By recognizing how these entities operate, traders can align their strategies with Smart Money actions and better anticipate shifts in the market.
Smart Money typically enters the market at points of high liquidity where trading opportunities are more attractive. By following these liquidity flows, professional traders can position themselves at market reversal points, leading to profitable trades.
The Smart Money Setup 07 indicator has been specifically designed to detect these complex patterns. Using advanced algorithms, this indicator automatically identifies both bullish and bearish trading setups, assisting traders in discovering hidden market opportunities.
As a powerful technical analysis tool, the Smart Money Setup indicator helps predict the actions of major market participants and highlights optimal entry and exit points. Essentially, this tool enables traders to act like institutional investors and market makers, making the most of price fluctuations in their favor.
Ultimately, the Smart Money Setup 07 indicator transforms complex technical analysis into a simple and practical tool. By detecting order blocks and liquidity zones, this tool helps traders execute their strategies with greater precision, leading to more informed and successful trading decisions.
🟣 Bullish Setup
🟣 Bearish Setup
🔵 How to Use
One of the key strengths of the Smart Money Setup 07 indicator is its ability to accurately identify order blocks and analyze liquidity flows. Order blocks represent areas where large buy or sell orders are placed by Smart Money investors, which often indicate key reversal points in the market. Traders can use these order blocks to pinpoint potential entry and exit opportunities.
The Smart Money Setup indicator detects and visually displays these order blocks on the chart, helping traders identify the best zones to enter or exit trades. Since these zones are frequently used by large institutional investors, following these blocks allows traders to capitalize on price fluctuations and trade with confidence.
🟣 Bullish Smart Money Setup
A Bullish Smart Money Setup forms when the market creates Higher Lows and Higher Highs. In this situation, the indicator analyzes pivot points, liquidity flows, and order blocks to identify buy opportunities. Liquidity points in these setups indicate areas where Smart Money is likely to enter long positions.
In the bullish setup image, multiple Higher Lows and Higher Highs are formed. The green zone represents a Bullish Order Block, signaling traders to enter a long trade. The Smart Money Setup indicator displays a green arrow, indicating a high-probability upward price movement from this liquidity zone.
🟣 Bearish Smart Money Setup
A Bearish Smart Money Setup occurs when the market structure shows Lower Highs and Lower Lows, indicating weakness in price. The indicator identifies these patterns and highlights potential sell opportunities. Liquidity points in this setup mark areas where Smart Money enters sell positions.
In the bearish setup image, a Lower High is followed by a Lower Low, with the red liquidity zone acting as a Bearish Order Block. The Smart Money Setup indicator shows a red arrow, signaling a likely downward move, offering traders an opportunity to enter short positions.
🔵 Settings
Pivot Period : This setting determines how many candles are needed to form a pivot point. A default value of 2 is optimal for quickly identifying key pivot points in price action.
Order Block Validity Period : This parameter defines the lifespan of an order block. Traders can adjust how long each order block remains valid. For instance, setting it to 500 means that an order block will be valid for 500 bars after its formation.
Mitigation Level OB : This setting allows traders to select whether order blocks should be based on the "Proximal," "50% OB," or "Distal" levels, helping traders manage risk more effectively.
Order Block Refinement : Traders can refine the order blocks with precision. The indicator offers two refinement modes: Defensive and Aggressive. The Defensive mode identifies safer order blocks, while the Aggressive mode targets higher-risk blocks with the potential for larger reversals.
🔵 Conclusion
The Smart Money Setup 07 indicator is a powerful tool for identifying key Smart Money movements in the market. It provides traders with essential insights for making informed trading decisions, particularly when combined with technical analysis and liquidity flow analysis. This indicator allows traders to accurately pinpoint entry and exit points, helping them maximize profits and minimize risk.
By offering a range of customizable settings, the Smart Money Setup indicator adapts to different trading styles and strategies. Furthermore, its ability to detect order blocks and identify supply and demand zones makes it an indispensable tool for any trader looking to enhance their strategy.
In conclusion, the Smart Money Setup 07 is a crucial tool for traders aiming to optimize their trading performance. By utilizing the concepts of Smart Money in technical analysis, traders can make more precise decisions and take advantage of market fluctuations.

Volatility Breaker Blocks [BigBeluga]The Volatility Breaker Blocks indicator identifies key market levels based on significant volatility at pivot highs and lows. It plots blocks that act as potential support and resistance zones, marked in green (support) and blue (resistance). Even after a breakout, these blocks leave behind shadow boxes that continue to impact price action. The sensitivity of block detection can be adjusted in the settings, allowing traders to customize the identification of volatility breakouts. The blocks print triangle labels (up or down) after breakouts, indicating potential areas of interest.
🔵 IDEA
The Volatility Breaker Blocks indicator is designed to highlight key areas in the market where volatility has created significant price action. These blocks, created at pivot highs and lows with increased volatility, act as potential support and resistance levels.
The idea is that even after price breaks through these blocks, the remaining shadow boxes continue to influence price movements. By focusing on volatility-driven pivot points, traders can better anticipate how price may react when it revisits these areas. The indicator also captures the natural tendency for price to retest broken resistance or support levels.
🔵 KEY FEATURES & USAGE
◉ High Volatility Breaker Blocks:
The indicator identifies areas of high volatility at pivot highs and lows, plotting blocks that represent these zones. Green blocks represent support zones (identified at pivot lows), while blue blocks represent resistance zones (identified at pivot highs).
Support:
Resistance:
◉ Shadow Blocks after Breakouts:
When price breaks through a block, the block doesn't disappear. Instead, it leaves behind a shadow box, which can still influence future price action. These shadow blocks act as secondary support or resistance levels.
If the price crosses these shadow blocks, the block stops extending, and the right edge of the box is fixed at the point where the price crosses it. This feature helps traders monitor important price levels even after the initial breakout has occurred.
◉ Triangle Labels for Breakouts:
After the price breaks through a volatility block, the indicator prints triangle labels (up or down) at the breakout points.
◉ Support and Resistance Retests:
One of the key concepts in this indicator is the retesting of broken blocks. After breaking a resistance block, price often returns to the shadow box, which then acts as support. Similarly, after breaking a support block, price tends to return to the shadow box, which becomes a resistance level. This concept of price retesting and bouncing off these levels is essential for understanding how the indicator can be used to identify potential entries and exits.
The natural tendency of price to retest broken resistance or support levels.
Additionaly indicator can display retest signals of broken support or resistance
◉ Customizable Sensitivity:
The sensitivity of volatility detection can be adjusted in the settings. A higher sensitivity captures fewer but more significant breakouts, while a lower sensitivity captures more frequent volatility breakouts. This flexibility allows traders to adapt the indicator to different trading styles and market conditions.
🔵 CUSTOMIZATION
Calculation Window: Defines the window of bars over which the breaker blocks are calculated. A larger window will capture longer-term levels, while a smaller window focuses on more recent volatility areas.
Volatility Sensitivity: Adjusts the threshold for volatility detection. Lower sensitivity captures smaller breakouts, while higher sensitivity focuses on larger, more significant moves.
Retest Signals: Display or hide retest signals of shadow boxes

Wedge BreakoutThe Wedge Breakout indicator is designed to identify and signal potential breakouts from a wedge pattern, a common technical analysis formation. A wedge pattern typically forms when the price moves within converging trendlines, indicating a potential upcoming breakout either upwards (bullish) or downwards (bearish).
Identifying Pivot Points:
The indicator first calculates pivot points, which are significant highs and lows that define the wedge's upper and lower boundaries.
Pivot Lows: It identifies the lowest price points over a specified length (input_len), which serves as the lower boundary of the wedge.
Pivot Highs: Similarly, it identifies the highest price points over the same length, forming the upper boundary of the wedge.
Drawing Trendlines:
The pivot points are connected to form dashed trendlines that represent the upper and lower boundaries of the wedge.
The indicator uses the SimpleTrendlines library to manage and draw these trendlines dynamically:
Green Trendline: Indicates an upward slope (bullish).
Red Trendline: Indicates a downward slope (bearish).
Calculating the Breakout Conditions:
A breakout is confirmed when the price action fulfills two conditions:
The candle's high exceeds the upper trendline's highest point.
The candle's low drops below the lower trendline's lowest point.
This condition suggests that the price is squeezing within the wedge pattern and is about to break out.
Determining Breakout Direction:
The direction of the breakout is determined by the candle's closing position relative to its opening:
Bullish Breakout (Upward): When the candle closes above its opening price (close > open) after breaching both trendlines, it suggests a bullish breakout. This condition is marked with a green upward triangle .
Bearish Breakout (Downward): When the candle closes below its opening price (close < open) after breaching both trendlines, it suggests a bearish breakout. This condition is marked with a red downward triangle.
Visual Representation:
Green Triangle Up: Plotted below the bar to indicate a potential bullish breakout.
Red Triangle Down: Plotted above the bar to indicate a potential bearish breakout.
Used library:
www.tradingview.com

Enhanced BOS Strategy with SL/TP and EMA TableDescription:
The Enhanced BOS (Break of Structure) Strategy is an advanced open-source trading indicator designed to identify key market structure changes, integrated with dynamic Stop Loss (SL) and Take Profit (TP) levels, along with an informative EMA (Exponential Moving Average) table for added trend analysis.
Key Features:
Break of Structure (BOS) Detection:
The script detects bullish and bearish BOS by identifying pivot points using a custom pivot period. When the price crosses above or below these points, it signals a potential market trend reversal or continuation.
Dynamic SL/TP Levels:
Users can toggle static SL/TP settings, which automatically calculate levels based on user-defined points. These levels are visualized on the chart with dotted lines and labeled for clarity.
Volume Filters:
The strategy includes a volume condition filter to ensure that only trades within a specified volume range are considered. This helps in avoiding low-volume trades that might lead to false signals.
EMA Table Display:
An on-chart table displaying the current values of the 13-period, 50-period, and 200-period EMAs. This provides a quick reference for trend identification and confirmation, helping traders to stay aligned with the broader market trend.
How It Works:
The script utilizes a combination of moving averages and pivot points to identify potential breakouts or breakdowns in market structure. When a bullish BOS is detected, and the volume conditions are met, the strategy suggests a long position, marking potential SL/TP levels. Similarly, it suggests short positions for bearish BOS.
The EMA table serves as a visual aid, providing real-time updates of the EMA values, allowing traders to gauge the market’s directional bias quickly.
How to Use:
Setting Parameters:
Adjust the pivot period to fine-tune BOS detection according to your trading style and the asset’s volatility.
Configure the SL/TP settings based on your risk tolerance and target profit levels.
Interpreting Signals:
A “Buy” label on the chart indicates a bullish BOS with volume confirmation, signaling a potential long entry.
A “Sell” label indicates a bearish BOS with volume confirmation, signaling a potential short entry.
The EMA table aids in confirming these signals, where the position of the fast, mid, and slow EMAs can provide additional context to the trend’s strength and direction.
Volume Filtering:
Ensure your trades are filtered through the script’s volume condition, which allows for the exclusion of low-volume periods that might generate unreliable signals.
Unique Value:
Unlike many other BOS strategies, this script integrates volume conditions and a visual EMA table, providing a comprehensive toolkit for traders looking to capture market structure shifts while maintaining an eye on trend direction and trade execution precision.
Additional Information:
This script is designed for use on standard bar or candlestick charts for best results.
It is open-source and free to use, encouraging collaboration and improvement by the TradingView community.
By combining powerful trend-following EMAs with the precision of BOS detection and the safety of volume filtering, the Enhanced BOS Strategy offers a balanced approach to trading market structure changes.

ZigZag Multi [TradingFinder] Trend & Wave Lines - Structures🔵 Introduction
"Zigzag" is an indicator that forms based on price changes. Essentially, the function of this indicator is to connect consecutive and alternating High and Low pivots. This pattern assists in analyzing price changes and can also be used to identify classic patterns. "Zigzag" is an analytical tool that, by filtering partial price movements based on the specified period, can identify price waves across different time frames (short or long term).
🔵 Reason for Creation
The combination of "short term zigzag" and "long term zigzag" enhances accuracy and reduces analysis time. In a time frame, "long term zigzag" represents the main trend, while "short term zigzag" depicts short-term waves.
🔵 How to Use
After selecting the desired time frame and adding "zigzag" to the chart, begin utilization. Keep in mind to identify the main market trend from "long term zigzag" and the minor waves from "short term zigzag".
🟣 Important: Additionally, classic patterns such as HH, LH, LL, and HL can be recognized. All traders analyzing financial markets using classic patterns and Elliot Waves can benefit from the "zigzag" indicator to facilitate their analysis.
🔵 Settings
Short term zigzag : In this section, you can adjust settings such as time frame range, display mode, color, and line width of the zigzag lines.
Short term label : This section allows you to activate or deactivate the display of zigzag labels according to your needs. You can also customize their color and size.
Long term zigzag : Here, you can adjust settings for time frame range, display mode, color, and line width of zigzag lines.
Long term label : Similar to short term label settings.
The recommended time frame for "long term zigzag" is between 9 to 15, and for "short term zigzag" is between 3 to 5.
🟣 Important Notes :
Considering the different behaviors of financial markets and various time frames, it is recommended to experiment with different time frame settings when using "zigzag" to find the best settings for each symbol and time frame, thereby preventing potential errors.
🟣 Terminology Explanations :
"HH": When the price is higher than the previous peak (Higher High).
"HL": When the price is higher than the previous low (Higher Low).
"LH": When the price is lower than the previous peak (Lower High).
"LL": When the price is lower than the previous low (Lower Low).

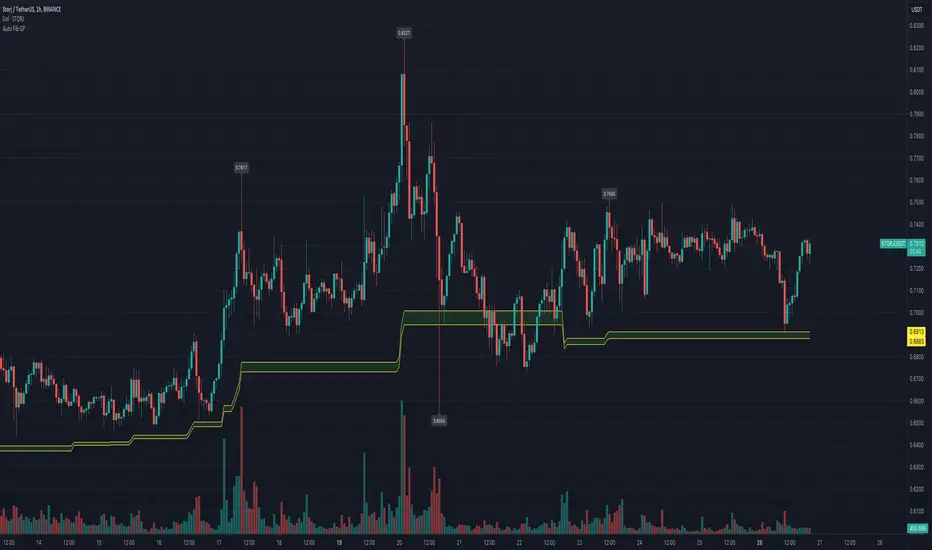
Automatic Fibonacci Retracement Golden Pocket (GP)Main info
This script automatically draws you the Fibonacci retracement level called golden pocket from the latest detected pivot point to the actual price. This level is very popular among traders because the price tends to reverse on this level pretty often. You should use this on higher timeframes 15m+.
It is good to keep in mind that this level alone is not enough, you should still have another level there to enter the trade, for example golden pocket in combination with a demand zone is pretty solid. :)
Settings
The length for pivot point calculation is available in the script settings.
You can enable inverted golden pocket (for shorts)
You can hide/show the pivot point labels
If you want any updates, just feel free to write me :)
Titans Empirical LevelsThis indicator marks key pivot levels across two higher timeframes, longer term, and medium term.
When a pivot high or low is detected at the higher timeframe, a line is plotted in the future.
The user may select timeframes and pivot sensitivities in the indicator settings.
As no calculation is involved, the levels are identified purely from historical precedent.
Overlapping lines could imply strength of recent support/resistance at that level.
This indicator should be used in combination with other indicators.
The user is advised to use this indicator at his own risk.

Multi ZigZagI created this as basis for my next scripts. We are just trying to plot multiple zigzags with different length basis here. Input allows you to select different Length , Width , Color and Line Style for each Zigzags.
Max_pivot_size says how many pivots each Zigzag can have. Value 100 means, each zigzag will show 99 lines joining 100 points.
Additional option ShowStatsTable allows you to print pivots in a table. Table only shows selected zigzags.

Pivot Boss - Advanced Volume IndicatorThis indicator measures "Compression and Expansion" of current bars volume against 10 day average volume(Can be user defined)
Avg Volume = 10 day avg volume
Wide volume = AvgVolume x 1.25 (Volume bar will be Blue color)
Narrow Volume = AvgVolume x 0.65 (Volume bar will be Magenta color)
Yellow line -- 5 bar avg volume
White Line -- 10 bar avg volume

Pivot OBV Reset [LM]Hi traders,
I woud like to introduce new script of obv indicator that resets on creation of new pivot high or low. Note that it resets when it's known that it is a pivot. On the reset candle adds accumulated value from previous candles defined by i_right input.
It has following settings:
pivot setting - here you can infulence pivot detection
obv setting - here you can influence whether it should be multiplied by price or not, if it should show when the reset happen
Hope you'll enjoy it


Pivot deviation code from linear regression used
pivots taken from
so we hybrid the two of them, so insted the linear regression we use the P point of the pivot
the aime here is to see better the true resitance and support level that tradition pivot is missing

™TradeChartist Fib Extensions™TradeChartist Fib Extensions is a free to use script that helps traders plot Fibonacci Extensions on chart. Even though Trading View has a Fib extensions tool, some traders may prefer a plotting script like this with Fib plot lines extending across the whole of the chart to track historic prices in relation to Fib extensions drawn.
----To draw Fib extensions for uptrend ,
1. Choose a Pivot Low point (LL or a HL) as Pivot 1
2. Choose a Pivot High point (must be higher than Pivot 1) as Pivot 2
3. Choose a Pivot Low point (must be lower than Pivot 2, must be Higher than Pivot 1)
----To draw Fib extensions for downtrend,
1. Choose a Pivot High point (HH or a LH) as Pivot 1
2. Choose a Pivot Low point (must be lower than Pivot 1) as Pivot 2
3. Choose a Pivot High point (must be higher than Pivot 2 and lower than Pivot 1)
Negative extensions of -23.6% and -61.8% fib plots may be useful for some to spot reversals or to set stop losses.
Higher levels can be used if price goes beyond 161.8%
This is a free to use indicator. Give a thumbs up or leave a comment if you like the script
Check my 'Scripts' page to see other published scripts. Get in touch with me if you would like access to my invite-only scripts for a trial before deciding on a paid access for a period of your choice. Half-Yearly, Annual and Lifetime access available on invite-only scripts along with 1hr Team Viewer intro session.


PivotBoss Wick Reversal SetupPATTERN SUMMARY
1. The body is used to determine the size oftlle reversal wick. A wick tllat is between 2.5 to 3.5 times larger than
the size of the body is ideal.
2. For a bullish reversal wick to exist, tlle close ofthe bar should fall witllin tlle top 35 percent of the overall range
of the candle.
3. For a bearish reversal wick to exist, the close of the bar should fall within the bottom 35 percent of the overall
range of the candle.
PATTERN PSYCHOLOGY
Figure 2-4 shows several types of bullish and bearish reversal wick candlesticks that can all signal
profitable reversal opportunities in the market, especially if these patterns are paired with key pivot levels. In
traditional candlestick jargon, these particular candlesticks would have names ranging from hammer , hanging
man, inverted hammer , shooting star , gravestone doji , or dragonfly doji , depending on where the candle is
placed in a trend. Now you can see why I simply call these candlesticks wicks, or even tails. Instead of fumbling
over the proper naming of these candlesticks , I believe it is more important to know what these patterns
represent. What are they telling you?
Types of Candlestick Reversal Wicks
When the market has been trending lower then suddenly forms a reversal wick candlestick , the likelihood of
a reversal increases since buyers have finally begun to overwhelm the sellers. Selling pressure rules the decline,
but responsive buyers entered the market due to perceived undervaluation. For the reversal wick to open near the
high of the candle, sell off sharply intra-bar, and then rally back toward the open of the candle is bullish , as it
signifies that the bears no longer have control since they were not able to extend the decline of the candle, or the
trend. Instead, the bulls were able to rally price from the lows of the candle and close the bar near the top of its
range, which is bullish - at least for one bar, which hadn't been the case during the bearish trend (see Figure 2.5).
The Stages of a Reversal Wick
Stage 1 Stage 2 Stage 3
Essentially, when a reversal wick forms at the extreme of a trend, the market is telling you that the trend
either has stalled or is on the verge of a reversal. Remember, the market auctions higher in search of sellers, and
lower in search of buyers. When the market over-extends itself in search of market participants, it will find itself
out of value, which means responsive market participants will look to enter the market to push price back toward
an area of perceived value. This will help price find a value area for two-sided trade to take place. When the
market finds itself too far out of value, responsive market participants will sometimes enter the market with
force, which aggressively pushes price in the opposite direction, essentially forming reversal wick candlesticks .
This pattern is perhaps the most telling and common reversal setup, but requires steadfast confirmation in order
to capitalize on its power. Understanding the psychology behind these formations and learning to identify them
quickly will allow you to enter positions well ahead of the crowd, especially if you've spotted these patterns at
potentially overvalued or undervalued areas.
