Smart Structure Pro - Market Structure & Smart Money Concepts═══════════════════════════════════════════════════════════════════════════════
SMART STRUCTURE PRO
═══════════════════════════════════════════════════════════════════════════════
A comprehensive market structure analysis tool that identifies institutional trading
patterns and smart money concepts for improved trade timing and decision-making.
═══════════════════════════════════════════════════════════════════════════════
📊 WHAT IT DOES
═══════════════════════════════════════════════════════════════════════════════
This indicator automatically detects and visualizes key market structure elements:
🔹 BOS (Break of Structure)
- Identifies trend continuation patterns
- Marks when price breaks above previous highs (bullish) or below previous lows (bearish)
- Confirms trend strength and momentum
🔹 CHoCH (Change of Character)
- Detects potential trend reversals
- Alerts when market structure shifts from bullish to bearish or vice versa
- Helps identify early reversal opportunities
🔹 Order Blocks
- Highlights institutional entry zones
- Identifies the last opposite candle before a structure break
- Shows areas where smart money likely entered positions
🔹 Fair Value Gaps (FVG)
- Detects price imbalances and inefficiencies
- Shows areas where price moved rapidly leaving gaps
- Often act as support/resistance when retested
🔹 Liquidity Zones
- Marks swing high and low levels
- Identifies areas where stop losses likely cluster
- Shows potential stop hunt and liquidity grab zones
═══════════════════════════════════════════════════════════════════════════════
🎯 HOW TO USE
═══════════════════════════════════════════════════════════════════════════════
BULLISH SETUP:
1. Wait for Bullish CHoCH (trend reversal signal) or BOS ↑ (continuation)
2. Look for price to pull back into an Order Block or Fair Value Gap
3. Enter long when price bounces from these zones
4. Place stop loss below the Order Block
5. Target the next liquidity zone or resistance level
BEARISH SETUP:
1. Wait for Bearish CHoCH (trend reversal signal) or BOS ↓ (continuation)
2. Look for price to retrace into an Order Block or Fair Value Gap
3. Enter short when price rejects from these zones
4. Place stop loss above the Order Block
5. Target the next liquidity zone or support level
DASHBOARD INTERPRETATION:
• Trend: Current market direction (Bullish/Bearish)
• Volume: Confirmation strength (High volume = stronger signals)
• Signal: Latest structure break detected
• Key High/Low: Critical levels for the current trend
• Position: Price location (Premium = expensive, Discount = cheap)
═══════════════════════════════════════════════════════════════════════════════
⚙️ SETTINGS GUIDE
═══════════════════════════════════════════════════════════════════════════════
STRUCTURE DETECTION:
• Pivot Length (Default: 10)
- Lower values = More signals but potentially weaker
- Higher values = Fewer signals but stronger/more reliable
- Recommended: 8-12 for intraday, 10-15 for higher timeframes
• Structure Line Extension
- Visual preference for how far lines extend
- Does not affect signal detection
SMART MONEY CONCEPTS:
• Order Block Extension: How long OB boxes remain visible
• FVG Extension: How long gap boxes remain visible
• Min FVG Size: Filter out small gaps (0 = show all)
- Set to 10-20% to reduce noise
- Set to 0 to see all gaps
VOLUME FILTER:
• Volume Confirmation (Recommended: ON)
- Filters weak signals without volume support
- Reduces false breakouts
• Volume Multiplier (Default: 1.5)
- Higher = Stricter filtering (fewer but stronger signals)
- Lower = More signals (but may include weak ones)
DISPLAY:
• Dashboard: Toggle information panel
• Trend Background: Subtle color tint showing current trend
• Dashboard Position: Choose corner placement
═══════════════════════════════════════════════════════════════════════════════
🔔 ALERTS
═══════════════════════════════════════════════════════════════════════════════
Available alert conditions:
✓ Bullish BOS - Uptrend continuation confirmed
✓ Bearish BOS - Downtrend continuation confirmed
✓ Bullish CHoCH - Reversal to uptrend detected
✓ Bearish CHoCH - Reversal to downtrend detected
✓ Structure Break - Any significant market structure change
To set up alerts:
1. Click the "⏰" alert icon
2. Select "Smart Structure Pro"
3. Choose your desired condition
4. Configure notification method
5. Click "Create"
═══════════════════════════════════════════════════════════════════════════════
⚠️ IMPORTANT DISCLOSURES
═══════════════════════════════════════════════════════════════════════════════
REPAINTING BEHAVIOR:
• Pivot points WILL repaint until confirmed (this is by design and unavoidable)
• Structure breaks (BOS/CHoCH) use CLOSED candles and do NOT repaint after confirmation
• Order Blocks and FVGs are drawn on confirmed signals and do NOT repaint
• All signals wait for candle close before triggering
BEST PRACTICES:
• Use on higher timeframes (15min+) for more reliable signals
• Combine with other analysis (support/resistance, volume profile, etc.)
• Wait for candle close confirmation before acting on signals
• Use proper risk management - this is not a standalone trading system
• Backtest on your preferred instrument and timeframe
PERFORMANCE:
• Limited to 100 boxes, 100 lines, 100 labels for optimal performance
• Older objects automatically removed as new ones appear
• Works on all markets (Forex, Crypto, Stocks, Indices, Commodities)
═══════════════════════════════════════════════════════════════════════════════
📚 CONCEPTS EXPLAINED
═══════════════════════════════════════════════════════════════════════════════
MARKET STRUCTURE:
Market structure refers to the pattern of price movements creating swing highs
and lows. Understanding structure helps identify trend direction and potential
reversal points.
SMART MONEY CONCEPTS:
These are trading techniques based on tracking institutional order flow and
understanding where large players (banks, funds, institutions) enter and exit
positions.
ORDER BLOCKS:
The last opposing candle before a strong directional move. Institutions often
leave unfilled orders in these zones, which can act as support/resistance when
price returns.
FAIR VALUE GAPS:
Areas where price moved so quickly that it left an imbalance. These gaps often
get "filled" as price returns to find equilibrium, creating trading opportunities.
═══════════════════════════════════════════════════════════════════════════════
🎓 EDUCATIONAL VALUE
═══════════════════════════════════════════════════════════════════════════════
This indicator helps traders:
✓ Understand market structure mechanics
✓ Identify institutional trading patterns
✓ Improve trade timing and entry precision
✓ Recognize trend continuation vs reversal
✓ Learn smart money concepts through visualization
═══════════════════════════════════════════════════════════════════════════════
📋 TECHNICAL DETAILS
═══════════════════════════════════════════════════════════════════════════════
• Version: 1.0.0
• Pine Script Version: 5
• Indicator Type: Overlay
• No Repainting: Structure breaks use confirmed candles
• Performance Optimized: Limited drawing objects
• Works On: All markets and timeframes
• Alerts: Yes, fully customizable
═══════════════════════════════════════════════════════════════════════════════
👤 AUTHOR
═══════════════════════════════════════════════════════════════════════════════
Created by: Zakaria Safri
Original Work: All code and concepts are original implementations
Based On: ICT (Inner Circle Trader) educational concepts
License: © 2024 Zakaria Safri - Personal Use Only
═══════════════════════════════════════════════════════════════════════════════
⚖️ DISCLAIMER
═══════════════════════════════════════════════════════════════════════════════
This indicator is for educational and informational purposes only. It does not
constitute financial advice. Trading involves substantial risk of loss. Past
performance does not guarantee future results. Always conduct your own research
and consult with a licensed financial advisor before making trading decisions.
The author is not responsible for any losses incurred from using this indicator.
═══════════════════════════════════════════════════════════════════════════════
If you find this indicator helpful, please:
👍 Like and favorite
⭐ Leave a review
📢 Share with other traders
💬 Comment with feedback or suggestions
Happy Trading! 📈
스크립트에서 "pivot points"에 대해 찾기

Inside Candle DivergenceStudy Material: Inside Candle Divergence Indicator (aiTrendview)
1. Introduction
The Inside Candle Divergence Indicator is a custom tool built on TradingView using Pine Script. It is designed to help traders identify potential reversal points or trend continuations using a mix of candlestick analysis, RSI (Relative Strength Index), VWAP (Volume Weighted Average Price), Pivot Points, and Volume analytics. The tool also provides a dashboard table on the chart, summarizing all key values in a single glance for traders and analysts.
This indicator is not just a signal generator but also an educational framework—explaining how different concepts in technical analysis combine to build a systematic approach for market entries and exits.
________________________________________
2. Core Concepts Behind the Tool
A. Inside Candle Pattern
An Inside Candle forms when the current candle’s high is lower than or equal to the previous candle’s high, and the low is higher than or equal to the previous candle’s low.
• This means the entire price action of the current candle is "inside" the range of the previous candle.
• A bullish inside candle occurs when the close is higher than the open.
• A bearish inside candle occurs when the close is lower than the open.
This pattern shows market indecision but also sets up potential breakouts or trend reversals.
________________________________________
B. RSI (Relative Strength Index)
The indicator calculates RSI using the formula from the ta.rsi() function in TradingView. RSI helps measure momentum in the market.
• A low RSI (below 25) signals an oversold zone → possible buy.
• A high RSI (above 75) signals an overbought zone → possible sell.
By combining RSI with the Inside Candle, the indicator ensures that signals are triggered only when momentum and price patterns confirm each other.
________________________________________
C. Buy & Sell Signals
• Buy Signal: Triggered when RSI < Buy Level (default 25) and a bullish inside candle forms.
• Sell Signal: Triggered when RSI > Sell Level (default 75) and a bearish inside candle forms.
When triggered, the chart displays a BUY (green label below candle) or SELL (red label above candle) marker. The indicator also saves the entry price and signal bar for future reference inside the dashboard.
________________________________________
D. VWAP (Volume Weighted Average Price)
VWAP is calculated using the typical price (H+L+C)/3 and weighting it by volume.
• VWAP shows the average trading price weighted by volume, widely used by institutions.
• The tool calculates the distance of price from VWAP in % terms.
• If price is far above VWAP, the market may be overheated (overbought). If far below, it may be undervalued (oversold).
________________________________________
E. Volume Analysis
The tool splits volume into Buy Volume and Sell Volume:
• Buy Volume: If close > open.
• Sell Volume: If close ≤ open.
• Cumulative totals are maintained, and percentages are calculated to show what proportion of total market volume is bullish vs bearish.
• A progress bar style visual (using blocks █) shows the dominance of buyers or sellers.
This allows traders to quickly measure whether buyers or sellers are controlling the market trend.
________________________________________
F. Daily Pivot Points
Pivot Points are calculated using the previous day’s high, low, and close:
• Pivot = (High + Low + Close) / 3
• R1, S1, R2, S2, R3, S3 levels are derived from this pivot.
• These levels act as support and resistance zones.
The script plots Pivot, R1, and S1 lines on the chart for easy reference.
________________________________________
G. Trend Direction
The indicator checks where the price is compared to R1 and S1:
• If price > R1 → Bullish Trend
• If price < S1 → Bearish Trend
• Otherwise → Neutral Trend
The trend direction is displayed in the dashboard with arrows (↑, ↓, →).
________________________________________
H. Price Change Calculation
The tool calculates:
• Price Change = Current Close – Previous Close
• Percentage Change = (Change / Previous Close) × 100
• Displays ▲ (green upward) or ▼ (red downward) with the exact percentage.
This gives traders a quick snapshot of intraday price movement.
________________________________________
I. Dashboard Table
One of the most powerful features is the real-time dashboard table shown on the chart. It contains:
1. Symbol & Price Info (Current ticker, price, change %)
2. RSI Reading (with color coding: green for oversold, red for overbought)
3. VWAP and Distance from VWAP
4. Volume Analysis with Progress Bar (Buy vs Sell %)
5. Pivot Levels (Pivot, R1, S1)
6. Trend Direction (Bullish, Bearish, Neutral)
7. Signal Status (Last Buy/Sell signal with entry price)
This reduces the need for multiple indicators and gives traders a command-center view directly on the chart.
________________________________________
J. Alerts
The tool generates alerts whenever a Buy or Sell condition is met. Traders can set up TradingView alerts to be notified instantly when:
• Buy Signal Alert → RSI oversold + Bullish inside candle
• Sell Signal Alert → RSI overbought + Bearish inside candle
This ensures no opportunity is missed even if you’re not actively monitoring the chart.
________________________________________
K. Background Highlights
The chart background also changes faintly (light green or light red) when a Buy or Sell condition is triggered. This gives traders visual confirmation along with signals and alerts.
________________________________________
3. Practical Use of This Tool
• Scalpers & Intraday Traders can use it for quick momentum-based entries.
• Swing Traders can use the RSI + Inside Candle + Pivot Points to find medium-term reversals.
• Analysts can use the dashboard for real-time summaries in reports.
• Volume Analysis helps understand institutional activity.
Remember: This is not a standalone holy grail. It must be used with proper risk management and confirmation from higher timeframes.
________________________________________
4. Strict Disclaimer (aiTrendview)
⚠️ Disclaimer from aiTrendview:
This indicator is designed for educational and analytical purposes only. It is not financial advice or a guaranteed trading strategy. Markets are inherently risky and unpredictable; past performance of indicators does not ensure future results. Trading involves risk of financial loss, and traders must use proper risk management, stop-loss, and independent judgment.
aiTrendview strictly follows TradingView.com rules and compliance guidelines.
Any misuse of this tool, its code, or analytical features for unauthorized commercial purposes, false promises, or misleading activities is strictly discouraged. The creators of this script and aiTrendview will not be responsible for any losses, damages, or misuse arising from its application. Always trade responsibly and only with money you can afford to lose.
________________________________________

SCTI V30Description
The SCTI V30 is an advanced multi-functional technical analysis indicator for TradingView that combines multiple analytical approaches into a single comprehensive tool. This indicator provides:
Multiple Moving Average Types (EMA, SMA, PMA with various calculation methods)
Customizable VWAP with standard deviation bands
Sophisticated Divergence Detection across 12 different indicators
Volume Profile Analysis with peak/trough detection
Highly Configurable Display Options
The indicator is designed to help traders identify trends, potential reversals, and key support/resistance levels across different timeframes.
Features
1. Moving Average Systems
EMA Section: 13 configurable EMA periods (8, 13, 21, 34, 55, 89, 144, 233, 377, 610, 987, 1597, 2584)
SMA Section: 13 configurable SMA periods (same as EMA)
PMA Section: 11 customizable moving averages with multiple calculation methods:
ALMA, EMA, RMA, SMA, SWMA, VWAP, VWMA, WMA
Adjustable lengths from 12 to 1056
Customizable colors, widths, and fill options between MAs
2. VWAP Implementation
Multiple anchor periods (Session, Week, Month, Quarter, Year, etc.)
Standard deviation or percentage-based bands
Option to hide on daily/weekly/monthly timeframes
Customizable band multipliers (1.0, 2.0, 3.0)
3. Divergence Detection
Detects regular and hidden divergences across 12 indicators:
MACD, MACD Histogram, RSI, Stochastic, CCI, Momentum
OBV, VW-MACD, Chaikin Money Flow, Money Flow Index
Williams %R, and custom external indicators
Customizable detection parameters:
Pivot point period (1-50)
Source (Close or High/Low)
Divergence type (Regular, Hidden, or Both)
Minimum number of divergences required (1-11)
Maximum pivot points to check (1-20)
Maximum bars to look back (30-200)
4. Volume Profile Analysis
Configurable profile length (10-5000 bars)
Value Area threshold (0-100%)
Profile placement (Left or Right)
Number of rows (30-130)
Profile width adjustment
Volume node detection:
Peaks (with cluster option)
Troughs (with cluster option)
Highest/Lowest volume nodes
Customizable colors for all elements
Input Parameters
The indicator is organized into 7 parameter groups:
Basic Indicator Settings - Toggle visibility of main components
EMA Settings - Configure 13 EMA periods and visibility
SMA Settings - Configure 13 SMA periods and visibility
PMA Settings - Advanced moving average configuration
VWAP Settings - Volume-weighted average price configuration
Divergence Settings - Comprehensive divergence detection options
Volume Profile & Node Detection - Volume analysis configuration
How to Use
Trend Identification: Use the multiple moving averages to identify trend direction and strength. The Fibonacci-based periods (21, 34, 55, 89, 144, etc.) are particularly useful for this.
Support/Resistance: The VWAP and volume profile components help identify key support/resistance levels.
Divergence Trading: Look for divergences between price and the various indicators to spot potential reversal points.
Volume Analysis: The volume profile shows where the most trading activity occurred, highlighting important price levels.
Customization: Adjust the settings to match your trading style and timeframe. The indicator is highly configurable to suit different trading approaches.
Alerts
The indicator includes alert conditions for:
Positive regular divergence detected
Negative regular divergence detected
Positive hidden divergence detected
Negative hidden divergence detected
Any positive divergence (regular or hidden)
Any negative divergence (regular or hidden)
Notes
The indicator may be resource-intensive due to its comprehensive calculations, especially on lower timeframes with long lookback periods.
Some features (like VWAP) can be hidden on higher timeframes to improve performance.
The default settings are optimized for daily charts but can be adjusted for any timeframe.
This powerful all-in-one indicator provides traders with a complete toolkit for technical analysis, combining trend-following, momentum, volume, and divergence techniques into a single, customizable solution.

Level Master Pro+ [MMT]Level Master Pro+ Indicator
The Level Master Pro+ is a highly customizable Pine Script indicator designed for TradingView, built to plot key pivot point levels, support and resistance zones, and additional price levels such as previous close, bottom central (BC), and top central (TC) on a chart. This indicator is tailored for traders who rely on pivot-based strategies, offering flexibility in timeframe selection, visual styling, and level visibility to suit various trading styles.
Key Features:
- Pivot Point Levels:
Plots traditional pivot points (P), up to six levels of support (S1–S6) and resistance (R1–R6), previous close (PC), base control (BC), and top control (TC).
Automatically calculates R6 and S6 using the pivot range (high - low) for extended analysis.
Supports customizable timeframes for pivot calculations (default: 1D).
- Customization Options:
Pivot History : Adjust the number of historical pivots displayed (1–200).
Line Styling : Choose line width (1–10), style (solid, dashed, dotted), and transparency (0–100%).
Label Styling : Toggle labels and price values, set label position (left or right), size (tiny to huge), and background transparency.
Color Customization : Assign unique colors to each level (P, S1–S6, R1–R6, PC, BC, TC) with default settings like green for support, red for resistance, and purple for BC/TC.
Extend to Current Bar : Optionally extend pivot lines to the current bar for real-time tracking.
- Visual and Performance Optimization :
Uses an overlay to plot levels directly on the price chart.
Supports up to 500 lines and labels to prevent performance issues.
Efficiently manages historical pivot data by removing outdated graphics when the maximum pivot count is exceeded.
- Dynamic Updates :
Automatically updates pivot lines and labels when a new timeframe period begins (e.g., new day for daily pivots).
Ensures smooth rendering with real-time adjustments for extended lines and label positions.
Use Case:
The Level Master Pro+ is ideal for traders employing pivot point strategies to identify potential support and resistance zones, reversal points, or breakout levels. Its extensive customization options make it suitable for day trading, swing trading, or long-term analysis across various markets (stocks, forex, crypto, etc.).
How It Works:
Data Source : Uses request.security to fetch pivot data based on the selected timeframe.
Level Calculations: Computes traditional pivot points and derives additional levels (R6, S6, BC, TC) using high, low, and close prices from the previous period.
Rendering : Draws lines and labels for each enabled level, with options to extend lines to the current bar or anchor them to the timeframe’s end.
Memory Management : Stores pivot graphics in a matrix and removes older pivots to stay within the user-defined historical limit.
Settings Overview :
Pivot Timeframe : Set the timeframe for pivot calculations (e.g., daily, weekly).
Show Labels/Prices : Enable or disable level labels and price values.
Line Style : Customize line appearance and transparency.
Label Style : Adjust label size and background transparency.
Level Visibility : Toggle visibility for each level (P, S1–S6, R1–R6, PC, BC, TC) and customize their colors.
This indicator empowers traders with a robust tool to visualize critical price levels with precision and flexibility, enhancing technical analysis and decision-making.

Pivot Channel LevelsPivot Channel Levels
Indicator Description
“Pivot Channel Levels” is an advanced technical analysis tool that identifies key price pivots (highs and lows) and creates dynamic support and resistance levels based on the wicks of candles at these points (or bodies if wicks are minimal). The indicator analyzes the volume at the time of a pivot’s formation, displaying its value and percentage change relative to the volume’s simple moving average (SMA).
It does not generate buy/sell signals but provides a clear visualization of market structure, helping traders identify potential price reaction zones and assess the strength of market movements.
Why Are Wicks Important?
Candle wicks at price pivots indicate significant market reactions in key areas. Depending on the context, they may signal rejection, testing, or absorption of a support or resistance level. Long wicks often appear where large players are active, and the marked zones are frequently retested. The indicator allows for quick identification and observation of their impact on future price action.
Why Use It?
- Precise Support and Resistance Levels: The indicator draws price channels based on candle wicks at pivots (or bodies if wicks are absent), enabling better identification of zones where price may react.
- Volume Analysis: It shows how the volume at a pivot differs from the average, indicating potential activity by large players or key market moments.
- Visual Clarity: Colored lines, channel fills, and clear labels facilitate quick chart analysis, even on short timeframes.
- Flexibility: Adjustable pivot length, volume average, and label colors allow customization to various trading strategies.
How It Works
- Pivot Detection: Automatically identifies local highs and lows based on the “Pivot Length” parameter (default: 20 candles). This means a pivot appears on the chart with a 20-candle delay. Reducing this value allows faster pivot detection (after fewer candles), increasing their number but potentially generating more noise.
- Channel Creation: Draws support and resistance levels based on the wicks of candles at pivot points (or bodies if wicks are minimal) with a delay to confirm zones. A pivot channel is drawn until the next pivot is identified, but if not previously broken, it remains valid as active support or resistance.
- Volume Analysis: Displays the volume at the pivot’s formation and its percentage change relative to the volume’s SMA.
- Visualization: Pivot and channel levels are shown as lines with fills, and labels display volume and its deviation from the average.
Trading Applications
- Swing Trading: Use pivot levels and channels to identify price reversal points or consolidation zones.
- Scalping: Monitor price reactions to channels on short timeframes, especially with high volume.
- Faster Pivot Identification: Switch to a lower timeframe (e.g., from H1 to M15) to identify pivots more quickly, allowing earlier reactions to price changes.
- Market Context Analysis: High volume at pivots may indicate significant levels likely to be retested.
- Combining with Other Tools: The indicator pairs well with Fibonacci retracement, supply/demand zones, or oscillators like RSI.
Settings and Customization
- Pivot Length: Determines how many candles back and forward are analyzed to detect pivots (default: 20). A smaller value increases sensitivity, a larger one enhances stability.
- Volume Average: Length of the SMA for volume (default: 20). Adjust to better reflect market characteristics.
- Label Colors: Choose colors for bullish and bearish pivot labels to match your chart style.
Usage Examples
- Identifying Key Zones: If the price approaches a pivot level with high volume (e.g., +50% relative to SMA), it may signal strong support or resistance.
- Breakout Confirmation: A channel breakout with high volume can indicate trend continuation.
- Price Reaction Analysis: Long wicks at pivots with high volume may signal level rejection by large players.
Notes for Users
- The indicator performs best on highly liquid markets (e.g., Forex, indices, cryptocurrencies).
- On short timeframes (e.g., M1, M5), it may generate more noise—adjust “Pivot Length” to suit your needs.
- Consider combining with other indicators to confirm signals derived from pivot and volume analysis.

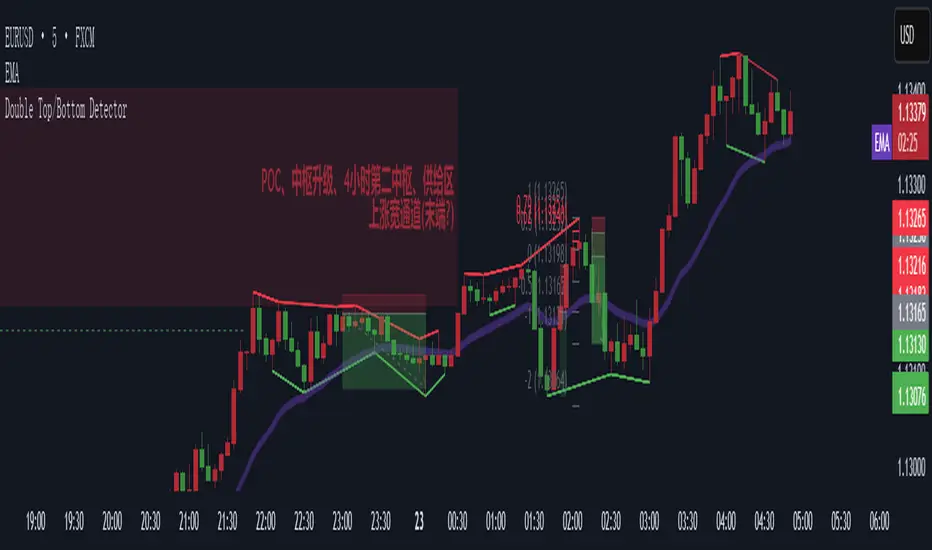
Double Top/Bottom DetectorDouble Top/Bottom Detector Indicator Description
Overview
The Double Top/Bottom Detector is a technical analysis tool designed to automatically identify and label potential double top and double bottom patterns on price charts. By combining pivot point detection with configurable height tolerance and pullback depth criteria, this indicator helps traders visually spot possible trend reversal zones without manual drawing or guesswork.
Key Features
• Pivot Point Identification
The indicator uses a symmetric window approach to find true highs and lows. A pivot high is confirmed only when a bar’s high exceeds the highs of a specified number of bars both before and after it. Likewise, a pivot low is established when a bar’s low is the lowest in its surrounding window.
• Double Top and Double Bottom Detection
– Height Tolerance: Ensures that the two pivot points forming the pattern are within a user-defined percentage of each other.
– Pullback Depth: Measures the drop (for a double top) or the rise (for a double bottom) between the two pivot points and confirms that it meets a minimum percentage threshold.
• Automatic Drawing and Labeling
When a valid double top is detected, a red line connects the two pivot highs and a “Double Top” label is centered above the line. For a double bottom, a green line connects the two pivot lows and a “Double Bottom” label appears below the midpoint.
• Pivot Visualization for Debugging
Small red and green triangles mark every detected pivot high and pivot low on the chart, making it easy to verify and fine-tune settings.
Parameters
Height Tolerance (%) – The maximum allowable percentage difference between the two pivot heights (default 2.0).
Pullback Minimum (%) – The minimum required percentage pullback (for tops) or rebound (for bottoms) between the two pivots (default 5.0).
Pivot Lookback – The number of bars to look back and forward for validating pivot points (default 5).
Window Length – The number of bars over which to compute pullback extrema, equal to twice the pivot lookback plus one (default derived from pivot lookback).
Usage Instructions
1. Copy the Pine Script code into TradingView’s editor and select version 6.
2. Adjust the parameters based on the asset’s volatility and timeframe. A larger lookback window yields fewer but more reliable pivots; tighter height tolerance produces more precise pattern matches.
3. Observe the chart for red and green triangles marking pivot highs and lows. When two qualifying pivots occur, the indicator draws a connecting line and displays a descriptive label.
4. To extend the number of visible historical lines and labels, increase the max\_lines\_count and max\_labels\_count settings in the indicator declaration.
Customization Ideas
• Add volume or moving average filters to reduce false signals.
• Encapsulate pivot logic into reusable functions for cleaner code.
• Incorporate alert conditions to receive notifications when new double top or bottom patterns form.
This indicator is well suited for medium- to long-term analysis and can be combined with risk management rules to enhance decision making.
Bober XM v2.0# ₿ober XM v2.0 Trading Bot Documentation
**Developer's Note**: While our previous Bot 1.3.1 was removed due to guideline violations, this setback only fueled our determination to create something even better. Rising from this challenge, Bober XM 2.0 emerges not just as an update, but as a complete reimagining with multi-timeframe analysis, enhanced filters, and superior adaptability. This adversity pushed us to innovate further and deliver a strategy that's smarter, more agile, and more powerful than ever before. Challenges create opportunity - welcome to Cryptobeat's finest work yet.
## !!!!You need to tune it for your own pair and timeframe and retune it periodicaly!!!!!
## Overview
The ₿ober XM v2.0 is an advanced dual-channel trading bot with multi-timeframe analysis capabilities. It integrates multiple technical indicators, customizable risk management, and advanced order execution via webhook for automated trading. The bot's distinctive feature is its separate channel systems for long and short positions, allowing for asymmetric trade strategies that adapt to different market conditions across multiple timeframes.
### Key Features
- **Multi-Timeframe Analysis**: Analyze price data across multiple timeframes simultaneously
- **Dual Channel System**: Separate parameter sets for long and short positions
- **Advanced Entry Filters**: RSI, Volatility, Volume, Bollinger Bands, and KEMAD filters
- **Machine Learning Moving Average**: Adaptive prediction-based channels
- **Multiple Entry Strategies**: Breakout, Pullback, and Mean Reversion modes
- **Risk Management**: Customizable stop-loss, take-profit, and trailing stop settings
- **Webhook Integration**: Compatible with external trading bots and platforms
### Strategy Components
| Component | Description |
|---------|-------------|
| **Dual Channel Trading** | Uses either Keltner Channels or Machine Learning Moving Average (MLMA) with separate settings for long and short positions |
| **MLMA Implementation** | Machine learning algorithm that predicts future price movements and creates adaptive bands |
| **Pivot Point SuperTrend** | Trend identification and confirmation system based on pivot points |
| **Three Entry Strategies** | Choose between Breakout, Pullback, or Mean Reversion approaches |
| **Advanced Filter System** | Multiple customizable filters with multi-timeframe support to avoid false signals |
| **Custom Exit Logic** | Exits based on OBV crossover of its moving average combined with pivot trend changes |
### Note for Novice Users
This is a fully featured real trading bot and can be tweaked for any ticker — SOL is just an example. It follows this structure:
1. **Indicator** – gives the initial signal
2. **Entry strategy** – decides when to open a trade
3. **Exit strategy** – defines when to close it
4. **Trend confirmation** – ensures the trade follows the market direction
5. **Filters** – cuts out noise and avoids weak setups
6. **Risk management** – controls losses and protects your capital
To tune it for a different pair, you'll need to start from scratch:
1. Select the timeframe (candle size)
2. Turn off all filters and trend entry/exit confirmations
3. Choose a channel type, channel source and entry strategy
4. Adjust risk parameters
5. Tune long and short settings for the channel
6. Fine-tune the Pivot Point Supertrend and Main Exit condition OBV
This will generate a lot of signals and activity on the chart. Your next task is to find the right combination of filters and settings to reduce noise and tune it for profitability.
### Default Strategy values
Default values are tuned for: Symbol BITGET:SOLUSDT.P 5min candle
Filters are off by default: Try to play with it to understand how it works
## Configuration Guide
### General Settings
| Setting | Description | Default Value |
|---------|-------------|---------------|
| **Long Positions** | Enable or disable long trades | Enabled |
| **Short Positions** | Enable or disable short trades | Enabled |
| **Risk/Reward Area** | Visual display of stop-loss and take-profit zones | Enabled |
| **Long Entry Source** | Price data used for long entry signals | hl2 (High+Low/2) |
| **Short Entry Source** | Price data used for short entry signals | hl2 (High+Low/2) |
The bot allows you to trade long positions, short positions, or both simultaneously. Each direction has its own set of parameters, allowing for fine-tuned strategies that recognize the asymmetric nature of market movements.
### Multi-Timeframe Settings
1. **Enable Multi-Timeframe Analysis**: Toggle 'Enable Multi-Timeframe Analysis' in the Multi-Timeframe Settings section
2. **Configure Timeframes**: Set appropriate higher timeframes based on your trading style:
- Timeframe 1: Default is now 15 minutes (intraday confirmation)
- Timeframe 2: Default is 4 hours (trend direction)
3. **Select Sources per Indicator**: For each indicator (RSI, KEMAD, Volume, etc.), choose:
- The desired timeframe (current, mtf1, or mtf2)
- The appropriate price type (open, high, low, close, hl2, hlc3, ohlc4)
### Entry Strategies
- **Breakout**: Enter when price breaks above/below the channel
- **Pullback**: Enter when price pulls back to the channel
- **Mean Reversion**: Enter when price is extended from the channel
You can enable different strategies for long and short positions.
### Core Components
### Risk Management
- **Position Size**: Control risk with percentage-based position sizing
- **Stop Loss Options**:
- Fixed: Set a specific price or percentage from entry
- ATR-based: Dynamic stop-loss based on market volatility
- Swing: Uses recent swing high/low points
- **Take Profit**: Multiple targets with percentage allocation
- **Trailing Stop**: Dynamic stop that follows price movement
## Advanced Usage Strategies
### Moving Average Type Selection Guide
- **SMA**: More stable in choppy markets, good for higher timeframes
- **EMA/WMA**: More responsive to recent price changes, better for entry signals
- **VWMA**: Adds volume weighting for stronger trends, use with Volume filter
- **HMA**: Balance between responsiveness and noise reduction, good for volatile markets
### Multi-Timeframe Strategy Approaches
- **Trend Confirmation**: Use higher timeframe RSI (mtf2) for overall trend, current timeframe for entries
- **Entry Precision**: Use KEMAD on current timeframe with volume filter on mtf1
- **False Signal Reduction**: Apply RSI filter on mtf1 with strict KEMAD settings
### Market Condition Optimization
| Market Condition | Recommended Settings |
|------------------|----------------------|
| **Trending** | Use Breakout strategy with KEMAD filter on higher timeframe |
| **Ranging** | Use Mean Reversion with strict RSI filter (mtf1) |
| **Volatile** | Increase ATR multipliers, use HMA for moving averages |
| **Low Volatility** | Decrease noise parameters, use pullback strategy |
## Webhook Integration
The strategy features a professional webhook system that allows direct connectivity to your exchange or trading platform of choice through third-party services like 3commas, Alertatron, or Autoview.
The webhook payload includes all necessary parameters for automated execution:
- Entry price and direction
- Stop loss and take profit levels
- Position size
- Custom identifier for webhook routing
## Performance Optimization Tips
1. **Start with Defaults**: Begin with the default settings for your timeframe before customizing
2. **Adjust One Component at a Time**: Make incremental changes and test the impact
3. **Match MA Types to Market Conditions**: Use appropriate moving average types based on the Market Condition Optimization table
4. **Timeframe Synergy**: Create logical relationships between timeframes (e.g., 5min chart with 15min and 4h higher timeframes)
5. **Periodic Retuning**: Markets evolve - regularly review and adjust parameters
## Common Setups
### Crypto Trend-Following
- MLMA with EMA or HMA
- Higher RSI thresholds (75/25)
- KEMAD filter on mtf1
- Breakout entry strategy
### Stock Swing Trading
- MLMA with SMA for stability
- Volume filter with higher threshold
- KEMAD with increased filter order
- Pullback entry strategy
### Forex Scalping
- MLMA with WMA and lower noise parameter
- RSI filter on current timeframe
- Use highest timeframe for trend direction only
- Mean Reversion strategy
## Webhook Configuration
- **Benefits**:
- Automated trade execution without manual intervention
- Immediate response to market conditions
- Consistent execution of your strategy
- **Implementation Notes**:
- Requires proper webhook configuration on your exchange or platform
- Test thoroughly with small position sizes before full deployment
- Consider latency between signal generation and execution
### Backtesting Period
Define a specific historical period to evaluate the bot's performance:
| Setting | Description | Default Value |
|---------|-------------|---------------|
| **Start Date** | Beginning of backtest period | January 1, 2025 |
| **End Date** | End of backtest period | December 31, 2026 |
- **Best Practice**: Test across different market conditions (bull markets, bear markets, sideways markets)
- **Limitation**: Past performance doesn't guarantee future results
## Entry and Exit Strategies
### Dual-Channel System
A key innovation of the Bober XM is its dual-channel approach:
- **Independent Parameters**: Each trade direction has its own channel settings
- **Asymmetric Trading**: Recognizes that markets often behave differently in uptrends versus downtrends
- **Optimized Performance**: Fine-tune settings for both bullish and bearish conditions
This approach allows the bot to adapt to the natural asymmetry of markets, where uptrends often develop gradually while downtrends can be sharp and sudden.
### Channel Types
#### 1. Keltner Channels
Traditional volatility-based channels using EMA and ATR:
| Setting | Long Default | Short Default |
|---------|--------------|---------------|
| **EMA Length** | 37 | 20 |
| **ATR Length** | 13 | 17 |
| **Multiplier** | 1.4 | 1.9 |
| **Source** | low | high |
- **Strengths**:
- Reliable in trending markets
- Less prone to whipsaws than Bollinger Bands
- Clear visual representation of volatility
- **Weaknesses**:
- Can lag during rapid market changes
- Less effective in choppy, non-trending markets
#### 2. Machine Learning Moving Average (MLMA)
Advanced predictive model using kernel regression (RBF kernel):
| Setting | Description | Options |
|---------|-------------|--------|
| **Source MA** | Price data used for MA calculations | Any price source (low/high/close/etc.) |
| **Moving Average Type** | Type of MA algorithm for calculations | SMA, EMA, WMA, VWMA, RMA, HMA |
| **Trend Source** | Price data used for trend determination | Any price source (close default) |
| **Window Size** | Historical window for MLMA calculations | 5+ (default: 16) |
| **Forecast Length** | Number of bars to forecast ahead | 1+ (default: 3) |
| **Noise Parameter** | Controls smoothness of prediction | 0.01+ (default: ~0.43) |
| **Band Multiplier** | Multiplier for channel width | 0.1+ (default: 0.5-0.6) |
- **Strengths**:
- Predictive rather than reactive
- Adapts quickly to changing market conditions
- Better at identifying trend reversals early
- **Weaknesses**:
- More computationally intensive
- Requires careful parameter tuning
- Can be sensitive to input data quality
### Entry Strategies
| Strategy | Description | Ideal Market Conditions |
|----------|-------------|-------------------------|
| **Breakout** | Enters when price breaks through channel bands, indicating strong momentum | High volatility, emerging trends |
| **Pullback** | Enters when price retraces to the middle band after testing extremes | Established trends with regular pullbacks |
| **Mean Reversion** | Enters at channel extremes, betting on a return to the mean | Range-bound or oscillating markets |
#### Breakout Strategy (Default)
- **Implementation**: Enters long when price crosses above the upper band, short when price crosses below the lower band
- **Strengths**: Captures strong momentum moves, performs well in trending markets
- **Weaknesses**: Can lead to late entries, higher risk of false breakouts
- **Optimization Tips**:
- Increase channel multiplier for fewer but more reliable signals
- Combine with volume confirmation for better accuracy
#### Pullback Strategy
- **Implementation**: Enters long when price pulls back to middle band during uptrend, short during downtrend pullbacks
- **Strengths**: Better entry prices, lower risk, higher probability setups
- **Weaknesses**: Misses some strong moves, requires clear trend identification
- **Optimization Tips**:
- Use with trend filters to confirm overall direction
- Adjust middle band calculation for market volatility
#### Mean Reversion Strategy
- **Implementation**: Enters long at lower band, short at upper band, expecting price to revert to the mean
- **Strengths**: Excellent entry prices, works well in ranging markets
- **Weaknesses**: Dangerous in strong trends, can lead to fighting the trend
- **Optimization Tips**:
- Implement strong trend filters to avoid counter-trend trades
- Use smaller position sizes due to higher risk nature
### Confirmation Indicators
#### Pivot Point SuperTrend
Combines pivot points with ATR-based SuperTrend for trend confirmation:
| Setting | Default Value |
|---------|---------------|
| **Pivot Period** | 25 |
| **ATR Factor** | 2.2 |
| **ATR Period** | 41 |
- **Function**: Identifies significant market turning points and confirms trend direction
- **Implementation**: Requires price to respect the SuperTrend line for trade confirmation
#### Weighted Moving Average (WMA)
Provides additional confirmation layer for entries:
| Setting | Default Value |
|---------|---------------|
| **Period** | 15 |
| **Source** | ohlc4 (average of Open, High, Low, Close) |
- **Function**: Confirms trend direction and filters out low-quality signals
- **Implementation**: Price must be above WMA for longs, below for shorts
### Exit Strategies
#### On-Balance Volume (OBV) Based Exits
Uses volume flow to identify potential reversals:
| Setting | Default Value |
|---------|---------------|
| **Source** | ohlc4 |
| **MA Type** | HMA (Options: SMA, EMA, WMA, RMA, VWMA, HMA) |
| **Period** | 22 |
- **Function**: Identifies divergences between price and volume to exit before reversals
- **Implementation**: Exits when OBV crosses its moving average in the opposite direction
- **Customizable MA Type**: Different MA types provide varying sensitivity to OBV changes:
- **SMA**: Traditional simple average, equal weight to all periods
- **EMA**: More weight to recent data, responds faster to price changes
- **WMA**: Weighted by recency, smoother than EMA
- **RMA**: Similar to EMA but smoother, reduces noise
- **VWMA**: Factors in volume, helpful for OBV confirmation
- **HMA**: Reduces lag while maintaining smoothness (default)
#### ADX Exit Confirmation
Uses Average Directional Index to confirm trend exhaustion:
| Setting | Default Value |
|---------|---------------|
| **ADX Threshold** | 35 |
| **ADX Smoothing** | 60 |
| **DI Length** | 60 |
- **Function**: Confirms trend weakness before exiting positions
- **Implementation**: Requires ADX to drop below threshold or DI lines to cross
## Filter System
### RSI Filter
- **Function**: Controls entries based on momentum conditions
- **Parameters**:
- Period: 15 (default)
- Overbought level: 71
- Oversold level: 23
- Multi-timeframe support: Current, MTF1 (15min), or MTF2 (4h)
- Customizable price source (open, high, low, close, hl2, hlc3, ohlc4)
- **Implementation**: Blocks long entries when RSI > overbought, short entries when RSI < oversold
### Volatility Filter
- **Function**: Prevents trading during excessive market volatility
- **Parameters**:
- Measure: ATR (Average True Range)
- Period: Customizable (default varies by timeframe)
- Threshold: Adjustable multiplier
- Multi-timeframe support
- Customizable price source
- **Implementation**: Blocks trades when current volatility exceeds threshold × average volatility
### Volume Filter
- **Function**: Ensures adequate market liquidity for trades
- **Parameters**:
- Threshold: 0.4× average (default)
- Measurement period: 5 (default)
- Moving average type: Customizable (HMA default)
- Multi-timeframe support
- Customizable price source
- **Implementation**: Requires current volume to exceed threshold × average volume
### Bollinger Bands Filter
- **Function**: Controls entries based on price relative to statistical boundaries
- **Parameters**:
- Period: Customizable
- Standard deviation multiplier: Adjustable
- Moving average type: Customizable
- Multi-timeframe support
- Customizable price source
- **Implementation**: Can require price to be within bands or breaking out of bands depending on strategy
### KEMAD Filter (Kalman EMA Distance)
- **Function**: Advanced trend confirmation using Kalman filter algorithm
- **Parameters**:
- Process Noise: 0.35 (controls smoothness)
- Measurement Noise: 24 (controls reactivity)
- Filter Order: 6 (higher = more smoothing)
- ATR Length: 8 (for bandwidth calculation)
- Upper Multiplier: 2.0 (for long signals)
- Lower Multiplier: 2.7 (for short signals)
- Multi-timeframe support
- Customizable visual indicators
- **Implementation**: Generates signals based on price position relative to Kalman-filtered EMA bands
## Risk Management System
### Position Sizing
Automatically calculates position size based on account equity and risk parameters:
| Setting | Default Value |
|---------|---------------|
| **Risk % of Equity** | 50% |
- **Implementation**:
- Position size = (Account equity × Risk %) ÷ (Entry price × Stop loss distance)
- Adjusts automatically based on volatility and stop placement
- **Best Practices**:
- Start with lower risk percentages (1-2%) until strategy is proven
- Consider reducing risk during high volatility periods
### Stop-Loss Methods
Multiple stop-loss calculation methods with separate configurations for long and short positions:
| Method | Description | Configuration |
|--------|-------------|---------------|
| **ATR-Based** | Dynamic stops based on volatility | ATR Period: 14, Multiplier: 2.0 |
| **Percentage** | Fixed percentage from entry | Long: 1.5%, Short: 1.5% |
| **PIP-Based** | Fixed currency unit distance | 10.0 pips |
- **Implementation Notes**:
- ATR-based stops adapt to changing market volatility
- Percentage stops maintain consistent risk exposure
- PIP-based stops provide precise control in stable markets
### Trailing Stops
Locks in profits by adjusting stop-loss levels as price moves favorably:
| Setting | Default Value |
|---------|---------------|
| **Stop-Loss %** | 1.5% |
| **Activation Threshold** | 2.1% |
| **Trailing Distance** | 1.4% |
- **Implementation**:
- Initial stop remains fixed until profit reaches activation threshold
- Once activated, stop follows price at specified distance
- Locks in profit while allowing room for normal price fluctuations
### Risk-Reward Parameters
Defines the relationship between risk and potential reward:
| Setting | Default Value |
|---------|---------------|
| **Risk-Reward Ratio** | 1.4 |
| **Take Profit %** | 2.4% |
| **Stop-Loss %** | 1.5% |
- **Implementation**:
- Take profit distance = Stop loss distance × Risk-reward ratio
- Higher ratios require fewer winning trades for profitability
- Lower ratios increase win rate but reduce average profit
### Filter Combinations
The strategy allows for simultaneous application of multiple filters:
- **Recommended Combinations**:
- Trending markets: RSI + KEMAD filters
- Ranging markets: Bollinger Bands + Volatility filters
- All markets: Volume filter as minimum requirement
- **Performance Impact**:
- Each additional filter reduces the number of trades
- Quality of remaining trades typically improves
- Optimal combination depends on market conditions and timeframe
### Multi-Timeframe Filter Applications
| Filter Type | Current Timeframe | MTF1 (15min) | MTF2 (4h) |
|-------------|-------------------|-------------|------------|
| RSI | Quick entries/exits | Intraday trend | Overall trend |
| Volume | Immediate liquidity | Sustained support | Market participation |
| Volatility | Entry timing | Short-term risk | Regime changes |
| KEMAD | Precise signals | Trend confirmation | Major reversals |
## Visual Indicators and Chart Analysis
The bot provides comprehensive visual feedback on the chart:
- **Channel Bands**: Keltner or MLMA bands showing potential support/resistance
- **Pivot SuperTrend**: Colored line showing trend direction and potential reversal points
- **Entry/Exit Markers**: Annotations showing actual trade entries and exits
- **Risk/Reward Zones**: Visual representation of stop-loss and take-profit levels
These visual elements allow for:
- Real-time strategy assessment
- Post-trade analysis and optimization
- Educational understanding of the strategy logic
## Implementation Guide
### TradingView Setup
1. Load the script in TradingView Pine Editor
2. Apply to your preferred chart and timeframe
3. Adjust parameters based on your trading preferences
4. Enable alerts for webhook integration
### Webhook Integration
1. Configure webhook URL in TradingView alerts
2. Set up receiving endpoint on your trading platform
3. Define message format matching the bot's output
4. Test with small position sizes before full deployment
### Optimization Process
1. Backtest across different market conditions
2. Identify parameter sensitivity through multiple tests
3. Focus on risk management parameters first
4. Fine-tune entry/exit conditions based on performance metrics
5. Validate with out-of-sample testing
## Performance Considerations
### Strengths
- Adaptability to different market conditions through dual channels
- Multiple layers of confirmation reducing false signals
- Comprehensive risk management protecting capital
- Machine learning integration for predictive edge
### Limitations
- Complex parameter set requiring careful optimization
- Potential over-optimization risk with so many variables
- Computational intensity of MLMA calculations
- Dependency on proper webhook configuration for execution
### Best Practices
- Start with conservative risk settings (1-2% of equity)
- Test thoroughly in demo environment before live trading
- Monitor performance regularly and adjust parameters
- Consider market regime changes when evaluating results
## Conclusion
The ₿ober XM v2.0 represents a significant evolution in trading strategy design, combining traditional technical analysis with machine learning elements and multi-timeframe analysis. The core strength of this system lies in its adaptability and recognition of market asymmetry.
### Market Asymmetry and Adaptive Approach
The strategy acknowledges a fundamental truth about markets: bullish and bearish phases behave differently and should be treated as distinct environments. The dual-channel system with separate parameters for long and short positions directly addresses this asymmetry, allowing for optimized performance regardless of market direction.
### Targeted Backtesting Philosophy
It's counterproductive to run backtests over excessively long periods. Markets evolve continuously, and strategies that worked in previous market regimes may be ineffective in current conditions. Instead:
- Test specific market phases separately (bull markets, bear markets, range-bound periods)
- Regularly re-optimize parameters as market conditions change
- Focus on recent performance with higher weight than historical results
- Test across multiple timeframes to ensure robustness
### Multi-Timeframe Analysis as a Game-Changer
The integration of multi-timeframe analysis fundamentally transforms the strategy's effectiveness:
- **Increased Safety**: Higher timeframe confirmations reduce false signals and improve trade quality
- **Context Awareness**: Decisions made with awareness of larger trends reduce adverse entries
- **Adaptable Precision**: Apply strict filters on lower timeframes while maintaining awareness of broader conditions
- **Reduced Noise**: Higher timeframe data naturally filters market noise that can trigger poor entries
The ₿ober XM v2.0 provides traders with a framework that acknowledges market complexity while offering practical tools to navigate it. With proper setup, realistic expectations, and attention to changing market conditions, it delivers a sophisticated approach to systematic trading that can be continuously refined and optimized.

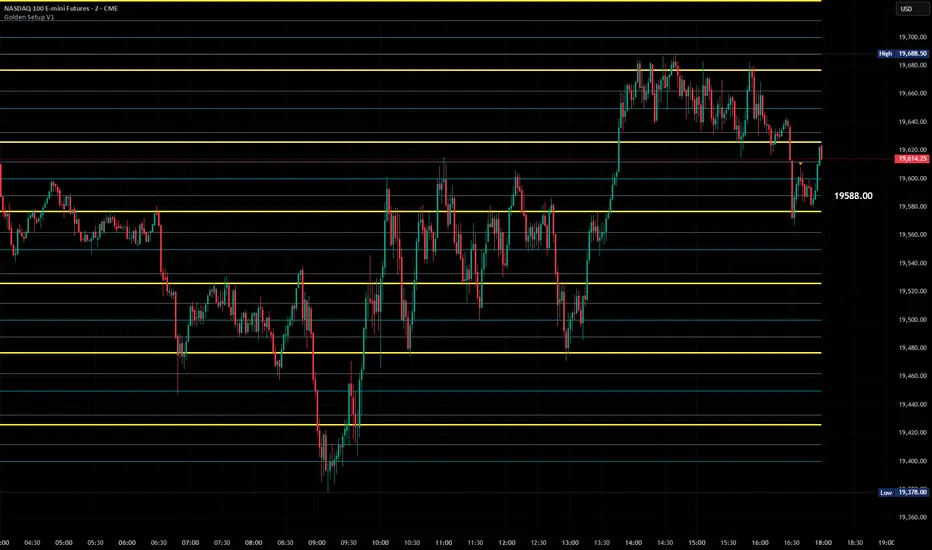
Golden Setup V1Golden Setup V1 is an overlay indicator that automates Tony Rago’s “Golden Setup” price-level framework. It divides the chart into fixed “blockSize” intervals (default 100 points) and plots a series of key horizontal levels within each block—levels at 00, 12, 26, 33, 50, 62, 77 and 88 offsets. These levels act as dynamic support and resistance grids that roll up or down as price moves between blocks.
Key Features
Customizable Offsets
Define eight offset levels corresponding to Rago’s Golden Setup:
00 (Round Number)
12 (Target 12)
26 (First “Golden” level)
33 (Target 33)
50 (Mid-block pivot)
62 (Target 62)
77 (Second “Golden” level)
88 (Target 88)
Multi-Block Coverage
Choose how many blocks above and below the current 100-point block you wish to display, so you always have levels drawn for the surrounding price range.
Golden-Only Filter
A handy toggle lets you show only the two “Golden” offsets (26 & 77), which many traders prioritize for high-probability bounce or breakout areas.
Dynamic Nearest-Level Label
Highlights the closest Golden Setup level (to the right edge of the chart) with a movable label, so you always know which level price is approaching.
Full Styling Control
Customize line colors, widths, block size, label fonts and opacity to suit your charting style.
How It Works
Block Calculation
On each bar, the indicator computes the “current block” by flooring (close / blockSize) and multiplying back by blockSize.
Level Offsets
It adds each of the eight user-defined offsets to that block base (and, if price has moved below the lowest offset, shifts the block down one interval).
Drawing
Each level is drawn as a horizontal line extending across the chart for as many blocks above/below as you select.
Nearest-Level Detection
Within the present block, it calculates which of the plotted levels is closest to price and displays that value on the right edge.
Usage Tips
Use the Golden-Only filter to declutter and focus solely on the 26 & 77 levels, which often act as strong intra-block pivot points.
Combine with volume or momentum indicators to confirm bounces at these levels.
Adjust blockSize (e.g. 50 or 200) if you wish to work in smaller or larger price increments.
⚠️ Disclaimer: This script is for educational and illustrative purposes only. Trading involves risk—always back-test and validate any strategy on a demo account before going live.
ICT Swiftedge# ICT SwiftEdge: Advanced Market Structure Trading System
**Overview**
ICT SwiftEdge is a powerful trading system built upon the foundation of ICTProTools' ICT Breakers, licensed under the Mozilla Public License 2.0 (mozilla.org). This script has been significantly enhanced by to combine market structure analysis with modern technical indicators and a sleek, AI-inspired statistics dashboard. The goal is to provide traders with a comprehensive tool for identifying high-probability trade setups, managing exits, and tracking performance in a visually intuitive way.
**Credits**
This script is a derivative work based on the original "ICT Breakers" by ICTProTools, used with permission under the Mozilla Public License 2.0. Significant enhancements, including RSI-MA signals, trend filtering, dynamic timeframe adjustments, dual exit strategies, and an AI-style statistics dashboard, were developed by . We express our gratitude to ICTProTools for their foundational work in market structure analysis.
**What It Does**
ICT SwiftEdge integrates multiple trading concepts to help traders identify and manage trades based on market structure and momentum:
- **Market Structure Analysis**: Identifies Break of Structure (BOS) and Market Structure Shift (MSS) patterns, which signal potential trend continuations or reversals. BOS indicates a continuation of the current trend, while MSS highlights a shift in market direction, providing key entry points.
- **RSI-MA Signals**: Generates "BUY" and "SELL" signals when BOS or MSS patterns align with the Relative Strength Index (RSI) smoothed by a Moving Average (RSI-MA). Signals are filtered to occur only when RSI-MA is above 50 (for buys) or below 50 (for sells), ensuring momentum supports the trade direction.
- **Trend Filtering**: Prevents multiple signals in the same trend, ensuring only one buy or sell signal per trend direction, reducing noise and improving trade clarity.
- **Dynamic Timeframe Adjustment**: Automatically adjusts pivot points, RSI, and MA parameters based on the selected chart timeframe (1M to 1D), optimizing performance across different market conditions.
- **Flexible Exit Strategies**: Offers two user-selectable exit methods:
- **Trailing Stop-Loss (TSL)**: Exits trades when price moves against the position by a user-defined distance (in points), locking in profits or limiting losses.
- **RSI-MA Exit**: Exits trades when RSI-MA crosses the 50 level, signaling a potential loss of momentum.
- Users can enable either or both strategies, providing flexibility to adapt to different trading styles.
- **AI-Style Statistics Dashboard**: Displays real-time trade performance metrics in a futuristic, neon-colored interface, including total trades, wins, losses, win/loss ratio, and win percentage. This helps traders evaluate the system's effectiveness without external tools.
**Why This Combination?**
The integration of these components creates a synergistic trading system:
- **BOS/MSS and RSI-MA**: Combining market structure breaks with RSI-MA ensures entries are based on both price action (structure) and momentum (RSI-MA), increasing the likelihood of high-probability trades.
- **Trend Filtering**: By limiting signals to one per trend, the system avoids overtrading and focuses on significant market moves.
- **Dynamic Adjustments**: Timeframe-specific parameters make the system versatile, suitable for scalping (1M, 5M) or swing trading (4H, 1D).
- **Dual Exit Strategies**: TSL protects profits during trending markets, while RSI-MA exits are ideal for range-bound or reversing markets, catering to diverse market conditions.
- **Statistics Dashboard**: Provides immediate feedback on trade performance, enabling data-driven decision-making without manual tracking.
This combination balances technical precision with user-friendly visuals, making it accessible to both novice and experienced traders.
**How to Use**
1. **Add to Chart**: Apply the script to any TradingView chart.
2. **Configure Settings**:
- **Chart Timeframe**: Select your chart's timeframe (1M to 1D) to optimize parameters.
- **Structure Timeframe**: Choose a timeframe for market structure analysis (leave blank for chart timeframe).
- **Exit Strategy**: Enable Trailing Stop-Loss (`useTslExit`), RSI-MA Exit (`useRsiMaExit`), or both. Adjust `tslPoints` for TSL distance.
- **Show Signals/Labels**: Toggle `showSignals` and `showExit` to display "BUY", "SELL", and "EXIT" labels.
- **Dashboard**: Enable `showDashboard` to view trade statistics. Customize colors with `dashboardBgColor` and `dashboardTextColor`.
3. **Trading**:
- Look for "BUY" or "SELL" labels to enter trades when BOS/MSS aligns with RSI-MA.
- Exit trades at "EXIT" labels based on your chosen strategy.
- Monitor the statistics dashboard to track performance (total trades, win/loss ratio, win percentage).
4. **Alerts**: Set up alerts for BOS, MSS, buy, sell, or exit signals using the provided alert conditions.
**License**
This script is licensed under the Mozilla Public License 2.0 (mozilla.org). The source code is available for review and modification under the terms of this license.
**Compliance with TradingView House Rules**
This publication adheres to TradingView's House Rules and Scripts Publication Rules. It provides a clear, self-contained description of the script's functionality, credits the original author (ICTProTools), and explains the rationale for combining indicators. The script contains no promotional content, offensive language, or proprietary restrictions beyond MPL 2.0.
**Note**
Trading involves risk, and past performance is not indicative of future results. Always backtest and validate the system on your preferred markets and timeframes before live trading.
Enjoy trading with ICT SwiftEdge, and let data-driven insights guide your decisions!

Price Action Toolkit Lite [UAlgo]The Price Action Toolkit Lite is a comprehensive indicator designed to enhance your chart analysis with advanced price action tools. This powerful toolkit combines multiple technical analysis concepts to provide traders with a clear visualization of market structure, liquidity levels, order blocks, and trend lines. By integrating these elements, the indicator aims to offer a holistic view of price action, helping traders identify potential entry and exit points, as well as key levels of interest in the market.
🔶 Key Features
Market Structure Analysis: The indicator includes a ZigZag feature to highlight significant market highs and lows, aiding in the visualization of market structure changes and trends.
Liquidity Sweeps Detection: It identifies and displays liquidity sweeps, which are crucial for recognizing potential market reversals and areas of interest where significant price action is likely to occur.
Order Blocks: Automatically detects and draws order blocks, highlighting areas of institutional buying and selling pressure, which can serve as key support and resistance levels.
Trend Lines: The toolkit can draw and extend trend lines based on pivot points, providing a clear view of prevailing market trends and potential breakout points.
Customizable Settings: Users can adjust various settings, including the length of the ZigZag, liquidity detection sensitivity, the number of order blocks to display, and trend line detection parameters, allowing for a tailored analysis experience.
🔶 Disclaimer
The "Price Action Toolkit Lite " is intended for educational and informational purposes only.
It is not financial advice and should not be construed as such. Trading in financial markets involves substantial risk, including the risk of loss.
Past performance is not indicative of future results.
🔷 Similar Scripts

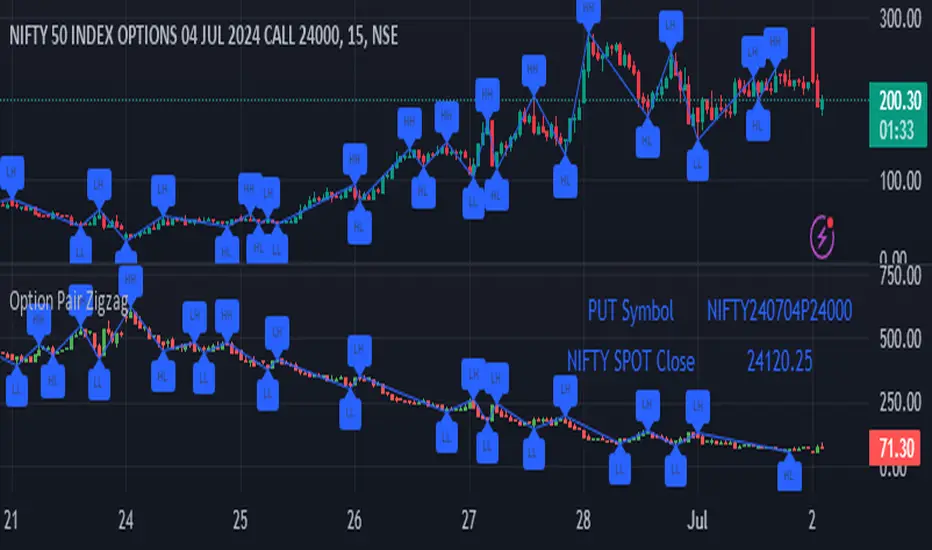
Option Pair ZigzagOptions Pair Zigzag:
Though we can split the chart window and view multiple charts, this indicator is useful when we view options charts.
How this indicator works:
The indicator works in non-overlay mode.
The indicator will find other option pair symbol and load it’s chart in indicator window. It will also draw a zigzag on both the charts. It will also fetch the SPOT symbol and display SPOT Close price of latest candle.
Useful information:
A. Support resistance: Higher High (HH) and Lower Low (LL) markings can be treated as strong support and or resistance and LH, HL markings can be treated as weak support and or resistance.
B. Trend identification: Easy identification of trend based on trend lines and trend markings i.e. Higher High (HH), Lower Low (LL), Lower High (LH), Higher Low (HL)
C. Use of Rate of change (ROC )– Labels drawn on swing points are equipped with ROC% between swing points. ROC% between Call and Put option charts can be compared and used to identify strong and weak moves.
Example:
1. User loads a call option chart of ‘NIFTY240620C23500’ (NIFTY 50 INDEX OPTIONS 20 JUN 2024 CALL 23500)
2. Since user has selected CALL Option, Indicator rules/logic will find PUT Option symbol of same strike and expiry
3. PUT Option chart would then shown in the indicator window
4. Draw zigzag on both the charts
5. Plot labels on both the charts
6. Labels are equipped with a tooltip showing rate of change between 2 pivot points
Input Parameters:
Left bars – Parameter required for plotting zigzag
Right bars – Parameter required for plotting zigzag
Plot HHLL Labels – Enable/disable plotting of labels
Use cases:
Refer to chart snapshots:
1. Buy Call Option or Sell Put Option - How one can trade on formation of a consolidation range
2. Breakdown of Swing structure - One can observe Swing structure (Zigzag) formed on a SPOT chart and trade on break of swing structure
3. Triangle formation - Observe the patterns formed on the SPOT chart and trade either Call or Put options. Example snapshot shows trade based on triangle pattern
Chart Snapshot:
One can split chart window and load base symbol chart which will help to review bases symbol and options chart at the same time.
Buy Call Option or Sell Put Option
Breakdown of Swing structure
Triangle formation
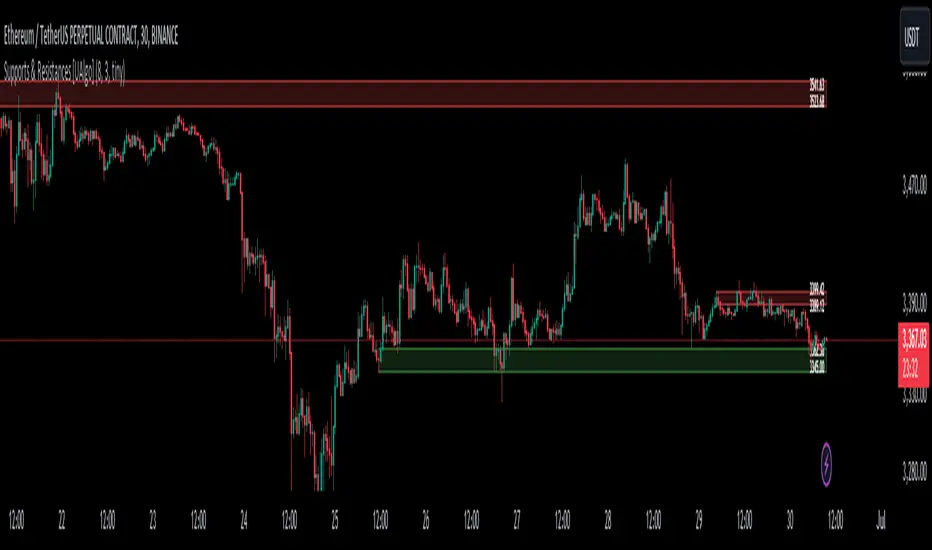
Supports & Resistances [UAlgo]The "Supports & Resistances " indicator is designed to identify and visualize key support and resistance levels on the price chart. It utilizes the Average True Range (ATR) and Pivot Points to define the boundaries of S & R zones and considers historical price action to assess the strength of these zones.
🔶 How to Obtain Zones
The script continuously analyzes the price action and identifies potential support and resistance zones based on the following criteria:
Zone Creation: For swing highs, a zone is created with the high price at the zone length as the top and the top minus the Average True Range (ATR) as the bottom. Conversely, for swing lows, the zone is created with the low price at the zone length as the bottom and the low plus the ATR as the top.
Zone Strength Calculation: The script iterates through historical bars within the zone and counts how many times the price (low for support, high for resistance) touched but failed to break entirely through the zone. This count is assigned as the zone's "strength".
Zone Display and Removal: It identifying zones by assigning a "strength" value based on how many times the price has approached but failed to break the zone. This helps prioritize stronger potential support/resistance levels. Only zones exceeding the defined "strength threshold" are visually displayed on the chart. Weaker zones or those broken by price are automatically removed.
🔶 Parameters
Zone Length: Traders can adjust S & R detection sensitivity, length to be used to find pivot points.
Strength Threshold: Set the minimum number of times the price needs to touch but fail to break a zone for it to be considered "strong" and displayed.
Visual Settings: Tailor the appearance of the support/resistance zones by defining separate colors and text size for borders, backgrounds, and zone text.
🔶 Disclaimer
The "Supports & Resistances " indicator is provided for educational and informational purposes only.
It should not be considered as financial advice or a recommendation to buy or sell any financial instrument.
The use of this indicator involves inherent risks, and users should employ their own judgment and conduct their own research before making any trading decisions. Past performance is not indicative of future results.
🔷 Related Scripts
Support and Resistance with Signals
ATR Based Support and Resistance Zones
Hindsight TrendNon-realtime but highly accurate trend analyzer with only one fundamental parameter ( period aka "minimum trend length")
Basically Hindsight Trend is pivot points on steroids (handles many cases much better). Plus it shows the trend line.
Period
I usually like periods of 10, 20 or 30.
The indicator's delay is identical to the chosen period.
You can actually try a low period like 4 or 5 to get something resembling a realtime indicator.
Uptrends are based on candle lows, downtrends are based on candle highs. So it is possible to have an uptrend and a downtrend at the same time.
Triangles
At trend start, a triangle is drawn. (Trendline isn't always there if the trend didn't last that long.)
Triangle size shows how long the high or low that started the trend remained unbroken. E.g. with period 20: Small triangle = 20+ candles, medium triangle = 40+ candles, big triangle = 80+ candles. So a big triangle marks an important reversal point.
How Hindsight Trend works
Whenever a candle completes, its high and low are saved as potentially "notable" points. A high or low is the more notable the longer it stays unbroken (= not touched again by price).
Now we simply take the notable highs and lows (as in, staying unbroken at least for the user-selected period)... and connect them together - if they are close enough to each other (less than "period" candles away). And decorate the first point in each trend with a triangle.
We only know whether a point is notable after "period" more candles have printed, so that's where the indicator's delay comes from.
Finally we divide the period by 2 and look at highs and lows which are unbroken for that shorter time. While they are not fully "notable" as defined above, we'll call them "semi-notable". Those points are only considered at the end of a trend, and help us extend the trend line a bit further.

Re-Anchoring Fibo LevelsThe " Re-Anchoring Fibo Levels " offers a dynamic and systematic approach on how to use Fibonacci retracements. The resistance levels are based on the all-time high and the subsequent lowest low. The support levels are based on the lowest low after the all-time high and the following highest high. This method provides traders with automatically updated support and resistance levels based on current significant pivot points.
How It Works
Resistance Levels: The levels are calculated based on the current all-time high and the following lowest low. This range is multiplied with the defined Fibonacci ratios and the levels are plotted.
Support Levels: The support levels are calculated based on the lowest low and highest high after and below the current all-time high. The range between those to pivot points is multiplied with the defined Fibonacci ratios and the levels are plotted.
How To Use
By comparing current prices to dynamically adjusted Fibonacci levels, traders can gain insights into the strength and potential direction of market trends and are also presented with potentially significant levels that can function either as resistance or support.

ZWAP (ZigZag Anchored VWAP) [Kioseff Trading]Hello!
Quick script showcasing the new polyline function for Pine Script!
Features
Up to 100 high/low pivot points auto anchored VWAP
Visible range auto anchored VWAP
Curved ZigZag (Adjustable!)
With the new polyline function, auto-anchored VWAP at specific price points is more viable.
When using line.new() only 500 lines can exist on the chart concurrently and, since VWAP is calculated on every update, a "proper" VWAP drawn using line.new() can extend 500 bars at most, to which no additional VWAP lines can be drawn after.
Of course, when using the plot() function a VWAP line will draw on every bar; however, this method isn't highly compatible with auto-anchoring VWAP lines.
However!
A polyline, from beginning to end irrespective of the number of coordinates used, constitutes 1 polyline; 100 can exist simultaneously with 10,000 xy coordinates per line.
The image above shows an attempt to draw the same auto-anchored VWAP lines using the line.new() function. Not an ideal outcome!
The image above shows the same attempt using the polyline.new() function!
Very nice (:
The image above shows the indicator auto anchoring to zig zag turning points.
Subsequent to a new anchoring, VWAP is calculated for the following bars - up to the current bar.
Thank you for checking this out; if you have any ideas to spice it up feel free to comment!
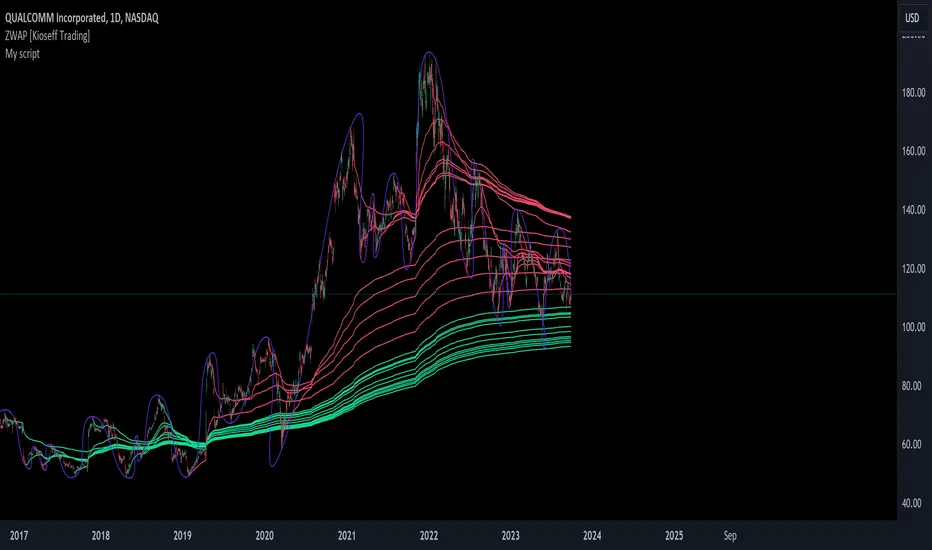
Trendline Breakouts With Targets [ChartPrime]The Trendline Breakouts With Targets indicator is meticulously crafted to improve trading decision-making by pinpointing trendline breakouts and breakdowns through pivot point analysis.
Here's a comprehensive look at its primary functionalities:
Upon the occurrence of a breakout or breakdown, a signal is meticulously assessed against a false signal condition/filter, after which the indicator promptly generates a trading signal. Additionally, it conducts precise calculations to determine potential target levels and then exhibits them graphically on the price chart.
🔷 Key Features:
🔸 Trendline Drawing: The indicator automatically plots trendlines based on significant pivot points and wick data, visually representing the prevailing trend.
🔸 Breakout and Breakdown Signals : It triggers trading signals when a breakout (price moves above the trendline) or a breakdown (price moves below the trendline) is detected, helping traders identify potential entry points.
🔸 False Breakout/ Breakdown Filter ✔️: To enhance accuracy, the indicator incorporates a filter to reduce false breakout and breakdown signals, helping traders avoid premature entries.
🔸 Target Calculation: The indicator performs target-level calculations, a critical aspect of trade management.
These calculated target levels are visually displayed on the price chart, helping traders set precise profit targets and make well-informed trading decisions.
🔸 Color-Change Labels: The indicator features label color changes to provide quick visual cues. Labels are initially displayed in orange. When a take profit (TP) level is reached, the label changes to green, indicating a successful trade. Conversely, if a stop-loss (SL) level is hit, the label turns red, signaling a losing trade.
🔸 Settings :
This indicator combines technical analysis, trendline identification, breakout/breakdown signals, and risk management tools to assist traders in making more informed and efficient trading decisions. It can be a valuable addition to any trader's toolkit, helping them identify potential trade opportunities and manage risk effectively.

Price Action (ValueRay)With this indicator, you gain access to up to 5 moving averages from a selection of 15 different types. This flexibility allows you to customize your trading strategy based on your preferences and market conditions. Whether you're a fan of simple moving averages, exponential moving averages, or weighted moving averages, our indicator has got you covered! Additionally, all the MAs are Multi-Time-Frame!
The indicator also provides trading signals. By analyzing market trends and price movements, it generates accurate buy and sell signals, providing you with clear entry and exit points. You can choose between Fast, Mid, and Slow signal speeds.
Trendlines are another crucial aspect of effective trading, and our indicator seamlessly integrates them, helping you visualize the market's direction.
Furthermore, the indicator empowers you with recent highs and lows. By highlighting these key levels, it becomes easier than ever to spot support and resistance areas, aiding you in making well-informed trading choices.
Additionally, you can switch the ADR% (Average Daily Range as a Percentage) on and off. This number instantly provides you with information on how much the stock usually moves per day as a percentage.
Key Features:
Up to 5 Moving Averages, each with its own timeframe.
SMA, EMA, WMA, RMA, Triangular, Volume Weighted, Elastic Volume Weighted, Least Squares, ZLEMA, Hull, Double EMA, Triple EMA, T3, ALMA, KAMA (more to come in future versions).
Recent High and Low Pivot Points acting as support/resistance.
Trendline indicating the current trend.
Buy/Sell Signals (recommended for use as exit points, stop loss, or take profit levels).
Signals can have three different speeds: Fast, Mid, and Slow. You can switch them anytime depending on how quickly or slowly you want to exit a trade.
The predefined colors are best suited for a dark background, and the predefined settings provide a solid starting point that many traders use in their daily work.
Unlock the full potential of your trading strategy with our comprehensive indicator and start making informed trading decisions today!

ICT Liquidty H/L [MK]indicator shows liquidity levels at pivot highs and lows on the chart timeframe. Levels are drawn as a horizontal line up to the last active bar. Once a level has been passed through, the level is highlighted. The liquidity level will remain highlighted until a pre determined amount of bars have closed after the level was passed. These liquidity levels can be used as targets for trades, or as potential reversal points. Liquidity (or resting orders) at key pivot points form a key part of the ICT trading system. Users can configure the indicator to display the untapped liquidity levels, or they can be completely hidden until they are passed through.
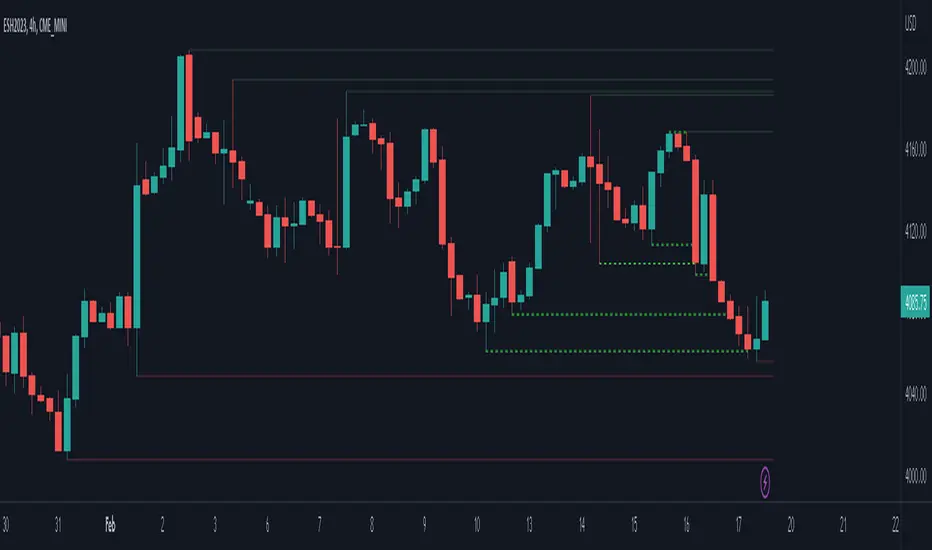
Divergence and Pivot - Detector For Any IndicatorI present to you an indicator capable of determining the divergence and convergence points for any indicator you choose. It will also determine Pivot points.
All you need to do is add the indicator to your favorites and call it. Next, you need a second indicator for which you want to find divergences or pivots. Next you need choise 'Oscillator Source' section in my indicator, after that you need to choose the name of the indicator for which you want to find divergences . - Done!
Thanks to the developers of TradingView for posting the source code of the "Divergence Indicator" indicator.

MFI Divergence Indicator Our Developer Malin converted the built-in RSI divergence indicator to MFI (Money Flow Index).
How to apply?
Notice 1: MFI, unlike the RSI, incorporates volume. It thus is an indicator of a higher precision when it comes to finding the the moment to sell - or - the moment to enter.
Notice 2: In Ranging Markets MFI (and RSI) is a solid momentum indicator to buy or sell. The asset displayed shows a slight markdown. Thus, we are looking primarily for short positions. Once can tell by us omitting the first 2 hidden bearish divergence signals and then entering the market.
Notice 3: Divergences depend on pivot points. The drawback with pivot points is that it is a lagging indication of a potential reversal. The more time (bars) one takes to confirm a reversal the less profitable is the trade - but less risky. In the charts one can tell that we enter the market 5 bars later. Usually that is not the tip of the reversal.
Notice 4: One must adapt the left and right periods of the indicator to risk/reward ratio, length of swing / frequency modulation and volatility of the price action.
Credits: Credits go to the Tradingview Team for delivering the original code. And Malin for the conversion. Please keep the copy right as a courtesy.
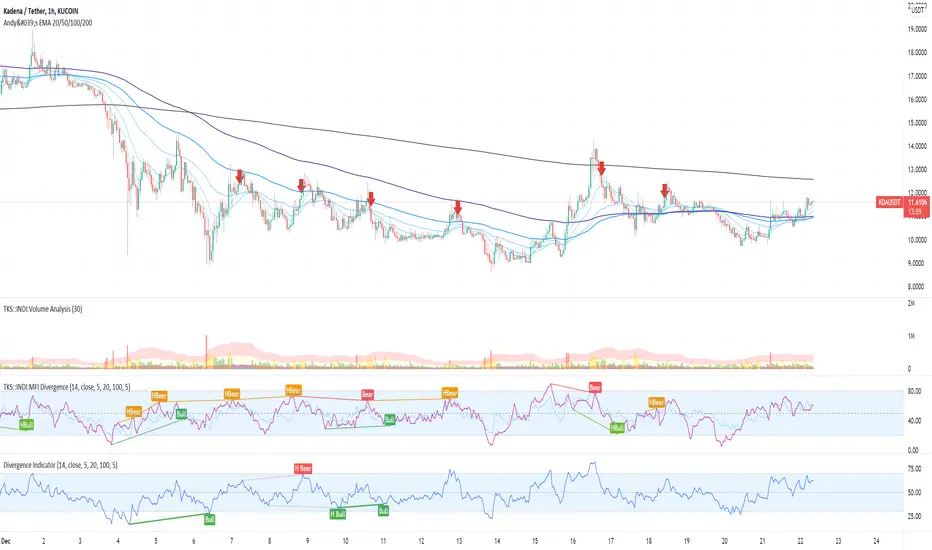
Bollinger Bands Fibonacci Ratios StrategyHello, everyone!
We have just released an innovative strategy for TradingView. It allows you to identify price pivot points and volatility.
This strategy is:
User-friendly
Configurable
Equipped with Bollinger Bands and smoothed ATR to measure volatility
Features
Thanks to the BB Fibo strategy, you can:
Trade stocks and commodities.
Identify price pivot points.
Choose any band for trading Long or Short positions.
Swap upper and lower bands applying Use Reverse Buy/Sell parameters.
Note! The upper bands are for the Long position. The lower bands are for the Short positions.
Parameters
We have equipped our strategy with more than 14 additional parameters. So, you can configure the EA according to your needs!
Inputs:
Length
Source: Open, High, Low, Close, HL2, HLC3, OHLC4
Offset
Fibonacci Ratio 1 — a Fibonacci factor for the 1st upper and lower indicator lines calculating.
Fibonacci Ratio 2 — a Fibonacci factor for the 2nd upper and lower indicator lines calculating.
Fibonacci Ratio 3 — a Fibonacci factor for the 3d upper and lower indicator lines calculating.
Use Reverse Buy — the strategy will use lower Bollinger bands instead of upper ones.
Fibonacci Buy — band selection for opening Long positions conditions.
Use Reverse Sell — the strategy will use upper Bollinger bands instead of lower ones.
Fibonacci Sell — band selection for opening Short positions conditions.
Style:
Basis — baseline color and style settings.
Upper 3 — the 3d upper line color and style.
Upper 2 — the 2nd upper line color and style.
Upper 1 — the 1st upper line color and style.
Lower 1 — the 1st lower line color and style.
Lower 2 — the 2nd lower line color and style.
Lower 3 — the 3d upper line color and style.
Background — the background color within the 3d upper and 3d lower indicator band.
Precision — the number of decimals for BB Fibo values.
Note! Try BB Fibo on your demo account first before going live.

PivotPoints with Momentum confirmation by PeterOWho wouldn't like to be able to tell when the market actually reverses instead of just faking it? Every trader who has tried pivothigh/pivotlow functions for that, surely bumped into so many meaningless reversal signals, that probably got discouraged with this concept entirely.
Yet, pivot points are very important. Only they need to be confirmed at least a little bit (you'll never know for sure, you understand that right?)
This script enhances pivot-points mechanism with by confirming potential pivot point with actual reversal in momentum. If momentum reversal is also noticed in synch with the pivothigh/pivotlow, then you've got yourself a reversal - marked on the chart with red or green triangle. You can visually compare where those triangles are marked as compared to those small black ones, meaning the standard pivothigh(high,1,1)/pivotlow(low,1,1). Check yourself how many times this method would save us from pre-mature entry. On average 2/3 pivot points are filtered out.
This is a non-delayed confirmation - there is no waiting for another candle to close, just looking to another indicator for a match.Trader needs to take a decision immediately because if he hesitates, he will be late for sure. Also sometimes this script produces signal even before a full pivot-point is formed, as pin-bar analysis is also included here.
What this script IS NOT:
- a complete trading map. Don't take trade on each green or red triangle. You still need to do your homework on market direction, trend, phase, wave, etc. But at least you have the "trigger" part done.
- these pivot points are still not "guaranteed". You never know the future even as close as the very next candle, so the market can continue its trend right after it produces reversal signal. The aim of this indicator was only to filter out those potential pivot points, which didn't really look like reversals.
If you think this method could be improved somehow or would like to share your thoughts or approach, don't hesitate to reach out to me or write down in comments.
P.S. Credit goes to UCSGEARS for his Top&Bottom candle script. Amazing work. I used the momentum calculation from there.
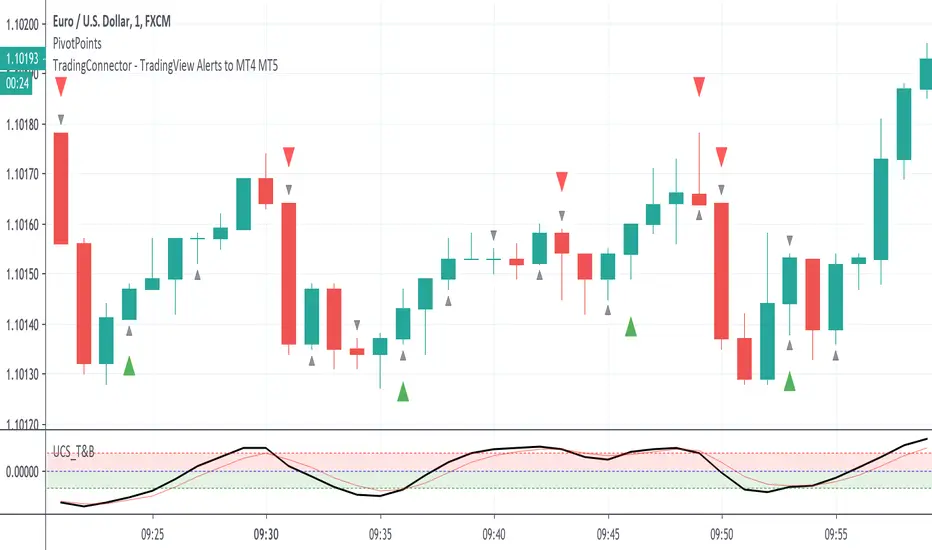
Simple Technicals Table📊 Simple Technicals Table
🎯 A comprehensive technical analysis dashboard displaying key pivot points and moving averages across multiple timeframes
📋 OVERVIEW
The Simple Technicals Table is a powerful indicator that organizes essential trading data into a clean, customizable table format. It combines Fibonacci-based pivot points with critical moving averages for both daily and weekly timeframes, giving traders instant access to key support/resistance levels and trend information.
Perfect for:
Technical analysts studying multi-timeframe data
Chart readers needing quick reference levels
Market researchers analyzing price patterns
Educational purposes and data visualization
🚀 KEY FEATURES
📊 Dual Timeframe Analysis
Daily (D1) and Weekly (W1) data side-by-side
Real-time updates as market conditions change
Seamless comparison between timeframes
🎯 Fibonacci Pivot Points
R3, R2, R1 : Resistance levels using Fibonacci ratios (38.2%, 61.8%, 100%)
PP : Central pivot point from previous period's data
S1, S2, S3 : Support levels with same methodology
📈 Complete EMA Suite
EMA 10 : Short-term trend identification
EMA 20 : Popular swing trading reference
EMA 50 : Medium-term trend confirmation
EMA 100 : Institutional support/resistance
EMA 200 : Long-term trend determination
📊 Essential Indicators
RSI 14 : Momentum for overbought/oversold conditions
ATR 14 : Volatility measurement for risk management
🎨 Full Customization
9 table positions : Place anywhere on your chart
5 text sizes : Tiny to huge for optimal visibility
Custom colors : Background, headers, and text
Optional pivot lines : Visual weekly levels on chart
⚙️ HOW IT WORKS
Fibonacci Pivot Calculation:
Pivot Point (PP) = (High + Low + Close) / 3
Range = High - Low
Resistance Levels:
R1 = PP + (Range × 0.382)
R2 = PP + (Range × 0.618)
R3 = PP + (Range × 1.000)
Support Levels:
S1 = PP - (Range × 0.382)
S2 = PP - (Range × 0.618)
S3 = PP - (Range × 1.000)
Smart Price Formatting:
< $1: 5 decimal places (crypto-friendly)
$1-$10: 4 decimal places
$10-$100: 3 decimal places
> $100: 2 decimal places
📊 TECHNICAL ANALYSIS APPLICATIONS
⚠️ EDUCATIONAL PURPOSE ONLY
This indicator is designed solely for technical analysis and educational purposes . It provides data visualization to help understand market structure and price relationships.
📈 Data Analysis Uses
Support & Resistance Identification : Visualize Fibonacci-based pivot levels
Trend Analysis : Study EMA relationships and price positioning
Multi-Timeframe Study : Compare daily and weekly technical data
Market Structure : Understand key technical levels and indicators
📚 Educational Benefits
Learn about Fibonacci pivot point calculations
Understand moving average relationships
Study RSI and ATR indicator values
Practice multi-timeframe technical analysis
🔍 Data Visualization Features
Organized table format for easy data reading
Color-coded levels for quick identification
Real-time technical indicator values
Historical data integrity maintained
🛠️ SETUP GUIDE
1. Installation
Search "Simple Technicals Table" in indicators
Add to chart (appears in middle-left by default)
Table displays automatically on any timeframe
2. Customization
Table Position : Choose from 9 locations
Text Size : Adjust for screen resolution
Colors : Match your chart theme
Pivot Lines : Toggle weekly level visualization
3. Optimization Tips
Use larger text on mobile devices
Dark backgrounds work well with light text
Enable pivot lines for visual reference
✅ BEST PRACTICES
Recommended Usage:
Use for technical analysis and educational study only
Combine with other analytical methods for comprehensive analysis
Study multi-timeframe data relationships
Practice understanding technical indicator values
Important Notes:
Levels based on previous period's data
Most effective in trending markets
No repainting - uses confirmed data only
Works on all instruments and timeframes
🔧 TECHNICAL SPECS
Performance:
Pine Script v5 optimized code
Minimal CPU/memory usage
Real-time data updates
No lookahead bias
Compatibility:
All chart types (Candlestick, Bar, Line)
Any instrument (Stocks, Forex, Crypto, etc.)
All timeframes supported
Mobile and desktop friendly
Data Accuracy:
Precise floating-point calculations
Historical data integrity maintained
No future data leakage
📱 DEVICE SUPPORT
✅ Desktop browsers (Chrome, Firefox, Safari, Edge)
✅ TradingView mobile app (iOS/Android)
✅ TradingView desktop application
✅ Light and dark themes
✅ All screen resolutions
📋 VERSION INFO
Version 1.0 - Initial Release
Fibonacci-based pivot calculations
Dual timeframe support (Daily/Weekly)
Complete EMA suite (10, 20, 50, 100, 200)
RSI and ATR indicators
Fully customizable interface
Optional pivot line visualization
Smart price formatting
Mobile-optimized display
⚠️ DISCLAIMER
This indicator is designed for technical analysis, educational and informational purposes ONLY . It provides data visualization and technical calculations to help users understand market structure and price relationships.
⚠️ NOT FOR TRADING DECISIONS
This tool does NOT provide trading signals or investment advice
All data is for analytical and educational purposes only
Users should not base trading decisions solely on this indicator
Always conduct thorough research and analysis before making any financial decisions
📚 Educational Use Only
Use for learning technical analysis concepts
Study market data and indicator relationships
Practice chart reading and data interpretation
Understand mathematical calculations behind technical indicators
The Simple Technicals Table provides technical data visualization to assist in market analysis education. It does not constitute financial advice, trading recommendations, or investment guidance. Users are solely responsible for their own research and decisions.
Author: ToTrieu
Version: 1.0
Category: Technical Analysis / Support & Resistance
License: Open source for educational use
💬 Questions? Comments? Feel free to reach out!
