Open Interest Chart [LuxAlgo]The Open Interest Chart displays Commitments of Traders %change of futures open interest , with a unique circular plotting technique, inspired from this publication Periodic Ellipses .
🔶 USAGE
Open interest represents the total number of contracts that have been entered by market participants but have not yet been offset or delivered. This can be a direct indicator of market activity/liquidity, with higher open interest indicating a more active market.
Increasing open interest is highlighted in green on the circular plot, indicating money coming into the market, while decreasing open interests highlighted in red indicates money coming out of the market.
You can set up to 6 different Futures Open interest tickers for a quick follow up:
🔶 DETAILS
Circles are drawn, using plot() , with the functions createOuterCircle() (for the largest circle) and createInnerCircle() (for inner circles).
Following snippet will reload the chart, so the circles will remain at the right side of the chart:
if ta.change(chart.left_visible_bar_time ) or
ta.change(chart.right_visible_bar_time)
n := bar_index
Here is a snippet which will draw a 39-bars wide circle that will keep updating its position to the right.
//@version=5
indicator("")
n = bar_index
barsTillEnd = last_bar_index - n
if ta.change(chart.left_visible_bar_time ) or
ta.change(chart.right_visible_bar_time)
n := bar_index
createOuterCircle(radius) =>
var int end = na
var int start = na
var basis = 0.
barsFromNearestEdgeCircle = 0.
barsTillEndFromCircleStart = radius
startCylce = barsTillEnd % barsTillEndFromCircleStart == 0 // start circle
bars = ta.barssince(startCylce)
barsFromNearestEdgeCircle := barsTillEndFromCircleStart -1
basis := math.min(startCylce ? -1 : basis + 1 / barsFromNearestEdgeCircle * 2, 1) // 0 -> 1
shape = math.sqrt(1 - basis * basis)
rad = radius / 2
isOK = barsTillEnd <= barsTillEndFromCircleStart and barsTillEnd > 0
hi = isOK ? (rad + shape * radius) - rad : na
lo = isOK ? (rad - shape * radius) - rad : na
start := barsTillEnd == barsTillEndFromCircleStart ? n -1 : start
end := barsTillEnd == 0 ? start + radius : end
= createOuterCircle(40)
plot(h), plot(l)
🔶 LIMITATIONS
Due to the inability to draw between bars, from time to time, drawings can be slightly off.
Bar-replay can be demanding, since it has to reload on every bar progression. We don't recommend using this script on bar-replay. If you do, please choose the lowest speed and from time to time pause bar-replay for a second. You'll see the script gets reloaded.
🔶 SETTINGS
🔹 TICKERS
Toggle :
• Enabled -> uses the first column with a pre-filled list of Futures Open Interest tickers/symbols
• Disabled -> uses the empty field where you can enter your own ticker/symbol
Pre-filled list : the first column is filled with a list, so you can choose your open interest easily, otherwise you would see COT:088691_F_OI aka Gold Futures Open Interest for example.
If applicable, you will see 3 different COT data:
• COT: Legacy Commitments of Traders report data
• COT2: Disaggregated Commitments of Traders report data
• COT3: Traders in Financial Futures report data
Empty field : When needed, you can pick another ticker/symbol in the empty field at the right and disable the toggle.
Timeframe : Commitments of Traders (COT) data is tallied by the Commodity Futures Trading Commission (CFTC) and is published weekly. Therefore data won't change every day.
Default set TF is Daily
🔹 STYLE
From middle:
• Enabled (default): Drawings start from the middle circle -> towards outer circle is + %change , towards middle of the circle is - %change
• Disabled: Drawings start from the middle POINT of the circle, towards outer circle is + OR -
-> in both options, + %change will be coloured green , - %change will be coloured red .
-> 0 %change will be coloured blue , and when no data is available, this will be coloured gray .
Size circle : options tiny, small, normal, large, huge.
Angle : Only applicable if "From middle" is disabled!
-> sets the angle of the spike:
Show Ticker : Name of ticker, as seen in table, will be added to labels.
Text - fill
• Sets colour for +/- %change
Table
• Sets 2 text colours, size and position
Circles
• Sets the colour of circles, style can be changed in the Style section.
You can make it as crazy as you want:
스크립트에서 "open interest"에 대해 찾기

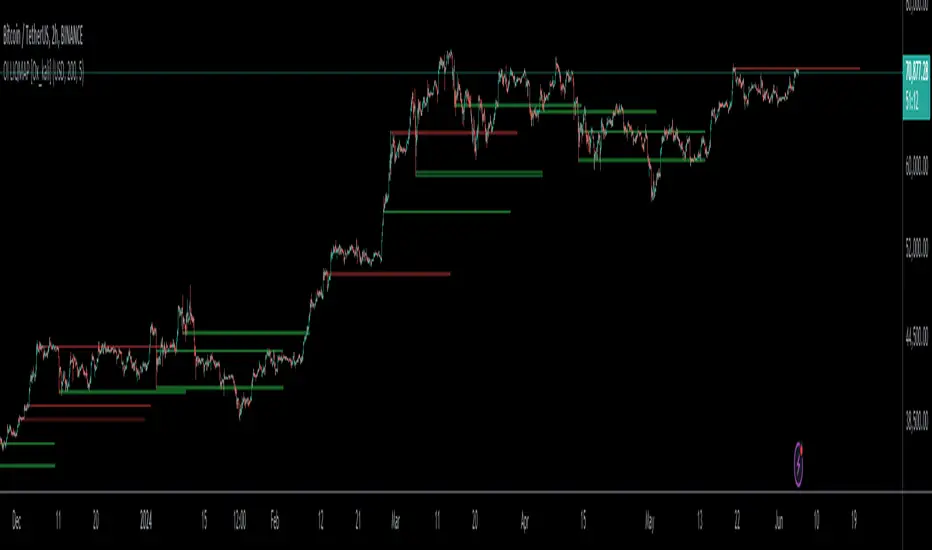
Open Interest OverlayOpen Interest Overlay
Overview
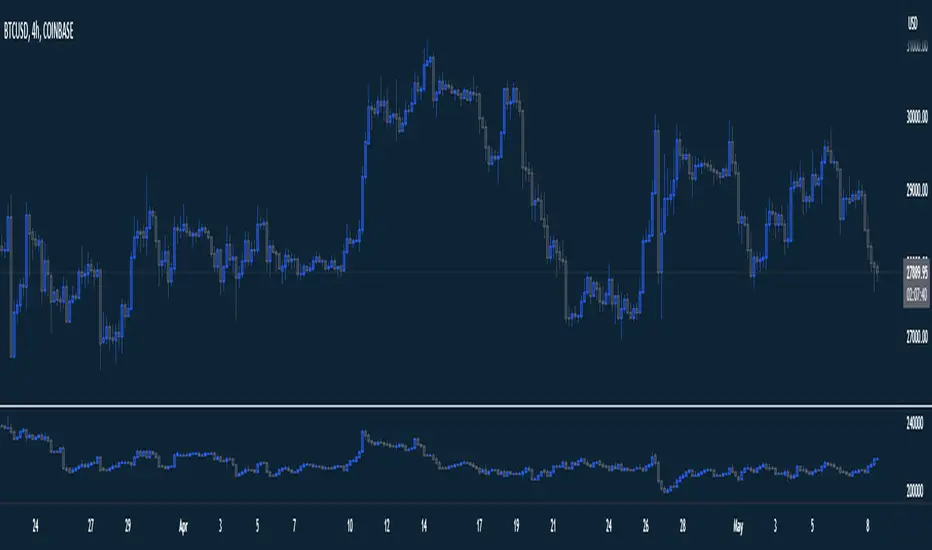
This indicator displays Open Interest (OI) data directly on your price chart as an overlay, eliminating the need for separate panes while preserving authentic OI movement patterns. Perfect for traders who want to analyze OI correlations without sacrificing chart real estate.
Key Features
📊 Smart Price Scaling
• Automatically maps Open Interest values to fit within your chart's price range
• Preserves all directional movements, timing, and relative magnitude relationships
• Uses official TradingView Open Interest feed for accuracy
🎨 Full Customization
• Custom Colors: Choose your own colors for rising/falling OI (defaults: teal/red)
• Line Style: Toggle between step-line (traditional) or smooth line display
• Optional Fill: Shade area between OI line and mid-price for better visual reference
• Smoothing Options: Apply moving average smoothing to reduce noise
⚙️ Intelligent Settings
• Normalization Window: 300-bar lookback (customizable) for scaling calculations
• Auto Timeframe: Uses daily data for intraday charts on traditional assets, chart timeframe for crypto
• Real Value Display: Shows actual (unscaled) OI value on the last bar
How It Works
The indicator performs proportional mapping of Open Interest data:
1. Calculates OI range (high/low) over the lookback period
2. Maps this range to your chart's price range during the same period
3. Displays OI movements that maintain authentic patterns and timing
Perfect For
✅ Correlation Analysis - See how OI moves with price in real-time
✅ Divergence Spotting - Identify when OI and price trends diverge
✅ Clean Charts - No need for separate panes or window splitting
✅ Pattern Recognition - Spot OI building/declining during key price levels
✅ Cross-Market Analysis - View any symbol's OI overlay on your current chart (e.g., Bitcoin OI while viewing Ethereum prices)
What You Get vs Traditional OI Indicators
Advantages:
• Authentic OI movement patterns preserved
• Direct visual correlation with price action
• No chart real estate sacrifice
• Immediate trend and divergence recognition
Trade-offs:
• Shows relative OI changes rather than absolute values
• Scaling is relative to the selected lookback period
Ideal For
• Day traders monitoring intraday OI flow
• Swing traders analyzing OI trends with price movements
• Futures traders tracking institutional interest
• Anyone wanting clean, correlation-focused OI analysis
Compatible With
• Futures contracts with Open Interest data
• Any timeframe (auto-adjusts for optimal data)
• All TradingView-supported OI symbols

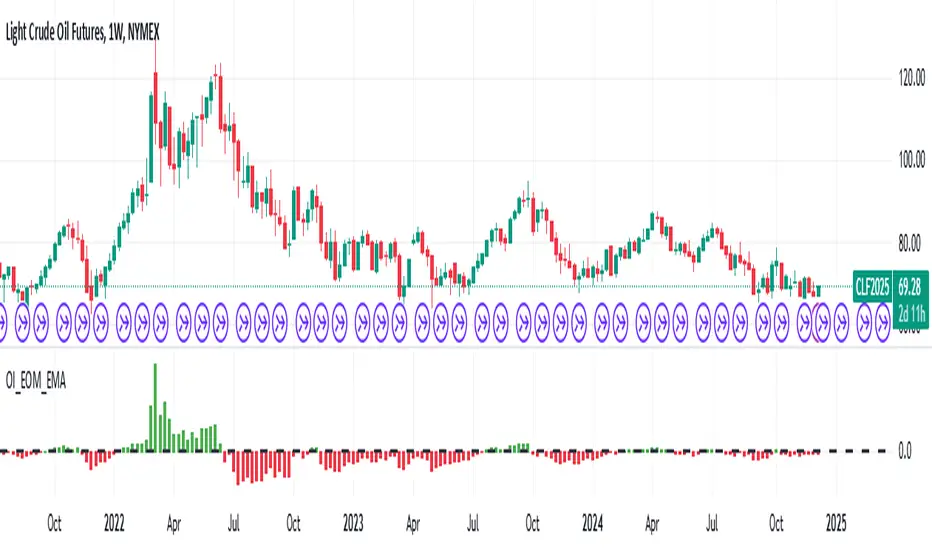
Open Interest Rank-BuschiEnglish:
One part of the "Commitment of Traders-Report" is the Open Interest which is shown in this indicator (source: Quandl database).
Unlike my also published indicator "Open Interest-Buschi", the values here are not absolute but in a ranking system from 0 to 100 with individual time frames-
The following futures are included:
30-year Bonds (ZB)
10-year Notes ( ZN )
Soybeans (ZS)
Soybean Meal (ZM)
Soybean Oil (ZL)
Corn ( ZC )
Soft Red Winter Wheat (ZW)
Hard Red Winter Wheat (KE)
Lean Hogs (HE)
Live Cattle ( LE )
Gold ( GC )
Silver (SI)
Copper (HG)
Crude Oil ( CL )
Heating Oil (HO)
RBOB Gasoline ( RB )
Natural Gas ( NG )
Australian Dollar (A6)
British Pound (B6)
Canadian Dollar (D6)
Euro (E6)
Japanese Yen (J6)
Swiss Franc (S6)
Sugar ( SB )
Coffee (KC)
Cocoa ( CC )
Cotton ( CT )
S&P 500 E-Mini (ES)
Russell 2000 E-Mini (RTY)
Dow Jones Industrial Mini (YM)
Nasdaq 100 E-Mini (NQ)
Platin (PL)
Palladium (PA)
Aluminium (AUP)
Steel ( HRC )
Ethanol (AEZ)
Brent Crude Oil (J26)
Rice (ZR)
Oat (ZO)
Milk (DL)
Orange Juice (JO)
Lumber (LS)
Feeder Cattle (GF)
S&P 500 ( SP )
Dow Jones Industrial Average Index (DJIA)
New Zealand Dollar (N6)
Deutsch:
Ein Bestandteil des "Commitment of Traders-Report" ist das Open Interest, das in diesem Indikator dargestellt wird (Quelle: Quandl Datenbank).
Anders als in meinem ebenfalls veröffentlichten Indikator "Open Interest-Buschi" werden hier nicht die absoluten Werte dargestellt, sondern in einem Ranking-System von 0 bis 100 mit individuellen Zeitrahmen.
Folgende Futures sind enthalten:
30-jährige US-Staatsanleihen (ZB)
10-jährige US-Staatsanleihen ( ZN )
Sojabohnen(ZS)
Sojabohnen-Mehl (ZM)
Sojabohnen-Öl (ZL)
Mais( ZC )
Soft Red Winter-Weizen (ZW)
Hard Red Winter-Weizen (KE)
Magerschweine (HE)
Lebendrinder ( LE )
Gold ( GC )
Silber (SI)
Kupfer(HG)
Rohöl ( CL )
Heizöl (HO)
Benzin ( RB )
Erdgas ( NG )
Australischer Dollar (A6)
Britisches Pfund (B6)
Kanadischer Dollar (D6)
Euro (E6)
Japanischer Yen (J6)
Schweizer Franken (S6)
Zucker ( SB )
Kaffee (KC)
Kakao ( CC )
Baumwolle ( CT )
S&P 500 E-Mini (ES)
Russell 2000 E-Mini (RTY)
Dow Jones Industrial Mini (YM)
Nasdaq 100 E-Mini (NQ)
Platin (PL)
Palladium (PA)
Aluminium (AUP)
Stahl ( HRC )
Ethanol (AEZ)
Brent Rohöl (J26)
Reis (ZR)
Hafer (ZO)
Milch (DL)
Orangensaft (JO)
Holz (LS)
Mastrinder (GF)
S&P 500 ( SP )
Dow Jones Industrial Average Index (DJIA)
Neuseeland Dollar (N6)

Aggregated Open InterestAggregates Open Interest data across 10 major crypto exchanges: Binance, Bybit, Kraken, MEXC, Bitget, BingX, Coinbase, Deribit, HTX, and Crypto.com.
Displays total market OI with candlesticks on intraday timeframes and a step line on daily+ timeframes. Color-coded: teal for increasing OI, red for decreasing OI.
Toggle individual exchanges on/off in settings to customize your view.
With this indicator there is no need to be on the perpetual chart of the asset for the open interest to be displayed.

Open Interest Denominated in QuoteOpen Interest indicator in TradingView doesn't have option to denominate in quote, so I made one.

Open Interest Auto SpaceManBTCOpen Interest Auto SpaceManBTC
This is an extension to the script, it aims to provide the data in a less hands on way by providing the basis for automatic calculation on which symbol the data is being pulled from.
Changelog:
Automatic Data retrieval on a percoin basis.
Ability to hide or show symbol.
Coloring choices for the user.

Open Interest Z-Score [BackQuant]Open Interest Z-Score
A standardized pressure gauge for futures positioning that turns multi venue open interest into a Z score, so you can see how extreme current positioning is relative to its own history and where leverage is stretched, decompressing, or quietly re loading.
What this is
This indicator builds a single synthetic open interest series by aggregating futures OI across major derivatives venues, then standardises that aggregated OI into a rolling Z score. Instead of looking at raw OI or a simple change, you get a normalized signal that says "how many standard deviations away from normal is positioning right now", with optional smoothing, reference bands, and divergence detection against price.
You can render the Z score in several plotting modes:
Line for a clean, classic oscillator.
Colored line that encodes both sign and momentum of OI Z.
Oscillator histogram that makes impulses and compressions obvious.
The script also includes:
Aggregated open interest across Binance, Bybit, OKX, Bitget, Kraken, HTX, and Deribit, using multiple contract suffixes where applicable.
Choice of OI units, either coin based or converted to USD notional.
Standard deviation reference lines and adaptive extreme bands.
A flexible smoothing layer with multiple moving average types.
Automatic detection of regular and hidden divergences between price and OI Z.
Alerts for zero line and ±2 sigma crosses.
Aggregated open interest source
At the core is the same multi venue OI aggregation engine as in the OI RSI tool, adapted from NoveltyTrade's work and extended for this use case. The indicator:
Anchors on the current chart symbol and its base currency.
Loops over a set of exchanges, gated by user toggles:
Binance.
Bybit.
OKX.
Bitget.
Kraken.
HTX.
Deribit.
For each exchange, loops over several contract suffixes such as USDT.P, USD.P, USDC.P, USD.PM to cover the common perp and margin styles.
Requests OI candles for each exchange plus suffix pair into a small custom OI type that carries open, high, low and close of open interest.
Converts each OI stream into a common unit via the sw method:
In COIN mode, OI is normalized relative to the coin.
In USD mode, OI is scaled by price to approximate notional.
Exchange specific scaling factors are applied where needed to match contract multipliers.
Accumulates all valid OI candles into a single combined OI "candle" by summing open, high, low and close across venues.
The result is oiClose , a synthetic close for aggregated OI that represents cross venue positioning. If there is no valid OI data for the symbol after this process, the script throws a clear runtime error so you know the market is unsupported rather than quietly plotting nonsense.
How the Z score is computed
Once the aggregated OI close is available, the indicator computes a rolling Z score over a configurable lookback:
Define subject as the aggregated OI close.
Compute a rolling mean of this subject with EMA over Z Score Lookback Period .
Compute a rolling standard deviation over the same length.
Subtract the mean from the current OI and divide by the standard deviation.
This gives a raw Z score:
oi_z_raw = (subject − mean) ÷ stdDev .
Instead of plotting this raw value directly, the script passes it through a smoothing layer:
You pick a Smoothing Type and Smoothing Period .
Choices include SMA, HMA, EMA, WMA, DEMA, RMA, linear regression, ALMA, TEMA, and T3.
The helper ma function applies the chosen smoother to the raw Z score.
The result is oi_z , a smoothed Z score of aggregated open interest. A separate EMA with EMA Period is then applied on oi_z to create a signal line ma that can be used for crossovers and trend reads.
Plotting modes
The Plotting Type input controls how this Z score is rendered:
1) Line
In line mode:
The smoothed OI Z score is plotted as a single line using Base Line Color .
The EMA overlay is optionally plotted if Show EMA is enabled.
This is the cleanest view when you want to treat OI Z like a standard oscillator, watching for zero line crosses, swings, and divergences.
2) Colored Line
Colored line mode adds conditional color logic to the Z score:
If the Z score is above zero and rising, it is bright green, representing positive and strengthening positioning pressure.
If the Z score is above zero and falling, it shifts to a cooler cyan, representing positive but weakening pressure.
If the Z score is below zero and falling, it is bright red, representing negative and strengthening pressure (growing net de risking or shorting).
If the Z score is below zero and rising, it is dark red, representing negative but recovering pressure.
This mapping makes it easy to see not only whether OI is above or below its historical mean, but also whether that deviation is intensifying or fading.
3) Oscillator
Oscillator mode turns the Z score into a histogram:
The smoothed Z score is plotted as vertical columns around zero.
Column colors use the same conditional palette as colored line mode, based on sign and change direction.
The histogram base is zero, so bars extend up into positive Z and down into negative Z.
Oscillator mode is useful when you care about impulses in positioning, for example sharp jumps into positive Z that coincide with fast builds in leverage, or deep spikes into negative Z that show aggressive flushes.
4) None
If you only want reference lines, extreme bands, divergences, or alerts without the base oscillator, you can set plotting to None and keep the rest of the tooling active.
The EMA overlay respects plotting mode and only appears when a visible Z score line or histogram is present.
Reference lines and standard deviation levels
The Select Reference Lines input offers two styles:
Standard Deviation Levels
Plots small markers at zero.
Draws thin horizontal lines at +1, +2, −1 and −2 Z.
Acts like a classic Z score ladder, zero as mean, ±1 as normal band, ±2 as outer band.
This mode is ideal if you want a textbook statistical framing, using ±1 and ±2 sigma as standard levels for "normal" versus "extended" positioning.
Extreme Bands
Extreme bands build on the same ±1 and ±2 lines, then add:
Upper outer band between +3 and +4 Z.
Lower outer band between −3 and −4 Z.
Dynamic fill colors inside these bands:
If the Z score is positive, the upper band fill turns red with an alpha that scales with the magnitude of |Z|, capped at a chosen max strength. Stronger deviations towards +4 produce more opaque red fills.
If the Z score is negative, the lower band fill turns green with the same adaptive alpha logic, highlighting deep negative deviations.
Opposite side bands remain a faint neutral white when not in use, so they still provide structural context without shouting.
This creates a visual "danger zone" for position crowding. When the Z score enters these outer bands, open interest is many standard deviations away from its mean and you are dealing with rare but highly loaded positioning states.
Z score as a positioning pressure gauge
Because this is a Z score of aggregated open interest, it measures how unusual current positioning is relative to its own recent history, not just whether OI is rising or falling:
Z near zero means total OI is roughly in line with normal conditions for your lookback window.
Positive Z means OI is above its recent mean. The further above zero, the more "crowded" or extended positioning is.
Negative Z means OI is below its recent mean. Deep negatives often mark post flush environments where leverage has been cleared and the market is under positioned.
The smoothing options help control how much noise you want in the signal:
Short Z score lookback and short smoothing will react quickly, suited for short term traders watching intraday positioning shocks.
Longer Z score lookback with smoother MA types (EMA, RMA, T3) give a slower, more structural view of where the crowd sits over days to weeks.
Divergences between price and OI Z
The indicator includes automatic divergence detection on the Z score versus price, using pivot highs and lows:
You configure Pivot Lookback Left and Pivot Lookback Right to control swing sensitivity.
Pivots are detected on the OI Z series.
For each eligible pivot, the script compares OI Z and price at the last two pivots.
It looks for four patterns:
Regular Bullish – price makes a lower low, OI Z makes a higher low. This can indicate selling exhaustion in positioning even as price washes out. These are marked with a line and a label "ℝ" below the oscillator, in the bullish color.
Hidden Bullish – price makes a higher low, OI Z makes a lower low. This suggests continuation potential where price holds up while positioning resets. Marked with "ℍ" in the bullish color.
Regular Bearish – price makes a higher high, OI Z makes a lower high. This is a classic warning sign of trend exhaustion, where price pushes higher while OI Z fails to confirm. Marked with "ℝ" in the bearish color.
Hidden Bearish – price makes a lower high, OI Z makes a higher high. This is often seen in pullbacks within downtrends, where price retraces but positioning stretches again in the direction of the prevailing move. Marked with "ℍ" in the bearish color.
Each divergence type can be toggled globally via Show Detected Divergences . Internally, the script restricts how far back it will connect pivots, so you do not get stray signals linking very old structures to current bars.
Trading applications
Crowding and squeeze risk
Z scores are a natural way to talk about crowding:
High positive Z in aggregated OI means the market is running high leverage compared to its own norm. If price is also extended, the risk of a squeeze or sharp unwind rises.
Deep negative Z means leverage has been cleaned out. While it can be painful to sit through, this environment often sets up cleaner new trends, since there is less one sided positioning to unwind.
The extreme bands at ±3 to ±4 highlight the rare states where crowding is most intense. You can treat these events as regime markers rather than day to day noise.
Trend confirmation and fade selection
Combine Z score with price and trend:
Bull trends with positive and rising Z are supported by fresh leverage, usually more persistent.
Bull trends with flat or falling Z while price keeps grinding up can be more fragile. Divergences and extreme bands can help identify which edges you do not want to fade and which you might.
In downtrends, deep negative Z that stays pinned can mean persistent de risking. Once the Z score starts to mean revert back toward zero, it can mark the early stages of stabilization.
Event and liquidation context
Around major events, you often see:
Rapid spikes in Z as traders rush to position.
Reversal and overshoot as liquidations and forced de risking clear the book.
A move from positive extremes through zero into negative extremes as the market transitions from crowded to under exposed.
The Z score makes that path obvious, especially in oscillator mode, where you see a block of high positive bars before the crash, then a slab of deep negative bars after the flush.
Settings overview
Z Score group
Plotting Type – None, Line, Colored Line, Oscillator.
Z Score Lookback Period – window used for mean and standard deviation on aggregated OI.
Smoothing Type – SMA, HMA, EMA, WMA, DEMA, RMA, linear regression, ALMA, TEMA or T3.
Smoothing Period – length for the selected moving average on the raw Z score.
Moving Average group
Show EMA – toggle EMA overlay on Z score.
EMA Period – EMA length for the signal line.
EMA Color – color of the EMA line.
Thresholds and Reference Lines group
Select Reference Lines – None, Standard Deviation Levels, Extreme Bands.
Standard deviation lines at 0, ±1, ±2 appear in both modes.
Extreme bands add filled zones at ±3 to ±4 with adaptive opacity tied to |Z|.
Extra Plotting and UI
Base Line Color – default color for the simple line mode.
Line Width – thickness of the oscillator line.
Positive Color – positive or bullish condition color.
Negative Color – negative or bearish condition color.
Divergences group
Show Detected Divergences – master toggle for divergence plotting.
Pivot Lookback Left and Pivot Lookback Right – how many bars left and right to define a pivot, controlling divergence sensitivity.
Open Interest Source group
OI Units – COIN or USD.
Exchange toggles for Binance, Bybit, OKX, Bitget, Kraken, HTX, Deribit.
Internally, all enabled exchanges and contract suffixes are aggregated into one synthetic OI series.
Alerts included
The indicator defines alert conditions for several key events:
OI Z Score Positive – Z crosses above zero, aggregated OI moves from below mean to above mean.
OI Z Score Negative – Z crosses below zero, aggregated OI moves from above mean to below mean.
OI Z Score Enters +2σ – Z enters the +2 band and above, marking extended positive positioning.
OI Z Score Enters −2σ – Z enters the −2 band and below, marking extended negative positioning.
Tie these into your strategy to be notified when leverage moves from normal to extended states.
Notes
This indicator does not rely on price based oscillators. It is a statistical lens on cross venue open interest, which makes it a complementary tool rather than a replacement for your existing price or volume signals. Use it to:
Quantify how unusual current futures positioning is compared to recent history.
Identify crowded leverage phases that can fuel squeezes.
Spot structural divergences between price and positioning.
Frame risk and opportunity around events and regime shifts.
It is not a complete trading system. Combine it with your own entries, exits and risk rules to get the most out of what the Z score is telling you about positioning pressure under the hood of the market.

Open Interest Aggregated (Lite)The Open Interest Aggregated (Lite) indicator consolidates open interest data across multiple major cryptocurrency exchanges into a single, easy-to-interpret visual. By aggregating open interest from Binance, Bybit, OKX, Bitget, and Coinbase (configurable per user preference), this indicator provides a holistic view of market positioning and trader sentiment in real time. It is designed for overlay-independent analysis, giving traders insight into derivatives market dynamics without cluttering price charts.
Key Features and Technical Details:
Aggregates open interest for USD, USDT, and USDC denominated perpetual contracts where available.
Supports configurable exchange inclusion: Binance, Bybit, OKX, Bitget, and Coinbase.
Normalizes USD-denominated open interest relative to the asset price for cross-exchange comparison.
Generates candlestick plots representing aggregated open interest: open, high, low, and close, allowing traditional technical analysis techniques (trend detection, breakouts, reversals) to be applied to derivatives positioning.
Provides optional hidden plots for each aggregated value (open, high, low, close) to support custom scripting or further analysis in Pine Script.
Color-coded candles: teal indicates an increase in open interest for the period, red indicates a decrease, highlighting shifts in trader sentiment.
Use Cases in Trading:
Trend Confirmation: Rising aggregated open interest in tandem with price increases can confirm bullish market participation, while decreasing open interest may signal weakening conviction.
Divergence Detection: Compare price action against aggregated open interest to detect potential reversals or exhaustion points.
Cross-Exchange Market Insight: By combining multiple exchanges, traders can identify shifts in global derivatives exposure rather than relying on a single market, reducing bias from localized trading anomalies.
Risk Assessment: Monitoring aggregated open interest can help anticipate periods of heightened leverage, which may correspond to increased volatility and potential liquidation events.
Why It’s Useful:
Open interest is a leading indicator of market sentiment and participation in futures markets. However, individual exchange data often provides an incomplete picture. Open Interest Aggregated (Lite) simplifies this by consolidating data across major platforms, enabling traders to make more informed decisions, assess market strength, and identify strategic entry or exit points with a clearer understanding of global positioning.
Application Notes:
Best used in combination with price analysis and volume metrics for robust trading signals.
Timeframe-independent: works on any chart interval, ensuring flexibility across intraday and longer-term strategies.
Lightweight “Lite” version ensures fast calculation while maintaining critical insights from multiple exchanges.

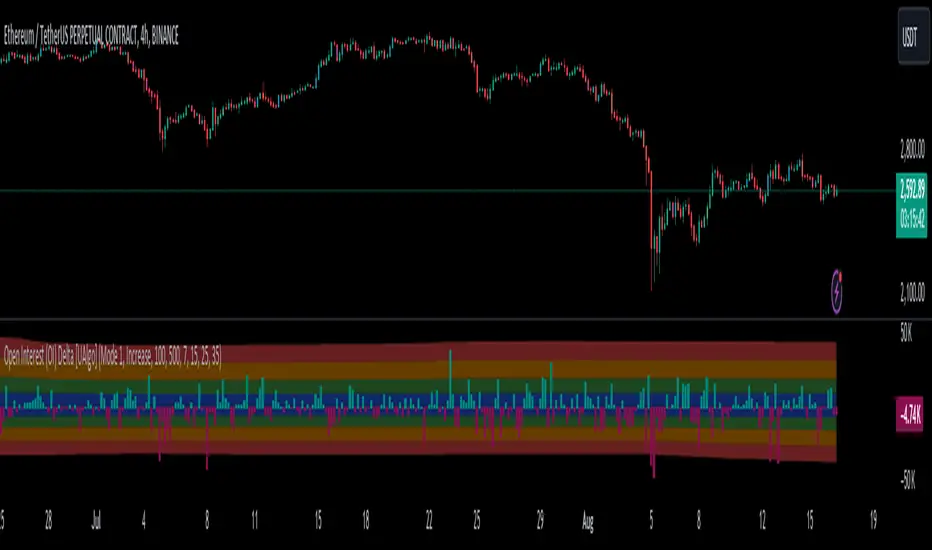
Open Interest (OI) Delta [UAlgo]The Open Interest (OI) Delta indicator is a tool designed to provide insights into the dynamics of Open Interest changes within the futures market. Open Interest (OI) refers to the total number of outstanding derivative contracts, such as options or futures, that have not been settled. The OI Delta measures the change in Open Interest over a specified period, allowing traders to assess whether new money is entering the market or existing positions are being closed.
This indicator offers two distinct display modes to visualize OI Delta, along with customizable levels that help in categorizing the magnitude of OI changes. Additionally, it provides the option to color-code the bars on the price chart based on the intensity and direction of OI Delta, making it easier for traders to interpret market sentiment and potential future price movements.
🔶 Key Features
Two Display Modes: Choose between two different modes for visualizing OI Delta, depending on your analysis preferences:
Mode 1: Displays the OI Delta directly as positive or negative values.
Mode 2: Separates positive and negative OI Delta values, displaying them as absolute values for easier comparison.
Customizable Levels: Set up to four levels of OI Delta magnitude, each with customizable thresholds and colors. These levels help categorize the OI changes into Normal, Medium, Large, and Extreme ranges, allowing for a more nuanced interpretation of market activity.
MA Length and Standard Deviation Period: Adjust the moving average length and standard deviation period for OI Delta, which smooths out the data and helps in identifying significant deviations from the norm.
Color-Coded Bar Chart: Optionally color the price bars on your chart based on the OI Delta levels, helping to visually correlate price action with changes in Open Interest.
Heatmap Display: Toggle the display of OI Delta levels on the chart, with the option to fill the areas between these levels for a more visually intuitive understanding of the data.
🔶 Interpreting Indicator
Positive vs. Negative OI Delta:
A positive OI Delta indicates that the Open Interest is increasing, suggesting that new contracts are being created, which could imply fresh capital entering the market.
A negative OI Delta suggests that Open Interest is decreasing, indicating that contracts are being closed out or settled, which might reflect profit-taking or a reduction in market interest.
Magnitude Levels:
Level 1 (Normal OI Δ): Represents typical, less significant changes in OI. If the OI Delta stays within this range, it may indicate routine market activity without any substantial shift in sentiment.
Level 2 (Medium OI Δ): Reflects a more significant change in OI, suggesting increased market interest and possibly the beginning of a new trend or phase of market participation.
Level 3 (Large OI Δ): Indicates a strong change in OI, often associated with a decisive move in the market. This could signify strong conviction among market participants, either bullish or bearish.
Level 4 (Extreme OI Δ): The highest level of OI change, often preceding major market moves. Extreme OI Δ can be a signal of potential market reversals or the final phase of a strong trend.
Color-Coded Bars:
When enabled, the color of the price bars will reflect the magnitude and direction of the OI Delta. This visual aid helps in quickly assessing the correlation between price movements and changes in market sentiment as indicated by OI.
This indicator is particularly useful for futures traders looking to gauge the strength and direction of market sentiment by analyzing changes in Open Interest. By combining this with price action, traders can gain a deeper understanding of market dynamics and make more informed trading decisions
🔶 Disclaimer
Use with Caution: This indicator is provided for educational and informational purposes only and should not be considered as financial advice. Users should exercise caution and perform their own analysis before making trading decisions based on the indicator's signals.
Not Financial Advice: The information provided by this indicator does not constitute financial advice, and the creator (UAlgo) shall not be held responsible for any trading losses incurred as a result of using this indicator.
Backtesting Recommended: Traders are encouraged to backtest the indicator thoroughly on historical data before using it in live trading to assess its performance and suitability for their trading strategies.
Risk Management: Trading involves inherent risks, and users should implement proper risk management strategies, including but not limited to stop-loss orders and position sizing, to mitigate potential losses.
No Guarantees: The accuracy and reliability of the indicator's signals cannot be guaranteed, as they are based on historical price data and past performance may not be indicative of future results.
Open Interest Profile [Fixed Range] - By LeviathanThis script generates an aggregated Open Interest profile for any user-selected range and provides several other features and tools, such as OI Delta Profile, Positive Delta Levels, OI Heatmap, Range Levels, OIWAP, POC and much more.
The indicator will help you find levels of interest based on where other market participants are opening and closing their positions. This provides a deeper insight into market activity and serves as a foundation for various different trading strategies (trapped traders, supply and demand, support and resistance, liquidity gaps, imbalances,liquidation levels, etc). Additionally, this indicator can be used in conjunction with other tools such as Volume Profile.
Open Interest (OI) is a key metric in derivatives markets that refers to the total number of unsettled or open contracts. A contract is a mutual agreement between two parties to buy or sell an underlying asset at a predetermined price. Each contract consists of a long side and a short side, with one party consenting to buy (long) and the other agreeing to sell (short). The party holding the long position will profit from an increase in the asset's price, while the one holding the short position will profit from the price decline. Every long position opened requires a corresponding short position by another market participant, and vice versa. Although there might be an imbalance in the number of accounts or traders holding long and short contracts, the net value of positions held on each side remains balanced at a 1:1 ratio. For instance, an Open Interest of 100 BTC implies that there are currently 100 BTC worth of longs and 100 BTC worth of shorts open in the market. There might be more traders on one side holding smaller positions, and fewer on the other side with larger positions, but the net value of positions on both sides is equivalent - 100 BTC in longs and 100 BTC in shorts (1:1). Consider a scenario where a trader decides to open a long position for 1 BTC at a price of $30k. For this long order to be executed, a counterparty must take the opposite side of the contract by placing a short order for 1 BTC at the same price of $30k. When both long and short orders are matched and executed, the Open Interest increases by 1 BTC, indicating the introduction of this new contract to the market.
The meaning of fluctuations in Open Interest:
- OI Increase - signifies new positions entering the market (both longs and shorts).
- OI Decrease - indicates positions exiting the market (both longs and shorts).
- OI Flat - represents no change in open positions due to low activity or a large number of contract transfers (contracts changing hands instead of being closed).
Typically, we monitor Open Interest in the form of its running value, either on a chart or through OI Delta histograms that depict the net change in OI for each price bar. This indicator enhances Open Interest analysis by illustrating the distribution of changes in OI on the price axis rather than the time axis (akin to Volume Profiles). While Volume Profile displays the volume that occurred at a given price level, the Open Interest Profile offers insight into where traders were opening and closing their positions.
How to use the indicator?
1. Add the script to your chart
2. A prompt will appear, asking you to select the “Start Time” (start of the range) and the “End Time” (end of the range) by clicking anywhere on your chart.
3. Within a few seconds, a profile will be generated. If you wish to alter the selected range, you can drag the "Start Time" and "End Time" markers accordingly.
4. Enjoy the script and feel free to explore all the settings.
To learn more about each input in indicator settings, please read the provided tooltips. These can be accessed by hovering over or clicking on the ( i ) symbol next to the input.

Open Interest liquidation map [Ox_kali]This script is inspired by @LeviathanCapital work on aggregating Open Interest , as presented in the Open Interest Suite Aggregated script. This script aims to provide a liquidation map of Open Interest by identifying significant anomalies across multiple trading platforms. By integrating data from Binance, BitMEX, and Kraken, this script tries to offer a comprehensive and detailed view of Open Interest movements and attempts to define zones of interest.
Key Points
1. Multiple Data Sources : The script retrieves Open Interest data from several trading platforms, including Binance (USDT, USD, BUSD), BitMEX (USD, USDT), and Kraken (USD).
2. Anomaly Detection : Utilizes a simple moving average (SMA) to calculate the average size of Open Interest candles and identify anomalies based on a user-specified size factor.
3. Background Coloring : Offers an option to color the background of the charts based on detected anomalies, allowing for clear visualization of significant movements.
4. Dynamic Support and Resistance Zones : Defines and dynamically updates support and resistance zones based on Open Interest anomalies.
5. Alerts : Configures alerts to notify the user when an Open Interest anomaly is detected.
Trading Utility
This script can be useful for monitoring significant changes in Open Interest and potential liquidation zones across multiple platforms. The main trading applications include:
1. Identifying Liquidation Points : By detecting Open Interest anomalies, it is possible to identify potential liquidation points where significant price movements might occur.
2. Multi-Platform Analysis : By aggregating Open Interest data from multiple platforms, a more comprehensive market overview is obtained.
3. Detecting Support and Resistance Zones : Dynamic support and resistance zones help identify key price levels where trend reversals might occur.
4. Customized Alerts: Anomaly alerts allow for automated responses to market changes.
Conclusion
The “Open Interest liquidation map ” script is an experimental tool for analyzing Open Interest across multiple trading platforms. Inspired by Leviathan’s work, this script attempts to identify liquidation and interest zones. This is an experimental version, and I welcome any comments and feedback for improvement.
Please note that the Open Interest liquidation map is not a guarantee of future market performance and should be used in conjunction with proper risk management. Always ensure that you have a thorough understanding of the indicator’s methodology and its limitations before making any investment decisions. Additionally, past performance is not indicative of future results.
Open Interest Footprint IQ [TradingIQ]Hello Traders!
Th e Open Interest Footprint IQ indicator is an advanced visualization tool designed for cryptocurrency markets. It provides a granular, real-time breakdown of open interest changes across different price levels, allowing traders to see how aggressive market participation is distributed within each bar.
Unlike standard footprint charts that rely solely on volume, this indicator offers unique insights by focusing on the interaction between price action and changes in open interest (OI) — a leading metric often used to infer trader intent and positioning.
How it works
The Open Interest Footprint IQ processes lower timeframe price and open interest data to build a footprint-style chart that shows how traders are positioning themselves within each candle.
Here’s a breakdown of the process:
1. Granular OI & Price Sampling
The script retrieves lower-timeframe data (1-minute, 1-second, or 1-tick, based on your setting).
For each candle, it captures:
High and low prices
Price change direction
Change in open interest (OI)
2. Classifying Trader Behavior
For each lower-timeframe segment, the indicator determines the type of positioning occurring based on price movement and OI change:
If price is moving up and open interest is increasing, it suggests that long positions are being opened. This is considered a "Longs Opening" event, labeled as UU (Up/Up).
If price is moving up but open interest is decreasing, it indicates that short positions are being closed. This is referred to as UD (Up/Down), or "Shorts Closing."
If price is moving down and open interest is increasing, it signals that short positions are being opened. This is known as DU (Down/Up), or "Shorts Opening."
If price is moving down while open interest is also decreasing, it means that long positions are being closed. This is labeled as DD (Down/Down), or "Longs Closing."
These are stored in separate arrays and displayed at specific price levels.
It is particularly useful for identifying:
Where longs or shorts are opening/closing positions
Stacked imbalances (indicative of potential absorption or exhaustion)
Value area zones and POC (Point of Control) based on OI, not volume
This footprint runs on your choice of sub-bar granularity and is ideal for high-frequency trading, scalping, and entries based on order flow dynamics.
Key Features
Footprint Visualization
At each price level within a candle:
Long/short opening and closing behavior is broken down.
Delta (net open interest change) is displayed both numerically and color-coded.
Optional gradient coloring shows intensity and type of flow (longs/shorts opened/closed).
Cumulative or per-bar reset modes allow you to track OI evolution over time.
The image above explains the information that each Footprint box shows across a candlestick!
Each footprint box shows:
OI Delta
OI Delta %
Longs Opened (LO)
Longs Closed (LC)
Shorts Opened (SO)
Shorts Closed (SC)
The image above explains the color-coding feature of the indicator.
Boxes are color coded to show which position action
dominated at the price area.
For this example:
Green boxes = Long positions being opened dominated
Purple boxes = Long positions being closed dominated
Red boxes = Short positions being opened dominated
Yellow boxes = Short positions being closed dominated
All colors are customizable.
Additionally, for traders who are only interested in whether OI increased/decreased, a "two-color" option is available in the settings.
For the two-color option, footprint boxes can be one of two colors. Showing whether OI increased or decreased at the level.
Cumulative Levels
Open Interest Footprint IQ contains a "Cumulative Levels" feature that tracks/stores open interest change at tick levels over time, rather than resetting per bar.
With the "Cumulative Levels" feature enabled, traders can see open interest changes persist across all candlesticks. This feature is useful for determining whether longs opening, longs closing, shorts opening, or shorts closing are dominating at particular price areas over time rather than on a single bar.
A useful feature to see if shorts/longs are favoring certain price throughout the day, week, month, etc.
Input Settings Explained
Granularity (Dropdown: Granularity)
Options: 1-Minute, 1-Second, 1-Tick
Determines how finely the script samples the lower timeframe data to construct the footprint.
For precision:
1-Tick = Highest accuracy, but more resource-intensive.
1-Second/1-Minute = Suitable for broader or more zoomed-out analysis.
Tick Level Distance (Tick Level Distance (0 = Auto))
Defines the vertical spacing between levels in the footprint chart.
If 0, the script uses an automatic calculation based on ATR to adapt to volatility.
Set a manual value (e.g., 5) to control the height granularity of each level in ticks.
Cumulative Levels (Toggle)
If enabled, the footprint builds cumulatively over time, rather than resetting per candle.
Use case: Visualize ongoing buildup of OI activity across a session or day.
Cumulative Levels Reset TF (Timeframe)
Sets the reset interval for the cumulative view (e.g., reset daily, hourly, etc.)
Works only when Cumulative Levels is enabled.
Delta Box Display Settings
Show Delta Percentage
Toggles the display of the percentage change in OI across the footprint level.
Helpful to gauge how aggressive positioning is relative to total OI at that level.
Show Longs/Shorts (Opened/Closed)
Show Longs Opened: Displays OI increase in up candles (price ↑, OI ↑).
Show Longs Closed: Displays OI decrease in down candles (price ↓, OI ↓).
Show Shorts Opened: OI increase in down candles (price ↓, OI ↑).
Show Shorts Closed: OI decrease in up candles (price ↑, OI ↓).
These behaviors are color-coded to give traders instant context:
Blue-green for longs opening.
Purple for longs closing.
Red for shorts opening.
Yellow for shorts closing.
Value Area & POC
Value Area % (Value Area %)
Controls how much cumulative open interest is used to define the value area.
Example: 70% means the smallest range of prices that contains 70% of total OI in that bar will be marked.
Helps identify zones of interest, support/resistance, and institutional levels.
The image above explains how to identify the VAH/VAL/POC shown by Open Interest Footprint IQ.
VAH = Upper 🞂
POC = ●
VAL = Lower 🞂
Imbalances
Imbalance Percentage
Defines the minimum delta % required at a level to be marked as an imbalance.
If the net open interest change at a level exceeds this threshold, a visual marker appears.
Stacked Imbalance Count
If the number of consecutive imbalance levels meets this count, a “Stacked Imbalance” alert will trigger.
This can signal aggressive buying or selling pressure, potential breakout zones, or institutional absorption.
Color Settings
Longs Opened / Closed, Shorts Opened / Closed
Customize the color palette for each order flow behavior.
These colors appear in the background gradient of the footprint boxes.
Up/Down Only Mode
Toggle to override all behavior-based colors with a single Up Color and Down Color.
Useful if you prefer a simple bull/bear view.
Up Color / Down Color
If "Up/Down Only" is enabled, these two colors are used to represent all net positive or negative deltas.
Special Notes
Crypto only: This script works only with crypto tickers on TradingView.
For other assets (stocks, futures), a warning message will appear instead.
OI data must be available from the exchange (many perpetual pairs support this).
If the footprint is too small or invisible, increase your tick level spacing in the settings.
Alerts
When a stacked imbalance is detected, an alert is fired ("Stacked Imbalance").
This feature is useful for automated systems, bots, or simply staying informed of potential trade setups.
And that's all for now!
If you have any questions or features you'd like to see feel free to share them in the comments below!
Thank you traders!

Open interest buildup & Session Open high-lowThis indicator is to be used on srcipts in Futures Segment.
1. It visually displays in tabular format the change in open interest and the change in price compared to the previous day.
2. It also displays the scenario where open price of session is near high price of session or low price of session, indicating a emergence of strong sellers or strong buyers from start of session respectively.
3. A positive change in open interest and a positive change in price is denoted by a long buildup and open price near low price is an additional confirmation for a probable long scenario in the script.
4. A positive change in open interest and a negative change in price is denoted by a short buildup and open price near high price is and additional confirmation for a probable short scenario in the script.
Key features of the indicator include:
Override Symbol Input: Traders can override the default symbol and input their preferred symbol for analysis.
Open Interest Data: The indicator retrieves open interest data for the selected symbol and time frame, facilitating analysis based on changes in open interest.
Dashboard: The indicator features a customizable dashboard that displays key information such as build-up conditions, OI change, and price change.
Build-Up Conditions: The indicator identifies long build-up and short build-up scenarios based on user-defined thresholds for OI change and price change percentages.
Customization Options: Traders have the flexibility to customize various aspects of the indicator, including colors for long build-up, short build-up, positive OI change, negative OI change, positive price change, and negative price change.
Label Plots: Buy and sell labels are plotted on the chart to highlight potential trading opportunities. Traders can customize the colors and text colors of these labels based on their preferences.
Overall, the indicator offers traders a comprehensive tool for analyzing price movements and open interest changes, helping them make informed trading decisions in the futures segment.

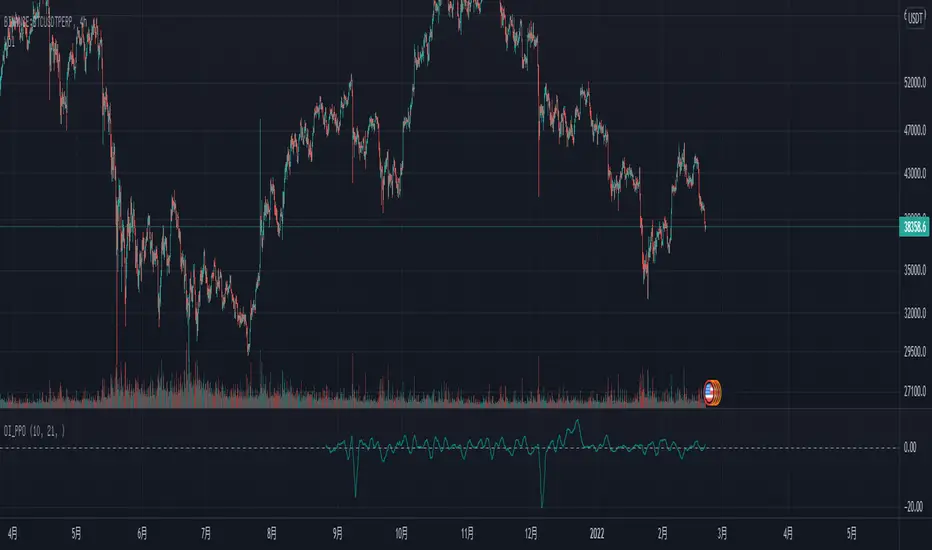
Open Interest Price OscillatorNOTE: You need to use this script on the ticker that has open interest data.
Price Oscillator of the ticker's open interest.
Only the money would tell you the truth.
Trend tends to change after a significate change of the open interest.
So it's may be a reliable indicator to catch the market movements.
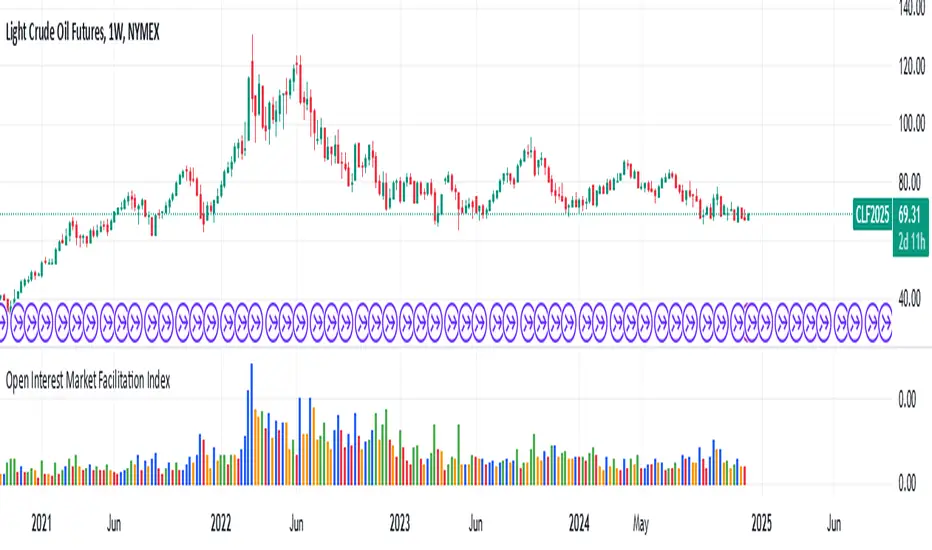
Open Interest Market Facilitation IndexOriginal script from ChartChampions :
Let's start.
This script was created by using Open Interest instead of Volume in the Market Facilitation Index.
Thus, it can make a difference in the Future and CFD Markets.
If your financial instrument is not from these markets, that is, if Open Interest is not used, you can choose Volume.
You can set "FUTURES" and "OTHERS" from the menu.
If you use the Open Interest (FUTURES) option in the menu on 1W bars and defined Future markets, it will not repaint.
This is the best use for Open Interests, as data is extracted from Quandl and CFTC COT reports are published once a week.
Color Change Rules :
In my version :
Green Bars = Green
Fade Bars = Orange
Fake Bars = Blue
Squat Bars = Red
To show the difference in the presentation, both the Futures option using Open Interest and the Others option using Volume were published to compare.
You can observe the difference.
Best regards.
Open Interest:CME e-o-d vs CFTC e-o-wCFTC only publishes total OI on fridays, related to last Tuesday.
But what happened since last Tuesday?
CME Vol & Open Interest data is recorded&exported daily by quandl.com to tradingview
via the che CHRIS/CME datasets
www.quandl.com
Eg. Nat Gas next outstanding cntract n. 20, field n. 7(OI)
@quandl.com:
www.quandl.com
is exported @tradingview:
www.tradingview.com
Every outstanding contract's OI & vol is exported (black column), but not the total (yellow line):
tiny.cc
This script sums up all the existing outstanding contract's OI for the future (the black column), so one can have an idea of the total OI for the day (Yellow line).
As numer of outstanding contracts varies from future to future,Eg:
E-mini (ES) has 4 contracts, Gold(GC) 16 cntrcts, NatGas(NG) has 43, WTI(CL) has 38 etc
the scrips tries to guess how many exist for it and sums them up, to have the total OI for tha day
Number ofoutstanding contracts exported by quandl.com to tradingview is taken from
s3.amazonaws.com
There are 2 params you can enter on the script:
* override the ticket symbol on the chart ,if script cannot guessit or you need a different one
* enter the "preliminary" OI that is published by CME early the next day, butb not yet exported by quandl to tradingview
This script is Open so anyone can copy and modifyit for its use.
Please post comments and ideas if you find it useful
I try to keep a log of my work here:

Open Interest RSIThis indicator started as an experiment.
It is an RSI which is not based on the price but on the open interest.
It captures the momentum of the open interest in the same way as the RSI of the price.
Rules Open Interest (OI):
If the OI rises and the price rises = Bullish trend.
If the OI falls and the price continues to rise = bearish reversal possible
If the OI falls and the price continues to fall = Bullish reversal possible
If the OI rises and the price falls = Bearish trend
Since the OI RSI captures the momentum of the OI, it is recommended to include the price RSI for the analysis.
In the picture are marked different examples which show extreme situations
Example rose lines:
The price RSI and the OI RSI form a bearish divergence to the price and run parallel = strong bearish signal.
Example orange circles:
Price Falling. The price RSI is in the oversold zone and the OI RSI is above 53 or in the best case in the overbought zone. = Strong bullish signal
Example Blue circle:
The price RSI and the OI RSI are running parallel downwards and the price is also falling = bearish momentum.
As mentioned, this is an experiment. The tests were performed in the 4H chart
Have Fun

Open Interest All ExchangesThe indicator collects data from available exchanges based on open interest. The indicators are calculated in the amount of Bitcoin.
Below are the tickers of the exchanges that provide the data:
- BITFINEX:BTCUSD
- BITFINEX:BTCUST
- KRAKEN:BTCUSDPERP
- BITMEX:XBTUSD
- BITMEX:XBTUSDT
- BINANCE:BTCUSDTPERP
- BINANCE:BTCUSDPERP (due to low volumes and limitations of 40 requests of the request.security function, the code contains data without using the calculation)
For me, Open Interest indicators play an important role in the trading system, for this reason I share with you. I am not a financial advisor.
**Open for cooperation**
Open Interest Inflows & Outflows [LuxAlgo]The Open Interest Inflows & Outflows indicator focuses on highlighting alterations in the overall count of active contracts associated with a specific financial instrument.
The indicator also includes an oscillator highlighting the price sentiment to use in conjunction with the open interest flow sentiment and also includes a rolling correlation of the open interest flow sentiment with a user-selected source.
🔶 USAGE
Open Interest (OI) indicates the total number of active contracts, encompassing both long and short positions, for a specific financial instrument at any given moment. This key indicator helps traders and analysts assess market activity and sentiment.
An increase in open interest generally indicates new money flowing into the market, suggesting increased activity and the potential for a trending market. Conversely, a decrease in open interest indicates that traders are closing their positions, suggesting less interest in that particular contract.
Open Interest Flow Sentiment assesses the correlation between the initiation of new positions (inflows) and the closure of existing positions (outflows) for a particular instrument. Positive values suggest a prevalence of inflows, while negative values signify a prevalence of outflows.
The magnitude of the deviation from zero reflects the extent of dominance, either in inflows or outflows.
Price Sentiment estimates the relationship between the strength of bulls (buyers) and bears (sellers) on an instrument. Positive values indicate higher bull power and negative values indicate higher bear power.
The correlation feature is a key component of the indicator and helps analyze the relationship between trading volume and Open Interest changes. If volume increases along with rising Open Interest, it supports the validity of the price trend.
A divergence between price movement, volume, and Open Interest may signal potential reversals.
🔶 DETAILS
This indicator, based on Dr. Alexander Elder's acclaimed Elder-Ray concept, aids traders in evaluating the strength of both bulls and bears by delving beneath the surface of the markets. It uncovers data not immediately apparent from a superficial glance at prices. The indicator comprises two components: Bull Power and Bear Power.
Considering that the high price of any candle signifies the maximum power of buyers and the low price represents the maximum power of sellers, Elder employs the 13-period Exponential Moving Average (EMA) to depict the average consensus of price value. Bull Power assesses whether buyers can drive prices above the average consensus of value, while Bear Power assesses whether sellers can push prices below this average.
Here are the formulas for Bull Power and Bear Power:
bull_power = high - ema(close, 13)
bear_power = low - ema(close, 13)
This concept is utilized to calculate Open Interest Flow Sentiment and Price Sentiment. The Open Interest Flow Sentiment estimates the relationship between new positions (inflows) and positions being closed (outflows), providing insights into market dynamics. The Price Sentiment, on the other hand, gauges the correlation between price movements and the Elder-Ray components, aiding traders in identifying potential shifts in market sentiment and momentum.
🔶 SETTINGS
🔹Open Interest Inflows & Outflows
OI Sentiment Correlation: toggles the visibility of Open Interest correlation with a variety of sources.
Money Flow Estimates: toggles the visibility of Money Flow Estimates calculated for the last bar.
🔹Style
OI Flow Sentiment: toggles the visibility of Open Interest Flow Sentiment, along with color customization options.
Price Sentiment: toggles the visibility of Price Sentiment, along with color customization options.
Correlation Colors: color customization option for the Correlation Area.
🔹Others
Smoothing: smoothing length applicable for Open Interest Flow Sentiment and Price Sentiment.
🔶 RELATED SCRIPTS
Open-Interest-Chart
Liquidation-Estimates
Thanks to our community for recommending this script. For more conceptual scripts and related content, we welcome you to explore by visiting >>> LuxAlgo-Scripts .

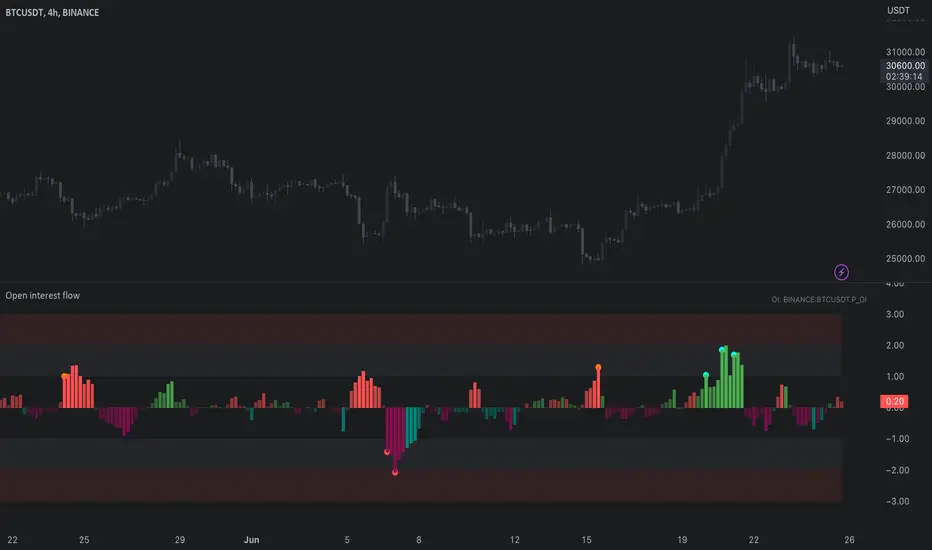
Open interest flow / quantifytools- Overview
Open interest flow detects inflows (positions opening) and outflows (positions closing) using open interest and estimates delta (net buyers/sellers) for the flows. Users are able to choose any open interest source available on Tradingview, by default set to BTCUSDT OI fetched from Binance. Using historical open interest flows, bands depicting typical magnitude of flows are formed for benchmarking intensity of flows. On the inflow side, +1 represents average inflows while +2 represents 2x above average inflows, a level considered an extreme. In a vice versa manner, -1 represents average outflows while -2 represents 2x above average outflows. Extreme inflows indicate aggressive position opening, in other words exuberance. Extreme outflows on the other hand indicate forced exiting of positions, in other words liquidations.
- Concept
Open interest flow is calculated using position of OI source relative to its moving average (by default set to SMA 10), referred to as relative open interest from hereon. When relative OI is positive (open interest is above its moving average), new positions are considered to enter the market. When relative OI is negative (open interest is below its moving average), existing positions are considered to exit the market. Open interest delta (side opening/closing positions, either net buyers/sellers) is calculated using relative price in a similar fashion to relative OI, but using close of viewed symbol as source. Price is considered to be up when relative price is positive, down when relative price is negative. Using relative OI and relative price in tandem, the following assumptions are applied:
Price up, open interest up = longs entering market
Price down, open interest up = shorts entering market
Price down, open interest down = longs exiting market
Price up, open interest down = shorts exiting market
Bands depicting magnitude of open interest flows are calculated using average turning points in relative OI. +1 and -1 represent levels where flows on average turn towards mean rather than continue to increase/decrease. These levels are then multiplied up to +2 and -2, representing two times larger deviations from the normal. When inflows are above 1, positions opening have reached a point where flows historically turn down. Therefore, anything above 1 would be abnormal amount of open interest entering, an extreme stretch being at 2 or above. Same logic applies to outflows, but in a vice versa manner (below -1 abnormal, extreme at -2)
Flow bursts further refine indications of aggressive inflows/outflows by taking into account change in open interest flows. Burst indications are activated when open interest is above its average turning point, coupled with a sufficient increase/decrease in flows simultaneously. Bursts are essentially a filtered version of abnormal flows and therefore a more reliable indication of exuberance/liquidations. Burst sensitivity can be adjusted via input menu, available in 5 settings. 1 sets OI burst requirements to loosest (more signals, more noise) while 5 sets OI burst requirements to strictest (less signals, less noise). Exact criteria applied to bursts can be viewed via input menu tooltip.
- Features
Users can opt for OI source auto-select for CRYPTO/USDT pairs. When auto-select is enabled and another chart is opened, corresponding open interest source is automatically selected as long as requirements mentioned above are met.
Open interest flows can be visualized as chart color, available separately for flow states and flow bursts.
Relative price line and flow guidelines (reminders for flow interpretation) can be enabled via input menu. All colors are customizable.
- Alerts
Available alerts are the following:
- Abnormal long inflows/outflows
- Abnormal short inflows/outflows
- Abnormal inflows/outflows from either side
- Aggressive longs/shorts (flow burst up)
- Liquidated longs/shorts (flow burst down)
- Aggressive or liquidated longs/shorts
- Practical guide
Open interest as a standalone data point does not reveal which side is likely opening/exiting positions and how extreme the participant behavior is. Using the additional data provided by open interest flows, moments of greed and fear can be detected. Smart money does not short into dips and buy into rips. When buyers or sellers have participated in a large move and continue to show interest even when efforts are not rewarded at an already overextended price, participants are asking for trouble.
Similar events can be observed when extreme outflows take place, indicating forced exits such as stop-losses triggering. When enough participants are forced out, price is likely to take the path of least resistance which is to the opposite direction.
Open Interest Exponential Ease of MovementModified Ease of Movement :
* Open Interests used on Futures instead of Volume (Includes Bitcoin)
* Exponential Moving Average used instead of Simple Moving Average
* Division Number cancelled. (Division Number gives wrong signals inside strong trends.)
NOTE : This code is open source under the MIT License. If you have any improvements or corrections to suggest, please send me a pull request via the github repository github.com
Stay tuned. Best regards !
Open Interest Money Flow Index (OIMFI)CAUTION : This system was inspired from seiglerj' s "Money Flow Index " script. Open Interests are used instead of volume.
What is the Money Flow Index ( MFI )?
The Money Flow Index ( MFI ) is a technical oscillator that uses price and volume for identifying overbought or oversold conditions in an asset. It can also be used to spot divergences which warn of a trend change in price. The oscillator moves between 0 and 100.
Unlike conventional oscillators such as the Relative Strength Index ( RSI ), the Money Flow Index incorporates both price and volume data, as opposed to just price. For this reason, some analysts call MFI the volume-weighted RSI .
What Does the Money Flow Index ( MFI ) Tell You?
One of the primary ways to use the Money Flow Index is when there is a divergence. A divergence is when the oscillator is moving in the opposite direction of price. This is a signal of a potential reversal in the prevailing price trend.
For example, a very high Money Flow Index that begins to fall below a reading of 80 while the underlying security continues to climb is a price reversal signal to the downside. Conversely, a very low MFI reading that climbs above a reading of 20 while the underlying security continues to sell off is a price reversal signal to the upside.
Traders also watch for larger divergences using multiple waves in the price and MFI . For example, a stock peaks at $10, pulls back to $8, and then rallies to $12. The price has made two successive highs, at $10 and $12. If MFI makes a lower higher when the price reaches $12, the indicator is not confirming the new high. This could foreshadow a decline in price.
The overbought and oversold levels are also used to signal possible trading opportunities. Moves below 10 and above 90 are rare. Traders watch for the MFI to move back above 10 to signal a long trade, and to drop below 90 to signal a short trade.
Other moves out of overbought or oversold territory can also be useful. For example, when an asset is in an uptrend, a drop below 20 (or even 30) and then a rally back above it could indicate a pullback is over and the price uptrend is resuming. The same goes for a downtrend. A short-term rally could push the MFI up to 70 or 80, but when it drops back below that could be the time to enter a short trade in preparation for another drop .
Reference : www.investopedia.com
WARNING :
** Since each instrument in the list has its own unique contract data, you must first enter its name to display it. I recommend you to select OANDA from the markets. Finally, when the COT reports are issued, it may repaints. However, this repaint is usually close to closing or after close .(When COT reports are so sharp ) So use this script only 1W ( 1 week ) or 1 M ( 1 month ) timeframe.
** This data is taken to Tradingview with the help of Quandl. This is a very low possibility, but the system will not work if there is a malfunction.
FEATURES :
*** Working with all futures (Including : Bitcoin )
*** If you dont work with "Futures" , you can select "Others" from switchable menu and use volume for all instruments.
*** New generation elegant design used : Adaptive coloring Overbought - Oversold Levels according to the closing price.
NOTE : This code is open source under the MIT License. If you have any improvements or corrections to suggest, please send me a pull request via the github repository github.com
Stay tuned. Best wishes !

Open Interest Weighted Average Price [Arjo]Open Interest Weighted Average Price , or OIWAP , is a simple visual indicator that shows the average price of an asset based on changes in open interest .
Instead of using trading volume like VWAP, this indicator gives more weight to prices where new futures contracts are being added or removed . This helps highlight the price levels where traders are actively building or closing positions.
The indicator shows:
A main line that represents the average price weighted by open interest changes.
Upper and lower bands (standard deviation bands) that show how far the price moves away from this average.
OIWAP is mainly useful for NSE futures markets , where open interest data is available. It helps traders visually understand where most market participation and positioning are taking place relative to price .
Concepts:
Applies statistical concepts, including weighted averaging and standard deviation, to open interest data
Uses the absolute change in open interest as a weighting factor for each price point
Creates a dynamic average that reflects where significant open interest activity has occurred during a given period
Standard deviation bands are computed from this weighted average to show the statistical spread of prices around the OIWAP line
Resets calculations based on user-selected time periods (daily, weekly, monthly, or session-based)
Allows for fresh analysis at regular intervals
Similar concept to volume-weighted average price (VWAP) indicators, but uses open interest changes as the weighting component
Features:
Weighted Average: Calculates a central line based on contract activity.
Flexible Anchors: Allows users to choose the reset period for the calculation.
Volatility Bands: Displays outer and mid-bands to visualize price stretches.
Data Check: Built-in alerts notify you if Open Interest data is missing for a symbol.
Visual Zones: Color-coded areas help identify price location at a glance.
How To Use
When you add the indicator to your chart, you will see:
A main OIWAP line — the open-interest-weighted price level
Mid-bands around the line (±0.5 standard deviations)
Outer bands farther away (±2.0 standard deviations)
Shaded background zones between these lines
You can:
Change the reset period to see how the average behaves over different time ranges
Adjust the timeframe for open-interest data
Turn mid-bands on or off
Adjust colors and styles to improve readability
Conclusion
The OIWAP indicator serves as an educational tool for visualizing the relationship between price movements and open interest activity in futures markets
Presents a weighted average price line along with statistical deviation bands
Offers a structured framework for chart analysis
Customizable settings allow users to adapt the display to their analytical preferences
Maintains focus on visual interpretation rather than directional predictions
Functions as a supplementary charting overlay that may complement other forms of technical and fundamental analysis
Disclaimer
This indicator is for educational and visual-analysis purposes only. It does not provide trading signals, financial advice, or guaranteed outcomes . You should perform your own research and consult a licensed financial professional when needed. All trading decisions are solely the responsibility of the user.
