[AlbaTherium] MTF External Ranges Analysis - ERA-Orion for SMC MTF External Ranges Analysis - ERA - Orion for Smart Money Concepts
Introduction:
The MTF External Ranges Analysis - ERA - Orion offers enhanced insights into multi-timeframe external structure points, swing structure points, POIs (Points of Interest), and order blocks (OB) . By incorporating this enhancement, your multi-timeframe analysis are streamlined, simplifying the process and reducing chart workload, no need for manual chart drawing anymore, stay focus on Low Time Frame and get High Time Frame insights in one single Time frame.
This identification process remains effective even when focusing on Lower Time Frames (LTF), providing detailed insights without sacrificing the broader market perspective.
The MTF External Ranges Analysis - ERA – Orion is specifically designed to be used in conjunction with OptiStruct™ Premium for Smart Money Concepts . This strategic combination enhances the workflow of identifying optimal entry points. OptiStruct acts as the analysis tool for Lower Time Frames (LTF), zeroing in on immediate interest areas, while Orion expands this analysis to Higher Time Frames (HTF), providing a broader view of market trends and importants key levels . The integration of Orion with OptiStruct seamlessly merges LTF and HTF analyses, ensuring a thorough understanding of market dynamics for informed and strategic decision-making. This toolkit in one package assembly is pivotal for traders relying on Smart Money Concepts, offering unmatched clarity and actionable insights to navigate the markets effectively.
This tool offers an advanced smart money technical analysis to improve your trading experience. It introduces four key concepts:
Main Features:
Entries Enhancements
Inducements HTF
High/Low Markings HTF
Multiple Timeframes and Confluences on Extreme, Dec and SMT Order Blocks
By integrating these concepts into one, traders can identify high-probability zones across multiple timeframes and develop a thorough understanding of market dynamics. These confluence zones enhance order block skills and potential, establishing them as essential pillars in smart money trading strategies and enabling traders to make more informed decisions.
Settings Overview:
HTF Settings Enable HTF Analysis
Select timeframe {Select or 4H Chart}
Labels Alignment for Lines and Boxes
Inside bar ranges HTF
Break of Structure /Change of Character HTF
Inducements HTF
High/Low Markings HTF
High/Low Sweeps HTF
Extreme Order Blocks HTF
Decisional Order Blocks HTF
Smart Money Traps HTF
IDM Demands and Supplies HTF
Historical Order Blocks HTF
OB Mitigation HTF {touch/ extended}
Understanding the Features:
Chapter 1: Entries Enhancements
In this chapter, we delve into strategies to refine trading entries, focusing on the multi-timeframe analysis of extreme or decisional order blocks in the High Time Frame timeframe as a key point of interest. We highlight the significance of transitioning to the Low Time Frame chart for observing pivotal shifts in market behavior. By examining these concepts, traders can gain deeper insights into market dynamics and make more informed entries decisions at critical junctures.
Practical Example:
We had an Order Block Extreme on the 1-hour timeframe, and currently, we are on the recommended chart for trade entry, which is the 5-minute timeframe. We are patiently waiting to observe a 5-minute ChoCh in the market to enter a buying position since it's an OB Extreme Demand on the 1-hour timeframe. Here, it's crucial and important to focus on the entry timeframe rather than checking what's happening in the higher timeframe. The indicator facilitates this task as it provides us with real-time perspective and visibility of everything happening in the higher timeframe.
Chapter 2: Inducements HTF
It is important and useful to be aware of the various liquidity points across the different timeframes we use; sometimes, a reliable entry point in the Lower Time Frame (LTF) may be surrounded by inducements. Consequently, this point becomes unreliable, and prior to the arrival of this functionality, such anomalies could not be detected, especially when focusing on the market in the LTF. From now on, there will be no more such issues.
Practical Example:
Suppose we identify an Order Block Extreme on the 5M timeframe, indicating a potential entry level. However, when we switch to the 5M timeframe to look for an entry point, we observe an accumulation of inducements around this Order Block coming from a higher timeframe, whether it's M15 or H1. This suggests a potential weakness in the entry point and significant market liquidity, which will act as a trap zone. Before the introduction of this feature, we might have missed this crucial observation, but now we can detect these anomalies and adjust our strategy accordingly.
The only practical way to see theses confluences is to use this Indicator, see the example below
Chapter 03: High/Low – Bos - ChoCh Markings HTF
The High/Low Markings HTF feature in the MTF External Ranges Analysis - ERA - Orion provides a comprehensive view into the market's heartbeat across different timeframes, right from within the convenience of the Lower Time Frame (LTF). It meticulously highlights pivotal shifts, allowing traders to seamlessly discern market sentiment and anticipate potential price reversals without needing to toggle between multiple charts. This innovation ensures that critical market movements and sentiment across various timeframes are visible and actionable from a single, focused LTF perspective, enhancing decision-making and strategic planning in trading activities.
Understanding High/Low Markings in HTF Analysis
High/Low Markings in High Time Frame (HTF) analysis mark the market's extremities within a given period, pinpointing potential areas for reversals or continuation and delineating crucial support and resistance levels. These markings are not arbitrary but represent significant market responses, serving as essential indicators for traders and analysts to gauge market momentum and sentiment.
The Role of HTF in Market Analysis
HTF analysis extends a comprehensive view over market movements, distinguishing between ephemeral fluctuations and substantial trend shifts. By scrutinizing these high and low points across wider time frames, analysts can unravel the underlying market momentum, enabling more strategic, informed trading decisions.
Identifying High/Low Markings
Identifying these crucial points entails detailed chart analysis over extended durations—daily, weekly, or monthly. The search focuses on the utmost highs and lows within these periods, which are more than mere points on a chart. They are significant market levels that have historically elicited robust market reactions, serving as key indicators for future market behavior.
Real-world Example:
Chapter 04: Multiple Timeframes and Confluences on Extreme, Dec and SMT Order Blocks Across HTF
The Orion indicator serves as a bridge between the multiple dimensions of the market, enabling a unified and strategic interpretation of potential movements. It's an indispensable tool for those seeking to capitalize on major opportunity zones, where the convergence of diverse perspectives creates ideal conditions for significant market movements.
Designed to navigate through the data of different timeframes and market analysis, Orion provides a clear and consolidated view of major points of interest. With this indicator, traders can not only spot opportunity zones where consensus is strongest but also adjust their strategies based on the dynamic interaction of various market participants, all while remaining within the Lower Time Frame (LTF).
Conclusion:
MTF External Ranges Analysis - ERA - Orion for Smart Money Concepts as “ The Orion ” indicator captures consensus among scalpers, day traders , swing traders, and investors, turning key areas into major opportunities. It allows for precise identification of areas of interest by analyzing the convergence of actions from various market participants. In short, Orion is crucial for detecting and leveraging the most promising points of convergence in the market.
This identification occurs even while focusing on Lower Time Frames (LTF), allowing for detailed insights without losing the broader market perspective.
This document provides an extensive overview of MTF External Ranges Analysis - ERA - Orion , emphasizing its importance in comprehending market dynamics and utilizing essential smart money concepts trading principles.
스크립트에서 "mtf"에 대해 찾기

(FireflyTA) Algo Score MTFAlgo Score MTF
The Algo Score MTF is a meta-analytic oscillator telling you about the technical market strength . It is analyzing a variety of different indicators and metrics to come up with a score that gives you an impression on whether the medium timeframes have fuel to go higher or if it's running out and the risk increases to see corrective price action.
----------------------
About Technical Market Strength
Algo measures the technical strength with a score between -10 and 10 . A bullish or bearish technical market strength shows a high correlation with bullish or bearish PA soon after the score reaches the significant levels deviating from 0. However, optimal treshold values (meaning the score after which the strength can be considered bullish or bearish) vary depending on the market looked at. For BTCUSD, the default values used can be seen as reference. If you want to apply Algo to other markets, you will have to calibrate the tresholds yourself.
It is important to know that market strength is the fuel to drive price higher or lower, but it is not the trigger. The trend is of superior importance. So when price is in a strong uptrend (in this case on the MTF), and the score reaches a value of -4 or lower (which can be considered bearish), it can still take a while for the trend to shift because of the strong momentum. The score in this case can be used as an indicator to show you times when it is wise to take profits / de-risk or take extra care in your risk management in general.
----------------------
Indicators used
All the indicators mentioned are calculated separately and weighted by the significance value you can customize in the indicator UI. It is also possible to (1) deactivate certain indicators and (2) force them as required, so that a signal in the oscillator only occurs when the indicator(s) that is/are required support the thesis (bullish vs. bearish).
Daily VWAP
MTF Trend
Traditional Bollinger Bands
RSI
MTF RSI Divergence
Stoch RSI
Ichimoku Cloud
Fib Retracement Levels
MACD
TTM Squeeze
Moneyflow
Custom Levels you can define (3 categories: Major, medium, minor)
For some indicators, there are specific settings to customize how they contribute to the overall score (i.e. MACD cross vs. shift vs. trending phase). It is also important to know that Algo fetches the indicator data from multiple timeframes, thereby adding reliability to the overall results.
----------------------
Algo Custom Logic
Algo is using my custom logic on when a certain indicator can be interpreted as bullish or bearish in the MTF horizon. If you want to find out about the reliability of certain indicators, I recommend disabling all the indicators except for the one you want to examine, and then see how the score reacts to price action.
----------------------
Timeframes
Due to script limitations, this version can only analyze the medium timeframes . It is best used with charts 2H+, it works on some 90m as well but ceases to work at 1H and below . It is also not compatible with higher timeframes . Upon using the same settings on the same ticker with different timeframes, you will see that the score shows a minor variance. This is because data is consolidated to match the timeframe, so it ultimately leads to minor differences. Find out for yourself what timeframe is the best to use with which market and which settings.
----------------------
How to Use
I'm going to add tooltips for the settings in the indicator UI with upcoming updates, so it becomes more clear on how to set Algo up properly. To prevent a loss of your customized settings, write them down somewhere in case a script update reverts the settings back to default.
You can find in-depth tutorials on how to use this indicator by browsing the links and resources in my signature.

MA-SS ( EMA SSL ) Indicator StudyThe MA-SS Indicator is a simple yet effective indicator using a combination of EMAs and SSL channel, utilising higher time frame data to help confirm trend/ price direction.
How does it work?
The Indicator consists of;
- 3 x EMAs – The 3rd EMA being a filter EMA
- Multi Time Frame EMA (This is an additional filter EMA which can be switched on and off)
- Multi Time Frame SSL Channel (This acts as a filter and can also be switched on and off)
The concept initially began as a simple EMA crossing indicator, but adding an MTF EMA plus a MTF SSL channel for additional filtering, helped to give a better indication of trend and ultimately filter out several bad trades.
- EXAMPLE: If price is …
o below the MTF EMA filter
o The MTF SSL Channel is red
o White and blue EMAs cross below the yellow (filter) EMA in the red SSL channel
> …a short is fired!
- (Opposite scenario for longs)
- Your stop loss would ideally be the top/ bottom of the SSL channel (either the MTF SSL channel or a standard SSL channel added manually to the chart), or, go for a clear pivot point or support/ resistance level.
- Take profit is yours to decide but I opt for a 1:1.5 risk/reward ratio. You could also use the MTF SSL channel to gauge when you should exit your trade (i.e. if you're in a long, wait for the SSL channel to flip red).
I will also have a strategy script available for this indicator.
Any questions please fire away in the comments.

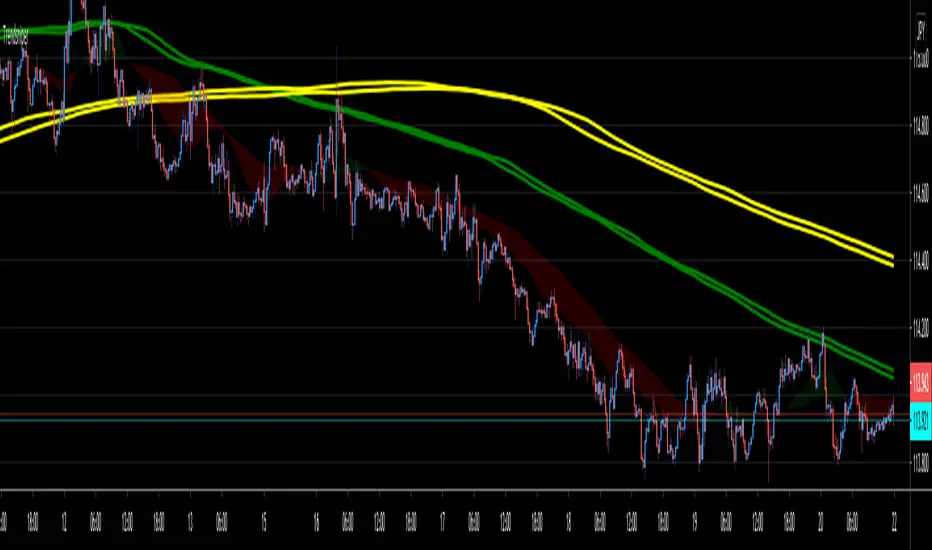
TrendsniperTrendsniper is an indicator built with MTF / 3D capability from the seconds to the weekly chart. It uses 2 key simple moving averages for MTF; the 20 and 21 with the zone fill using the 8 21 cross. We have incorporated the sma to avoid the whipsaw factor that an ema has so one can allow to stay in a trade while the trend remains as noted on the higher time frames and visible with MTF.
The longer time frame MTF moving averages give you a picture of the overall trend allowing trader to objectively trade using them to measure potential reversals and price strength. You will see that every SMA has time designations such as "15S1M" which would mean that that specific SMA is for the local time frame of 15seconds with 1M mtf inclusion. 15M60M would mean that that SMA is for the 15M local time frame chart with 60M mtf inclusion; meaning you're able to see the 60M (60minute) SMA on your 15M (15minute) chart. The same goes for the other SMAs noted in Trendsniper.
You will also notice that moving averages function as support and resistance and MTF moving averages may clearly note that on the chart.
A simple moving average is a technical indicator that can aid in determining if an asset price will continue or if it will reverse a bull or bear trend. We have used the 8, 20, 21 SMAs in this indicator to assist one with identifying the existing trend and exiting a trade when his/her conditions as a trader are met.
Algorithm Builder - Single Trend+ (MTF)Hello traders
I. SCRIPTS ACCESS AND TRIALS
1. For the trial request access, they have to be done through my website .
2. My website URL is in this script signature at the very bottom (you'll have to scroll down a bit and going past the long description) and in my profile status available here : Daveatt
Due to the new scripts publishing house rules, I won't mention the URL here directly. As I value my partnership with TradingView very much, I prefer showing you the way for finding them :)
3. You may also contact me directly for more information
II. Algorithm Builder - Single Trend+ (MTF)
2.1 Concept
MTF means Multi Timeframes - we all agree that saying MTF is nicer and easier than multi-timeframe.
That script is an upgrade of the Single Trend:
The Algorithm Builder - Single Trend+ (Multiple Timeframes/MTF) is made to detect the convergence of many unrelated indicators, and give a BUY or SELL signal whenever all the selected sub-indicators - each may be using a different timeframe - are converging in the same direction.
Now sit tight because what's going to be announced will be awesome. Are you ready for it?... :)
The MTF version allows to detect the convergence for indicators in different timeframes. Each indicator has its own timeframe - expanding, even more, your trading analysis capabilities.
In other words, you could, for instance, detects the convergence of an H1 MACD with an H2 Supertrend, and why not also adding an m30 Moving Averages cross in the mix.
The Single Trend+ MTF gives one single entry per identified trend - unlike the Multiple Trends editions (also available on my scripts page) which may give more than 1 entry per trend.
The traders select the sub-indicators they want, and see in real-time the BUY and SELL triangles being updated.
2.2 Why the Algorithm Builder Single Trend may help you
I worked with many traders during my career, and their feedback about trading is often pretty similar.
They all tried a lot of complicated indicators, losing their capital, and finally getting back to the basics (even to the basic indicators if I might say)
The art is finding a good combination of indicators and setting strict money/risk management rules.
Easy in concept, but more than 90+% of traders lose money on the markets... which teach us that trading is not only about drawing trendlines, or using cool indicators but finding ways to ease our psychology while trading.
2.3 The Algorithm Builder trading framework
The sub-indicators (full list on our website) weren't chosen randomly. They're based on a trading method we've developed over the last 6 years - while working with traders and other trading quants.
The Algo Builders are made to detect a convergence - and as such, will give a signal once a trend has been identified.
They're not made to detect reversal but have been designed to give a signal when all sub-indicators are either ALL bullish (green) or ALL bearish (red).
We provide a framework based on indicators we selected because they:
1. make sense to be used altogether
2. work on asset classes like INDEX, CRYPTO, STOCK OPTIONS, FOREX, COMMODITIES
3. it may expand your knowledge about what detecting a convergence with pre-selected indicator really means
2.3.1 Supports and Resistances
The indicator displays the main algorithmic supports and resistances according to our trading method.
I think they're relevant for all asset classes, but you're absolutely free to use any different supports/resistances logic if you want to.
I'm not against it because I know that pivots, Fibonacci levels, etc. may work very well also.
2.3.2 Choose your favorite risk management algorithm
1/ Pre-defined Algo S/R method using:
- a supertrend of the stop-loss
- the nearest algorithmic resistances for the take profit levels.
2/ Define your own Stop-loss and Take-profits level in real-time
Stop-Loss Management
For what's following, let's assume that 2 is the stop-loss value you inserted in the indicator, and the Algorithm Builder gives a BUY signal.
This is NOT a recommendation at all, only an example to explain how this feature works.
- %Trailing: The Stop-Loss starts 2% away from the entry price - and will move up (because we're on a BUY trade as per our example) every time your trade will gain 2% profit
- Percentage: The Stop-Loss stays static 2% away from the entry price. There is no trailing here
- TP Trailing: This is a very awesome feature. The stop-loss is set 2% away when the trades start.
When the TP1 is hit, the stop-loss will be moved to the Entry price (also called breakeven).
When the TP2 is hit, the SL is moved to the previous TP1 position
- Fixed: Set the Stop-Loss at a fixed position (value should be in currency/units)
Take Profits Management
You can manage up to 2 take profit levels defined as a percentage or price value.
The expected input is in percentage value (for instance, setting the % target of TP1 to 2% will set the TP1 level 2% away from the entry price
2.3.3 Built-in Trade Manager
This is very likely the most loved utility script that we shared on TradingView.
It's included in your Algorithm Builder - Single Trend+, and will certainly help you immensely to analyze your charts and your trades.
We made sure that all the graphical elements on the chart will be updated in real-time whenever our user change anything on the indicator configuration.
You'll also be able to change the Trade Manager labels positions as you wish :)
2.3.4 Built-in Risk-to-Reward Panel
The good stuff doesn't stop here.
You'll notice that this sometimes green (when in a LONG), sometimes red (when in a SHORT) panel at the right of your chart.
It displays for the selected trading algorithmic (see 2.3.2 above), a ton of useful real-time analytics.
- Entry Price: the price when the Algorithm Builder will give a signal.
- The Trade PnL in percentage.
- Entry Stop Loss: Distance (in currency/units) between the selected stop-loss algorithm (percent, trailing, TP trailing, etc.) and the entry price.
- Entry TP1: Distance (in currency/units) between the entry price and the first take profit
- Entry TP2: Distance (in currency/units) between the entry price and the second take profit
- Risk/Reward TP1: Using the Stop-loss distance at entry, and Take Profit 1 at entry to compute the risk-to-reward ratio.
- Risk/Reward TP2: Using the Stop-loss distance at entry, and Take Profit 2 at entry to compute the risk-to-reward ratio.
For more details, please check the guides section of my website. Links are in my signature and profile status.
2.3.5 Hard Exits
Our trading method is known for the hard exits, also called invalidation.
The Single Trend+ includes a hard exit based on a MACD - settings are flexible and you may update them.
Having a stop-loss protecting your trade is a best practice - Protecting your stop-loss also from getting hit is incredible.
We prefer invalidate a few positions, even if sometimes we don't want to. Rather than the market hard exiting on us, and leaving with our hard-working money.
2.3.6 Alerts
Alerts are enabled for:
- BUY/SELL triangles signals
- Trade Manager (SL, TP1, TP2)
- Hard Exits
III. Pain points that we're trying to solve with our Algorithm Builders
Issue #1 There are many informations / indicators / strategies / backtests / noise. Finding the right ones is not a simple task.
Solution #1 A reliable system that removes the external noise is much needed in trading to stay "in the game".
Issue #2 Trading could be quite stressful - The majority doesn't lose in trading because technical analysis is hard, but because managing our psychology is one of the hardest things a human can do.
Solution #2 Some ways to reduce the "trading stress" could be: getting better quality signals and trading like a "machine". Forgetting about Twitter and trusting the system you designed.
Issue #3 Trading without strict rules and only based on what we feel, or what we think the market should do is the fastest way to kiss our money goodbye.
Only 1 indicator generally is not enough. Traders generally use a combination of several indicators but they're monitoring them individually.
It's normal then to feel exhausted at the end of the day ^^ (to say the least)... and exhaustion leads to mistakes which leads to..... (I'm sure you got it) ... capital loss.
Solution #3 As a trader, I needed a trading framework and a method. I offer our trading method but they're plenty others out there. We cannot claim obviously it's the best ever ....but let's say we're using those exact same
scripts ourselves for our trading. And this what we've been recommending our clients to trade with for the past years. Also, having a tool detecting the convergence of several indicators and giving 1 unique signal
for BUY/SELL position will save you a lot of time/energy, and perhaps might help you out getting better trading performance.
III. Resolving a complex puzzle and having fun in the process
Trading has to stay a passion and not (only be) a source of intense stress.
The most successful traders I know are "trading geeks" - literally always looking for optimizing, searching for the best possible entries, setups, indicators, tools, etc.
For them, it's not even about the money anymore, but only about beating their previous performance.
Why are they doing this? Because it's fun
Might appears as a bold statement, but I guarantee that looking for setups is fun.
One of our users even told us, that it's like playing with "Legos" and we couldn't possibly agree more.
IV. Designing a system that "makes sense"
Another bold statement now. Brace yourselves ladies and gentlemen
The Algorithm Builders allow to design trading systems quickly. What could takes days/weeks/months to find out... might be now within your reach in less than a few hours.
With a bit of practice, less than an hour might be enough per asset/timeframe to find a system that makes sense to you and adapted to your trading capital and psychology.
Assuming our users read our guides and are fully committed to learning a new way of trading - then we do guarantee you'll be able to design kick-ass trading systems that make sense.
"Making sense" doesn't mean at all it's guaranteed to win, it means you're the one defining the convergence of indicators, using your Algorithm Builder, and observe that most of the time - whenever there is a BUY signal, the candlesticks are going upwards - whenever there is a SELL signal, it's going downwards.
This is a necessary step to make real progress from a trading analyst perspective - and hopefully could lead to profits.
V. Algorithm Builder versus the main trader enemy(=psychology)
This indicator has the goal to help solving one of the MAIN issues encountered by traders.
Most of traders realize, they can't perform with only 1 indicator (or 1 price pattern or 1 price action) and need a combination of multiple indicators before getting in a trade.
Far from being a magic pill, if it could at least reduce the stress you have while trading, then we'll consider we made a great job - it's a technical "useless noise remover", and needs to be followed strictly.
Such trust in a trading system can only be built by testing your Algorithm Builder configuration on either:
1. a demo account
2. or a live account with small bids. And then, increasing progressively the bids if your capital increases progressively.
Though, you should still use your common sense. (for instance: if we get a BUY signal right on a big timeframe resistance we're hitting for the first time).
I'm aware this is a new way of trading but for many, and while we cannot foresee the future, neither predict performance, we believe it might save you a lot of time to find good signals.
My maximum level of happiness will be reached the day when our users will contact me and showing me setups being mine.
I'm sure that even I can learn from my users and, we can all learn from each other Algorithm Builder configuration
VI. What is a wrong or bad configuration?
Simply put. If you see that most of your signals react such as described below:
1. a buy triangle predicts, most of the time an upwards move
2. a sell triangle predicts, most of the time a downwards move
3. you estimated yourself the stop-loss needed to give enough room for your trades.
4. take profits based on algorithmic support and resistances or your own take profit method.
So what's a good Algorithm Builder configuration? A configuration you're happy with and makes sense.
A better Algorithm Builder setup is one used in demo or a live account w/ small bids for a few weeks, and you're consistent in your trading performance.
If you have any doubt or question, please hit me up directly or ask in the comments section of this script.
I'll never claim I have the best trading methodology or the best indicators. You only will be the judge, and I'll appreciate all the questions and feedback you're sending my way.
They help me a ton to develop indicators based on all the requests I received.
Kind regards,
Dave

Emas cryptosmart strategy (Multi-MA + MTF)Core Concept: Aligning Two Timeframes
The fundamental purpose of this indicator is to solve the most common problem in trading: fighting the main trend.
It achieves this by visualizing two "universes" of trend data at the same time on a single chart:
The Immediate Trend (Your Current Chart): This is shown by the color of the candles.
The Dominant Trend (Higher Timeframe): This is shown by the "Long/Short" labels.
By separating these two signals, the indicator allows you to see when your short-term trend (your candles) aligns with the long-term trend (the labels), giving you a high-probability confluence signal.
Detailed Components and Logic
The indicator is divided into four systems that work together.
1. The Dual Moving Average Sets (The 8 Lines)
The indicator calculates two identical sets of four moving averages (MA Fast, Mid, Slow, Ex-Slow).
Set 1: Current Timeframe MAs (Solid Lines)
These 4 MAs react to every candle on the chart you are currently watching (e.g., 1-Hour).
They show you the immediate price structure and trend.
Their sole job is to define the color of your candles.
Set 2: Multi-Timeframe (MTF) MAs (Stepped Lines)
You can toggle this set on or off with the Use MAs from Another Timeframe checkbox.
It calculates the same 4 MAs but using data from a higher timeframe you choose (e.g., 1-Day).
These lines look "stepped" or "blocky" because they represent the dominant trend.
Their sole job is to define when the "Long" and "Short" labels appear.
2. 🧠 The Candle Coloring Logic (Your Current Trend)
This is the first part of the core logic:
The candle color (barcolor) is based exclusively on the MAs from the current timeframe.
The Source for Signal and Color menu lets you choose which crossover on your current timeframe defines the trend.
"Fast / Mid": Candles are green if the Fast MA is above the Mid MA.
"Price / Slow": Candles are green if the Price is above the Slow MA.
Result: This gives you an instant read on the short-term trend. If the candles are green, the micro-trend is bullish.
3. The Signal/Label System (Your Main Trend Filter)
This is the second and most important part of the logic:
The "Long" and "Short" labels (label.new) are based exclusively on the MAs from the higher timeframe (MTF) (assuming useMTF is checked).
If you choose "Fast / Mid" as your source and your MTF is "Daily," a "Long" label will only appear when the Daily Fast MA crosses above the Daily Mid MA.
Result: The labels act as a major trend filter. They don't give you an immediate entry signal, but rather tell you, "The wind is at your back to look for buys" ("Long" label) or "The wind is against you" ("Short" label).
4. Advanced Customization (The Inputs)
This indicator gives you full control over every component:
MA Type: You can change all 8 lines from EMA to SMA, WMA, VWMA, or SMMA (RMA), allowing you to test which MA type best fits your strategy.
Visibility: You can hide or show any of the 8 MA lines independently (both current and MTF) to keep your chart clean.
Additional Filter: The Use Trend Filter checkbox adds an extra layer of safety to the labels, requiring the price to also be above the slow MTF MA to confirm the signal.
Aesthetics: You can fully control the style, size, and distance (based on ATR) of the labels so they don't clutter the price.
How To Use the Indicator (Strategy)
The true power of this indicator is seen when you combine its signals:
High-Probability Buy (Long) Scenario:
A "Long" label appears on your chart. This confirms your main trend (e.g., Daily) is bullish. This is your bias.
You ignore all sell signals.
The price pulls back on your current timeframe (e.g., 1-Hour), causing the candles to turn red.
You wait. When the 1-Hour trend realigns with the Daily trend, the candles flip back to green.
This candle color change (from red to green) while the "Long" label is present is your high-confluence entry signal.
"Bull Trap" Scenario (That the Indicator Helps You Avoid):
You are on a 1H chart and the candles turn green (micro-trend is bullish).
You look at the background and see there is no "Long" label (or worse, there is a "Short" label from the Daily trend).
Conclusion: The indicator is visually warning you that this bullish move is likely just a pullback/rally within a larger bearish trend. It saves you from buying into a "bull trap."

Dynamic Market Structure (MTF) - Dow TheoryDynamic Market Structure (MTF)
OVERVIEW
This advanced indicator provides a comprehensive and fully customizable solution for analyzing market structure based on classic Dow Theory principles. It automates the identification of key structural points, including Higher Highs (HH), Higher Lows (HL), Lower Lows (LL), and Lower Highs (LH).
Going beyond simple pivot detection, this tool visualizes the flow of the trend by plotting dynamic Breaks of Structure (BOS) and potential reversals with Changes of Character (CHoCH). It is designed to be a flexible and powerful tool for traders who use price action and trend analysis as a core part of their strategy.
CORE CONCEPTS
The indicator is built on the foundational principles of Dow Theory:
Uptrend: A series of Higher Highs and Higher Lows.
Downtrend: A series of Lower Lows and Lower Highs.
Break of Structure (BOS): Occurs when price action continues the current trend by creating a new HH in an uptrend or a new LL in a downtrend.
Change of Character (CHoCH): Occurs when the established trend sequence is broken, signaling a potential reversal. For example, when a Lower Low forms after a series of Higher Highs.
CALCULATION METHODOLOGY
This section explains the indicator's underlying logic:
Pivot Detection: The indicator's core logic is based on TradingView's built-in ta.pivothigh() and ta.pivotlow() functions. The sensitivity of this detection is fully controlled by the user via the Pivot Lookback Left and Pivot Lookback Right settings.
Structure Calculation (BOS/CHoCH): The script identifies market structure by analyzing the sequence of these confirmed pivots.
A bullish BOS is plotted when a new ta.pivothigh is confirmed at a price higher than the previous confirmed ta.pivothigh.
A bearish CHoCH is plotted when a new ta.pivotlow is confirmed at a price lower than the previous confirmed ta.pivotlow , breaking the established sequence of higher lows.
The logic is mirrored for bearish BOS and bullish CHoCH.
Invalidation Levels: This feature identifies the last confirmed pivot before a structure break (e.g., the last ta.pivotlow before a bullish BOS) and plots a dotted line from it to the breakout bar. This level is considered the structural invalidation point for that move.
MTF Confirmation: This unique feature provides confluence by analyzing a second, lower timeframe. When a pivot (e.g., a Higher Low) is confirmed on the main chart, the script requests pivot data from the user-selected lower timeframe. If a corresponding trend reversal is detected on that lower timeframe (e.g., a break of its own minor downtrend), the pivot is labeled "Firm" (FHL); otherwise, it is labeled "Soft" (SHL).
KEY FEATURES
This indicator is packed with advanced features designed to provide a deeper level of market insight:
Dynamic Structure Lines: BOS and CHoCH levels are plotted with clean, dashed lines that dynamically start at the old pivot and terminate precisely at the breakout bar, keeping the chart clean and precise.
Invalidation Levels: For every structure break, the indicator can plot a dotted "Invalidation" line (INV). This marks the critical support or resistance pivot that, if broken, would negate the previous move, providing a clear reference for risk management.
Multi-Timeframe (MTF) Confirmation: Add a layer of confluence to your analysis by confirming pivots on a lower timeframe. The indicator can label Higher Lows and Lower Highs as either "Firm" (FHL/FLH) if confirmed by a reversal on a lower timeframe, or "Soft" (SHL/SLH) if not.
Flexible Pivot Detection: Fully adjustable Pivot Lookback settings for the left and right sides allow you to tune the indicator's sensitivity to match any timeframe or trading style, from long-term investing to short-term scalping.
Full Customization: Take complete control of the indicator's appearance. A dedicated style menu allows you to customize the colors for all bullish, bearish, and reversal elements, including the transparency of the trend-based candle coloring.
HOW TO USE
Trend Identification: Use the sequence of HH/HL and LL/LH, along with the trend-colored candles, to quickly assess the current market direction on any timeframe.
Entry Signals: A confirmed BOS can signal a potential entry in the direction of the trend. A CHoCH can signal a potential reversal, offering an opportunity to enter a new trend early.
Risk Management: Use the automatically plotted "Invalidation" (INV) lines as a logical reference point for placing stop losses. A break of this level indicates that the structure you were trading has failed.
Confluence: Use the "Firm" pivot signals from the MTF analysis to identify high-probability swing points that are supported by price action on multiple timeframes.
SETTINGS BREAKDOWN
Pivot Lookback Left/Right: Controls the sensitivity of pivot detection. Higher numbers find more significant (but fewer) pivots.
MTF Confirmation: Enable/disable the "Firm" vs. "Soft" pivot analysis and select your preferred lower timeframe for confirmation.
Style Settings: Customize all colors and the transparency of the candle coloring to match your chart's theme.
Show Invalidation Levels: Toggle the visibility of the dotted invalidation lines.
This indicator is a powerful tool for visualizing and trading with the trend. Experiment with the settings to find a configuration that best fits your personal trading strategy.

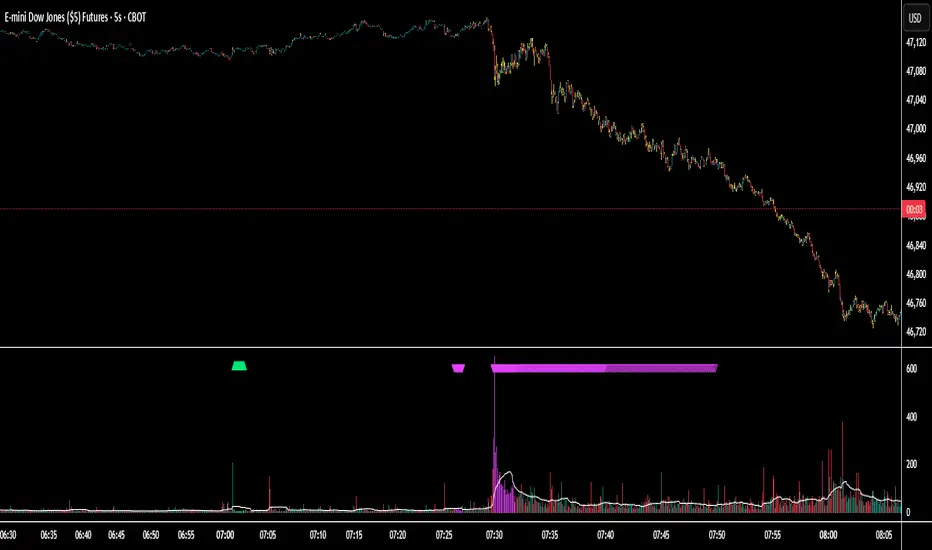
Session Volume Spike Detector (MTF Arrows)Overview
The Session Volume Spike Detector is a precision multi-timeframe (MTF) tool that identifies sudden surges in buy or sell volume during key market windows. It highlights high-impact institutional participation by comparing current volume against its historical baseline and short-term highs, then plots directional markers on your chart.
This version adds MTF awareness, showing spikes from 1-minute, 5-minute, and 10-minute frames on a single chart. It’s ideal for traders monitoring microstructure shifts across multiple time compressions while staying on a fast chart (like 1-second or 1-minute).
Key Features
Dual Session Windows (DST-aware)
Automatically tracks Morning (05:30–08:30 MT) and Midday (11:00–13:30 MT) activity, adjusted for daylight savings.
Directional Spike Detection
Flags Buy spikes (green triangles) and Sell spikes (magenta triangles) using dynamic volume gates, Z-Score normalization, and recent-bar jump filters.
Multi-Timeframe Projection
Displays higher-timeframe (1m / 5m / 10m) spikes directly on your active chart for continuous visual context — even on sub-minute intervals.
Adaptive Volume Logic
Each spike is validated against:
Volume ≥ SMA × multiplier
Volume ≥ recent-high × jump factor
Optional Z-Score threshold for statistical significance
Session-Only Filtering
Ensures spikes are only plotted within specified trading sessions — ideal for futures or intraday equity traders.
Configurable Alerts
Built-in alert conditions for:
Any timeframe (MTF aggregate)
Individual 1m, 5m, or 10m windows
Alerts trigger only when a new qualifying spike appears at the close of its bar.
Use Cases
Detect algorithmic or institutional activity bursts inside your trading window.
Track confluence of volume surges across multiple timeframes.
Combine with FVGs, bank levels, or range breakouts to identify probable continuation or reversal zones.
Build custom automation or alert workflows around statistically unusual participation spikes.
Recommended Settings
Use on 1-minute chart for full MTF display.
Adjust the SMA length (default 20) and Z-Score threshold (default 3.0) to suit market volatility.
For scalping or high-frequency environments, disable the 10m layer to reduce visual clutter.
Credits
Developed by Jason Hyde
© 2025 — All rights reserved.
Designed for clarity, precision, and MTF-synchronized institutional volume detection.
RSI Divergence + MTF PanelRSI Divergence + MTF Panel
📊 Short Description
A powerful indicator for detecting RSI divergences with a multi-timeframe panel that helps traders find high-quality trading opportunities across different time intervals.
✨ Key Features
🎯 Automatic Divergence Detection
- **Bullish Divergence**: Price makes lower lows while RSI makes higher lows
- **Bearish Divergence**: Price makes higher highs while RSI makes lower highs
- Visual divergence marking with lines on the chart
- Customizable colors and line styles
📈 Multi-Timeframe Panel (MTF)
- Displays RSI from 4 fixed timeframes simultaneously (5m, 15m, 1H, 4H)
- Color-coded RSI levels:
- 🔴 Red: RSI > 70 (overbought)
- 🟢 Green: RSI < 30 (oversold)
- ⚪ White: RSI between 30-70 (neutral zone)
⚙️ Flexible Settings
- RSI period (default 14)
- Divergence detection threshold
- Data source selection (close, hl2, hlc3, ohlc4)
- Color and transparency customization
- Enable/disable indicator components
📋 How to Use
1. **Add the indicator to your chart** - it will automatically start scanning for divergences
2. **Adjust parameters** to match your trading style
3. **Monitor the MTF panel** for overall market condition overview
4. **Look for divergences** combined with other signals for confirmation
🎯 Perfect for:
- Swing trading
- Intraday trading
- Finding reversal points
- Confirming trading signals
- Multi-timeframe analysis
⚡ Advantages
- **Automation**: No need to manually search for divergences
- **Multi-functionality**: RSI analysis + MTF overview in one indicator
- **Visual clarity**: Clear signals and color coding
- **Performance**: Optimized code for fast operation
- **Flexibility**: Wide customization options
📊 Technical Details
- Uses standard RSI with customizable period
- Divergence detection algorithm based on peaks and valleys
- MTF panel updates in real-time
- Supports all asset types (stocks, forex, crypto, commodities)
🔧 Usage Recommendations
- Combine with other indicators for signal confirmation
- Consider overall market trend
- Use risk management rules
- Test settings on historical data
👥 Suitable for:
- Beginners (easy to use)
- Experienced traders (flexible settings)
- All trading styles and timeframes
---
*This indicator is designed to enhance trading efficiency and help make informed trading decisions. Always follow risk management rules and don't rely on just one indicator.*

S&R Zones MTF (TechnoBlooms)S&R Zones MTF – Multi-Timeframe Support & Resistance Boxes
🔍 Overview
S&R Zones MTF is a professional-grade yet beginner-friendly indicator that dynamically plots Support & Resistance zones across multiple timeframes, helping traders recognize high-probability reversal areas, entry confirmations, and price reaction points.
This tool visualizes structured zones as colored boxes, allowing both new and experienced traders to analyze multi-timeframe confluence with ease and clarity.
🧠 What Is This Indicator?
S&R Zones MTF automatically detects the most significant support and resistance levels from up to four custom timeframes, using a configurable lookback period. These zones are displayed as colored horizontal boxes directly on the chart, making it easy to:
Spot where price has historically reacted
Identify potential reversal or breakout zones
Confirm entries with institutional-style precision
🛠️ Key Features
✅ Multi-Timeframe Zone Detection (up to 4 timeframes)
📦 Auto Plotted Boxes for Support (Blue) & Resistance (Pink)
🧱 Dynamic Height based on average price range or fixed input
🏷️ Timeframe Labels to instantly identify zone origin
🎛️ Customizable inputs: Lookback length, box color, height style
🔁 Real-time updates as price structure changes
🎓 Educational & Easy to Use
Whether you’re a new trader learning about price structure, or a professional applying institutional concepts, this tool offers an educational layout to understand:
How price respects historic zones
Why multi-timeframe zones offer stronger confluence
How to use zones for entry, exit, or risk placement
📈 How to Use (Multi-Timeframe Strategy)
Select Your Timeframes – Customize up to 4 higher timeframes (e.g., 1m, 5m, 15m, 1h).
Observe Overlapping Zones – When multiple timeframes agree, those zones are more significant.
Entry Confirmation – Wait for price to reach a zone, then look for reversal patterns (engulfing candle, pin bar, etc.)
Combine with Other Tools – Use alongside indicators like RSI, MACD, or Order Blocks for added confidence.
💡 Pro Tips
Zones from higher timeframes (1H, 4H) are often more powerful and reliable.
Confluence matters: If a 15m support zone aligns with a 1H support zone — that's a high-probability reaction area.
Use break-and-retest strategies with zone rejections for sniper entries.
Enable "Auto Height" for a more adaptive, volatility-based zone display.
🌟 Summary
S&R Zones MTF blends precision, clarity, and professional analysis into a visual structure that’s easy to understand. Whether you're learning support & resistance or optimizing your MTF edge — this tool will bring clarity to your charts and confidence to your trades.

Super MTF Clouds (4x3 Pairs)Overview:
This script is based on Ripster's MTF clouds, which transcends the standard moving average cloud indicator by offering a powerful and deeply customizable Multi-Timeframe (MTF) analysis. Instead of being limited to the moving averages of your current charts from the current timeframe, this tool allows you to project and visualize the trend and key support/resistance zones from up to 4 different timeframes simultaneously. User can input up to 6 different EMA values which will form 3 pairs of EMA clouds, for each of the timeframes.
The primary purpose is to provide traders with immediate confluence. By observing how price interacts with moving average clouds from higher timeframes (e.g., Hourly, Daily, Weekly), you can make more informed decisions on your active trading timeframe (e.g., 10 Minute). It's designed as a complete MTF Cloud toolkit, allowing you to display all necessary MTFs in a single script to build a comprehensive view of the market structure without having to flick to different timeframe to look for cloud positions.
Key features:
Four Independent Multi-Timeframe Slots: Each slot can be assigned any timeframe available on TradingView (e.g., D, W, M, 4H).
Three MA Pairs Per Timeframe: For each timeframe, configure up to three separate MA clouds (e.g., a 9/12 EMA pair, a 20/50 EMA pair, and a 100/200 SMA pair).
Complete Customisation: For every single moving average (24 in total), you can independently control:
MA Type: Choose between EMA or SMA.
Length: Any period you require.
Line Color: Full colour selection.
Line Thickness: Adjust the visual weight of each line.
Cloud Control: For every pair (12 in total), you can set the fill colour and transparency.
How To Use This Script:
This tool is best used for confirmation and context. Here are some practical strategies that one can adopt:
Trend Confluence: Before taking a trade based on a signal on your current timeframe, glance at the higher timeframe clouds. If you see a buy signal on the 15-minute chart and the price is currently trading above a thick, bullish Daily cloud, the probability of that trade succeeding is significantly higher. Conversely, shorting into strong HTF support is a low-probability trade.
Dynamic Support & Resistance: The edges of the higher timeframe clouds often act as powerful, dynamic levels of support and resistance. A pullback to the 4-Hour 50 EMA on your 15-minute chart can be a prime area to look for entries in the direction of the larger trend.
Gauging Market Regimes: Use the toggles in the settings to quickly switch between different views. You can have a "risk-on" view with short-term clouds and a "macro" view with weekly and monthly clouds. This helps you adapt your trading style to the current market conditions.
Key Settings:
1. Global Setting
Source For All MAs: This determines the price data point used for every single moving average calculation.
Default: hl2 (an average of the High and Low of each bar). This gives a smooth midpoint price.
Options: You can change this to Close (the most common method), Open, High, Low, or ohlc4 (an average of the open, high, low, and close), among others.
Recommendation: For most standard trend analysis, the default hl2 is the common choice.
2. The Timeframe Group Structure
The rest of the settings are organized into four identical, collapsible groups: "Timeframe 1 Settings" through "Timeframe 4 Settings". Each group acts as a self-contained control panel for one multi-timeframe view.
Within each timeframe group, you have two master controls:
Enable Timeframe: This is the main power switch for the entire group. Uncheck this box to instantly hide all three clouds and lines associated with this timeframe. This is perfect for quickly decluttering your chart or focusing on a different set of analyses.
Timeframe: This dropdown menu is the heart of the MTF feature. Here, you select the higher timeframe you want to analyse (e.g., 1D for Daily, 1W for Weekly, 4H for 4-Hour). All calculations for the three pairs within this group will be based on the timeframe you select here.
3. Pair-Specific Controls
Inside each timeframe group, there are three sections for "Pair 1", "Pair 2", and "Pair 3". These control each individual moving average cloud.
Enable Pair: Just like the master switch for the timeframe, this checkbox turns a single cloud and its two MA lines on or off.
For each pair, the settings are further broken down:
Moving Average Lines (A and B): These two rows control the two moving averages that form the cloud. 'A' is typically used for the shorter-period MA and 'B' for the longer-period one.
Type (A/B): A dropdown menu to select either EMA (Exponential Moving Average) or SMA (Simple Moving Average). EMAs react more quickly to recent price changes, while SMAs are smoother and react more slowly.
Length (A/B): The lookback period for the moving average (e.g., 21, 50, 200).
Color (A/B): Sets the specific colour of the MA line itself on your chart.
Cloud Fill Settings
Fill Color: This controls the colour of the shaded area (the "cloud") between the two moving average lines. For a consistent look, you can set this to the same colour as your shorter MA line.
Transparency: Controls how see-through the cloud is, on a scale of 0 to 100. 0 is a solid, opaque colour, while 100 is completely invisible. The default of 85 provides a light, "cloud-like" appearance that doesn't obscure the price action.
----------------------------------------------------------------------
If anything is not clear please let me know!

BG Ichimoku Tenkan MTFBG Ichimoku Tenkan MTF: Your Multi-Timeframe Trend Compass
Elevate your Ichimoku analysis with the BG Ichimoku Tenkan MTF indicator. This powerful tool provides a comprehensive view of the Tenkan-sen (Conversion Line) across multiple timeframes, helping you identify trends and potential shifts with greater clarity. It's ideal for all markets, including stocks, cryptocurrencies, Forex, and futures.
Key Features:
Main Tenkan-sen Plot: Visualize the Tenkan-sen for your active chart timeframe with adjustable color.
Multi-Timeframe Table: A dynamic table displays the Tenkan-sen's relationship to price (🔼 for above, 🔽 for below) and its current value for up to 7 timeframes.
Continuous MTF Lines: Plot the Tenkan-sen from higher timeframes directly on your current chart, providing clear support/resistance levels and trend confluence.
Fully Customizable Colors: Personalize the color for each individual timeframe in the table and for its corresponding MTF line, ensuring a clean and intuitive visual experience. You can also adjust the main Tenkan-sen color and the MTF line offset.
Gain a deeper understanding of market dynamics by analyzing the Tenkan-sen across different time scales, all in one intuitive indicator.
We created this indicator to help you better navigate the markets. Thank you for using it, and we hope it brings you value. Enjoy it in your daily analysis!
Bab

[AlbaTherium] MTF Volatility Edge Zones Premium for Price Action Volatility Edge Zones Premium for Price Action (HTF)
The MTF Volatility Edge Zones Premium for Price Action is an advanced Multiple Timeframes (MTF) trading indicator that combines the power of volume analysis with price action, designed to reveal key volatility zones and assess market participants’ engagement levels . This tool offers unique insights into the dynamics of higher timeframes (HTF), helping traders identify critical zones of decision-making, such as potential reversals, continuations, or breakout areas.
Introduction to the MTF Volatility Edge Zones Premium
This indicator is built upon a deep understanding of the interaction between price action and volume. By mapping volume data onto price action, Volatility Edge Zones Premium (HTF) pinpoints areas of heightened market engagement. These zones represent where buyers and sellers have shown significant activity, allowing traders to identify market intent and anticipate key movements.
Key Features:
Higher Timeframe Analysis: Focuses on significant price and volume interactions over HTFs (e.g., 4H, Daily, Weekly) for a broader perspective on market trends.
Volatility Zones : Highlights areas where market participants show increased activity, signaling potential market turning points or strong continuations.
Volume-Driven Insights: Tracks the behavior of aggressive buyers and sellers, showing their engagement levels relative to price changes.
Overlayon Price Action: Provides a clear and actionable visual representation of volatility and engagement zones directly on price charts.
Chapter 1: Understanding Volatility and Engagement
1.1 Volatility Edge Zones
Volatility Edge Zones are areas where price and volume interact to signal potential changes in market direction or momentum. These zones are derived from high-volume clusters where significant market activity occurs.
1.2 Participant Engagement
Market participants can be categorized based on their level of engagement in these zones:
Aggressive Buyers: Represented by sharp spikes in volume and upward price action.
Aggressive Sellers: Represented by high volume during downward price movement.
Passive Participants: Identified in zones of consolidation or low volatility.
By isolating these behaviors, traders can gain a clearer picture of market sentiment and the relative strength of buyers versus sellers.
Chapter 2: The Principle of Volume and Price Interplay
2.1 Volume as a Leading Indicator
Volume often precedes price movements, and the Volatility Edge Zones Premium captures this relationship by overlaying volume activity onto price charts. This allows traders to:
Identify where volume supports price movement (trend confirmation).
Spot divergences where price moves without volume support (potential reversals).
2.2 The Role of Higher Timeframes
HTFs filter out market noise, revealing macro trends and key levels of engagement. The indicator uses this perspective to highlight long-term volatility zones, helping traders align their strategies with the broader market context.
Chapter 3: Visualizing Volatility Edge Zones
3.1 Color-Coded Zones for Engagement
The indicator uses a color-coded system to represent volatility zones and market engagement levels. These colors correspond to different market conditions:
Red Zones: High selling pressure and aggressive bearish activity.
Blue Zones: High buying pressure and aggressive bullish activity.
Yellow Zones: Transitional zones, representing indecision or balance between buyers and sellers.
White Zones: Neutral areas, where low engagement is observed but could serve as potential breakout points.
3.2 Key Metrics Tracked
Volume Clusters: Areas of concentrated buying or selling activity.
Directional Bias: Net buying or selling dominance.
Momentum Shifts: Sudden changes in volume relative to price action.
These metrics provide actionable insights into market dynamics, making it easier to predict key movements.
Chapter 4: Practical Applications in Trading
4.1 Identifying High-Impact Zones
By focusing on HTFs, traders can use the Volatility Edge Zones Premium to identify high-impact areas where market participants are most engaged. These zones often align with:
Support and Resistance Levels: High-volume areas that act as barriers or catalysts for price movement.
Breakout Points: Zones of heightened volatility where price is likely to escape consolidation.
4.2 Detecting Bull and Bear Campaigns
The indicator highlights early signs of bullish or bearish campaigns by analyzing volume surges in critical volatility zones. These campaigns often signal the beginning of significant trends.
Chapter 5: Real-World Examples and Strategies
5.1 Spotting Market Reversals
Real-world examples demonstrate how the indicator can identify volatility zones signaling potential reversals, allowing traders to enter positions early.
5.2 Riding the Trend
By tracking volatility zones in alignment with HTF trends, traders can maximize profit potential by entering during periods of high engagement and riding the trend until it weakens.
Conclusion
The MTF Volatility Edge Zones Premium for Price Action is an essential tool for traders looking to master market dynamics through a combination of volume and price action analysis. By focusing on higher timeframes and overlaying volatility zones onto price charts, this indicator provides unparalleled insights into market participant engagement.
Whether you’re trading intraday, swing, or long-term strategies, the MTF Volatility Edge Zones Premium equips you with the information needed to make confident and precise trading decisions. Stay tuned as we continue to enhance this tool for even greater accuracy and usability.

Heiken Ashi MTF Monitor - Better Formula - EMA, AMA, KAFA, T3Heiken Ashi MTF Monitor - Better Formula - EMA, AMA, KAFA, T3
This indicator is based on the works of Loxx & Smart_Money-Trader, without their initial codes, none of this will be possible.
This Pine Script indicator provides a multi-timeframe (MTF) analysis of Heiken Ashi trends, designed to enhance the traditional Heiken Ashi method with advanced smoothing techniques such as the Exponential Moving Average (EMA), Adaptive Moving Average (AMA), Kaufman’s Adaptive Moving Average (KAMA), and the Triple Exponential Moving Average (T3). The indicator offers a flexible approach to identify bullish, bearish, and neutral trends across six customizable timeframes and various Heiken Ashi calculation methods.
Key Features:
Multi-Timeframe (MTF) Support: The indicator allows you to monitor trends across six timeframes (e.g., 2-hour, 4-hour, daily, weekly, monthly), giving a holistic view of market conditions at different scales.
Heiken Ashi Calculation Methods: Choose between traditional Heiken Ashi or an enhanced "Better HA" method for more refined trend analysis.
Smoothing Options: Apply different smoothing techniques, including EMA, T3, KAMA, or AMA, to the Heiken Ashi values for smoother, more reliable trend signals.
Non-Repaint Option: This feature ensures that the values do not repaint after the bar closes, providing a more reliable historical view.
Customizable Plotting: The indicator offers full customization of which timeframes to display and whether to show labels for each timeframe.
Inputs and Settings:
Timeframe Inputs:
Users can set up to six different timeframes, ranging from intraday (2-hour, 4-hour) to higher timeframes (daily, weekly, monthly).
Timeframes can be enabled or disabled individually for each analysis.
Label Visibility:
Labels indicating the trend direction (bullish, bearish, neutral) can be shown for each timeframe. This helps with clarity when monitoring multiple timeframes simultaneously.
Smoothing Options:
EMA: Exponential Moving Average for standard smoothing.
AMA: Adaptive Moving Average, which adapts its smoothing based on market volatility.
KAMA: Kaufman’s Adaptive Moving Average, which adjusts its sensitivity to price fluctuations.
T3: Triple Exponential Moving Average, providing a smoother and more responsive moving average.
None: No smoothing applied (for raw Heiken Ashi calculations).
Non-Repaint Setting:
Enabling this ensures the trend values do not change after the bar closes, offering a stable historical view of trends.
Core Functions:
Heiken Ashi Calculations:
Traditional HA: The classic Heiken Ashi calculation is used here, where each bar's open, close, high, and low are computed based on the average price of the previous bar.
Better HA: A refined calculation method, where the raw Heiken Ashi close is adjusted by considering the price range. This smoother value is then optionally processed through a moving average function for further smoothing.
Heiken Ashi Trend Calculation:
Based on the selected Heiken Ashi method (Traditional or Better HA), the indicator checks whether the trend is bullish (upward movement), bearish (downward movement), or neutral (sideways movement).
For the "Better HA" method, the trend determination uses the difference between the smoothed Heiken Ashi close and open.
Moving Averages:
The moving averages applied to the Heiken Ashi values are configurable:
EMA: Standard smoothing with an exponential weighting.
T3: A triple exponential smoothing technique that provides a smoother moving average.
KAMA: An adaptive smoothing technique that adjusts to market noise.
AMA: An adaptive moving average that reacts to market volatility, making it more flexible.
None: For raw, unsmoothed Heiken Ashi data.
Trend Detection:
The indicator evaluates the direction of the trend for each timeframe and assigns a color-coded value (bearish, bullish, or neutral).
The trend values are plotted as circles, and their color reflects the detected trend: red for bearish, green for bullish, and white for neutral.
Multi-Timeframe (MTF) Support:
The indicator can be used to analyze up to six different timeframes simultaneously.
The trend for each timeframe is calculated and displayed as circles on the chart.
Users can enable or disable individual timeframes, allowing for a customizable view based on which timeframes they are interested in monitoring.
Plotting:
The indicator plots circles at specific levels based on the detected trend (Level 1 for the 2-hour timeframe, Level 2 for the 4-hour timeframe, etc.). The size and color of these circles represent the trend direction.
These plotted values provide a quick visual reference for trend direction across multiple timeframes.
Usage:
Trend Confirmation: By monitoring trends across multiple timeframes, traders can use this indicator to confirm trends and avoid false signals.
Customizable Timeframe Analysis: Traders can focus on shorter timeframes for intraday trades or look at longer timeframes for a broader market perspective.
Smoothing for Clarity: By applying various moving average techniques, traders can reduce noise and get a clearer view of the trend.
Non-Repainting: The non-repaint option ensures the indicator values remain consistent even after the bar closes, providing more reliable signals for backtesting or live trading.
This Heiken Ashi MTF Monitor indicator with better formulas and smoothing options is designed for traders who want to analyze trends across multiple timeframes while benefiting from advanced moving averages and more refined Heiken Ashi calculations. The customizable settings for smoothing, timeframe selection, and label visibility allow users to tailor the indicator to their specific needs and trading style.

Enhanced Pressure MTF ScreenerEnhanced Pressure Multi-Timeframe (MTF) Screener Indicator
Overview
The Enhanced Pressure MTF Screener is an add-on that extends the capabilities of the Enhanced Buy/Sell Pressure, Volume, and Trend Bar Analysis . It provides a clear and consolidated view of buy/sell pressure across multiple timeframes. This indicator allows traders to determine when different timeframes are synchronized in the same trend direction, which is particularly useful for making high-confidence trading decisions.
Image below: is the Enhanced Buy/Sell Pressure, Volume, and Trend Bar Analysis with the Enhanced Pressure MTF Screener indicator both active together.
Key Features
1.Multi-Timeframe Analysis
The indicator screens various predefined timeframes (from 1 week down to 10 minutes).
It offers a table view that shows buy or sell ratings for each timeframe, making it easy to see which timeframes are aligned.
Traders can choose which timeframes to include based on their trading strategies (e.g., higher timeframes for position trading, lower timeframes for scalping).
2.Pressure and Trend Calculation
Uses Buy and Sell Pressure calculations from the Enhanced Buy/Sell Pressure indicator to determine whether buying or selling is dominant in each timeframe.
By analyzing pressures on multiple timeframes, the indicator gives a comprehensive perspective of the current market sentiment.
The indicator calculates whether a move is strong based on user-defined thresholds, which are displayed in the form of additional signals.
3.Heikin Ashi Option
The Heikin Ashi candle type can be toggled on or off. Using Heikin Ashi helps smooth out market noise and provides a clearer indication of trend direction.
This is particularly helpful for traders who want to filter out market noise and focus on the primary trend.
4.Table Customization
Table Positioning: The table showing timeframe data can be positioned at different locations on the chart—top, middle, or bottom.
Text and Alignment: The alignment and text size of the table can be customized for better visual clarity.
Color Settings: Users can choose specific colors to indicate buying and selling pressure across timeframes, making it easy to interpret.
5.Strong Movement Indicators
The screener provides an additional visual cue (🔥) for timeframes where the movement is deemed strong, based on a user-defined threshold.
This helps highlight timeframes where significant buying or selling pressure is present, which could signal potential trading opportunities.
How the Screener Works
1.Pressure Calculation
For each selected timeframe, the indicator retrieves the Open, High, Low, and Close (OHLC) values.
It calculates buy pressure (the range between high and low when the closing price is higher than the opening) and sell pressure (the range between high and low when the closing price is equal to or lower than the opening).
The screener computes the pressure ratio, which represents the difference between buying and selling pressure, to determine which side is dominant.
2.Trend Rating and Signal Generation
Based on the calculated pressure, the screener determines a trend rating for each timeframe: "Buy," "Sell," or "Neutral." (▲ ,▼ or •)
Additionally, it generates a signal (▲ or ▼) to indicate the current trend direction and whether the move is strong (based on the user-defined threshold).
If the movement is strong, a fire icon (🔥) is added to indicate that there is significant pressure on that timeframe, signaling a higher confidence in the trend.
3.Customizable Strong Move Thresholds
Strong Move Threshold: The screener uses this value to decide whether a trend is significantly strong. A higher value makes it more selective in determining strong moves.
Strong Movement Threshold: Helps determine when an additional strong signal should be displayed, offering further insight into the strength of market movement.
Inputs and Customization
The Enhanced Pressure MTF Screener is highly customizable to fit the needs of individual traders:
General Settings:
Use Heikin Ashi: Toggle this setting to use Heikin Ashi for a smoother trend representation.
Strong Move Threshold: Defines how strong a move should be to be considered significant.
Strong Movement Threshold: Specifies the level of pressure required to highlight a move with the fire icon.
Table Settings:
Position: Choose the vertical position of the screener table (top, middle, or bottom of the chart).
Alignment: Align the table (left, center, or right) to best suit your chart layout.
Text Size: Adjust the text size in the table for better readability.
Table Color Settings:
Users can set different colors to represent buying and selling signals for better visual clarity, particularly when scanning multiple timeframes.
Timeframe Settings:
The screener provides options to include up to ten different timeframes. Traders can select and customize each timeframe to match their strategy.
Examples of available timeframes include 1 Week, 1 Day, 12 Hours, down to 10 Minutes, allowing for both broad and detailed analysis.
Practical Use Case
Identifying Trend Alignment Across Timeframes:
Imagine you are about to take a long trade but want to make sure that the trend direction is aligned across multiple timeframes.
The screener displays "Buy" ratings across the 4H, 1H, 30M, and 10M timeframes, while higher timeframes (like 1W and 1D) also show "Buy" with strong signals (🔥). This indicates that buying pressure is strong across the board, adding confidence to your trade.
Spotting Reversal Opportunities:
If a downtrend is evident across most timeframes but suddenly a higher timeframe, such as 12H, changes to "Buy" while showing a strong move (🔥), this could indicate a potential reversal.
The screener allows you to spot these discrepancies and consider taking early action.
Benefits for Traders
1.Synchronization Across Timeframes:
One of the main strengths of this screener is its ability to show synchronized buy/sell signals across different timeframes. This makes it easy to confirm the strength and consistency of a trend.
For example, if you see that all the selected timeframes display "Buy," this implies that both short-term and long-term traders are favoring the upside, giving additional confidence to go long.
2.Quick and Visual Trend Overview:
The table offers an at-a-glance summary, reducing the time required to manually inspect each timeframe.
This makes it particularly useful for traders who want to make quick decisions, such as day traders or scalpers.
3.Strong Move Indicator:
The use of fire icons (🔥) provides an easy way to identify significant movements. This is particularly helpful for traders looking for breakouts or strong market conditions that could lead to high probability trades.
To put it short or to summarize
The Enhanced Pressure MTF Screener is a powerful add-on for traders looking to understand how buy and sell pressure aligns across multiple timeframes. It offers:
A clear summary of buying or selling pressure across different timeframes.
Heikin Ashi smoothing, providing an option to reduce market noise.
Strong movement signals to highlight significant trading opportunities.
Customizable settings to fit any trading strategy or style.
The screener and the main indicator are best used together, as the screener provides the multi-timeframe overview, while the main indicator provides an in-depth look at each individual bar and trend.
I hope my indicator helps with your trading, if you guys have any ideas or questions there is the comment section :D

Volume Analysis Table MTF - Buy vs SellVolume Analysis Table MTF - Buy vs Sell Indicator
Take control of your trading decisions with the Volume Analysis Table MTF - Buy vs Sell indicator for TradingView! This powerful Pine Script code empowers you to analyze volume trends across various timeframes, providing valuable insights into buying and selling pressure within the market.
Unveiling Market Sentiment Through Volume Analysis:
Multi-Timeframe Analysis: Gain a comprehensive understanding of volume activity by examining different timeframes, from 1 minute to 1 month. Identify potential turning points and gauge the strength of trends.
Buy vs Sell Volume Differentiation: Effortlessly distinguish between buying and selling volume. The indicator color-codes the results, highlighting periods dominated by buying or selling pressure with clear visuals.
Customizable Table: Tailor the indicator to your preferences. Choose the number of bars to analyze, select the timeframes you want to display, and position the table conveniently on your chart using the built-in options.
Weekly and Monthly Period Support: Go beyond the traditional daily timeframe. The indicator allows you to incorporate weekly and monthly volume data for a broader market perspective (requires enabling the respective options).
Empower Your Trading with Actionable Insights:
Identify Potential Entry and Exit Points: By analyzing the volume distribution across different timeframes, you can potentially spot opportunities to enter or exit trades based on shifts in buying and selling pressure.
Confirm Trend Strength: Volume analysis can strengthen your existing trend identification strategies. High buying volume during uptrends and high selling volume during downtrends can add confidence to your trading decisions.
Gain a Competitive Edge: Understanding volume dynamics can provide valuable clues about market sentiment and potential turning points. This information can be a crucial advantage in fast-paced trading environments.
The Volume Analysis Table MTF - Buy vs Sell indicator is an indispensable tool for any serious trader utilizing TradingView. Simplify your volume analysis, gain actionable insights, and elevate your trading game!
------------------------------------------------------------------
Türkçe
Volume Analysis Table MTF - Buy vs Sell
Piyasada hakim olan alım-satım gücünü anlamak, başarılı bir yatırım için kritik öneme sahiptir. Volume Analysis Table MTF - Buy vs Sell göstergesi, farklı zaman dilimlerindeki hacim verilerini analiz ederek size bu konuda derinlemesine bir bakış açısı sunar.
Neden Bu Göstergeyi Kullanmalısınız?
Çoklu Zaman Dilimi Analizi: 1 dakikalık grafikten 1 aylık grafiğe kadar farklı zaman dilimlerindeki hacim verilerini tek bir bakışta görerek piyasanın genel eğilimini daha iyi anlayabilirsiniz.
Alım ve Satım Hacimlerini Karşılaştırma: Alım ve satım hacimlerini görsel olarak karşılaştırarak piyasadaki güç dengesini belirleyebilirsiniz.
Potansiyel Dönüm Noktalarını Tespit Etme: Hacimdeki ani değişimler, potansiyel trend değişikliklerine işaret edebilir. Bu gösterge sayesinde bu tür noktaları daha kolay tespit edebilirsiniz.
Tüm Yatırım Düzeyleri İçin Uygun: Hem yeni başlayan hem de deneyimli yatırımcılar bu göstergeden faydalanabilir.
Ana Özellikler:
Çoklu Zaman Dilimi Desteği: 1 dakika, 5 dakika, 15 dakika, 30 dakika, 1 saat, 2 saat, 4 saat, 1 gün, 1 hafta, 1 ay
Özelleştirilebilir Arayüz: Tablo pozisyonu, metin boyutu gibi ayarları kişiselleştirebilirsiniz.
Net ve Anlaşılır Görselleştirme: Alım ve satım hacimleri farklı renklerle gösterilir, böylece kolayca ayırt edilebilirler.

Regression Channel Alternative MTF V2█ OVERVIEW
This indicator is a predecessor to Regression Channel Alternative MTF , which is coded based on latest update of type, object and method.
█ IMPORTANT NOTES
This indicator is NOT true Multi Timeframe (MTF) but considered as Alternative MTF which calculate 100 bars for Primary MTF, can be refer from provided line helper.
The timeframe scenarios are defined based on Position, Swing and Intraday Trader.
Suppported Timeframe : W, D, 60, 15, 5 and 1.
Channel drawn based on regression calculation.
Angle channel is NOT supported.
█ INSPIRATIONS
These timeframe scenarios are defined based on Harmonic Trading : Volume Three written by Scott M Carney.
By applying channel on each timeframe, MW or ABCD patterns can be easily identified manually.
This can also be applied on other chart patterns.
█ CREDITS
Scott M Carney, Harmonic Trading : Volume Three (Reaction vs. Reversal)
█ TIMEFRAME EXPLAINED
Higher / Distal : The (next) longer or larger comparative timeframe after primary pattern has been identified.
Primary / Clear : Timeframe that possess the clearest pattern structure.
Lower / Proximate : The (next) shorter timeframe after primary pattern has been identified.
Lowest : Check primary timeframe as main reference.
█ FEATURES
Color is determined by trend or timeframe.
Some color is depends on chart contrast color.
Color is determined by trend or timeframe.
█ EXAMPLE OF USAGE / EXPLAINATION

SMM - MTF S/D Zones & TrendwatcherHello Traders,
Introducing the SMM - MTF S/D Zones & Trendwatcher, a powerful tool designed to make your trading easier and eliminate guesswork. Our goal is to save you time by automatically marking up the chart with key points of interest.
Our newest tool combines multiple time frames (MTF) to provide a comprehensive view of supply and demand zones, and includes a trendwatcher that tracks the trend of the input timeframes.
The indicator is based on calculations of supply and demand zones, providing valuable insights for traders looking to make informed decisions about buying and selling. With its MTF functionality, the SMM - MTF S/D Zones & Trendwatcher is a valuable tool for any trader looking to stay on top of the market.
Features Version 1.1
-----------
-- MTF S/D Zones
Our indicator includes three adjustable supply and demand zones, which can be set to a desired higher timeframe.
Each zone includes options for:
- Extending the boxes.
- Show the 50% mitigation line.
- Let a zone disappear, change color, or do nothing.
- Option to plot/show the zones on the chart.
-- Trendwatcher
A convenient table that provides a quick overview of the trends of the set supply and demand.
You can configure the Trendwatcher the following ways:
- Option enable/disable the S/D trends to show in the table.
- Trendwatcher location on the chart.
- Trendwatcher size.
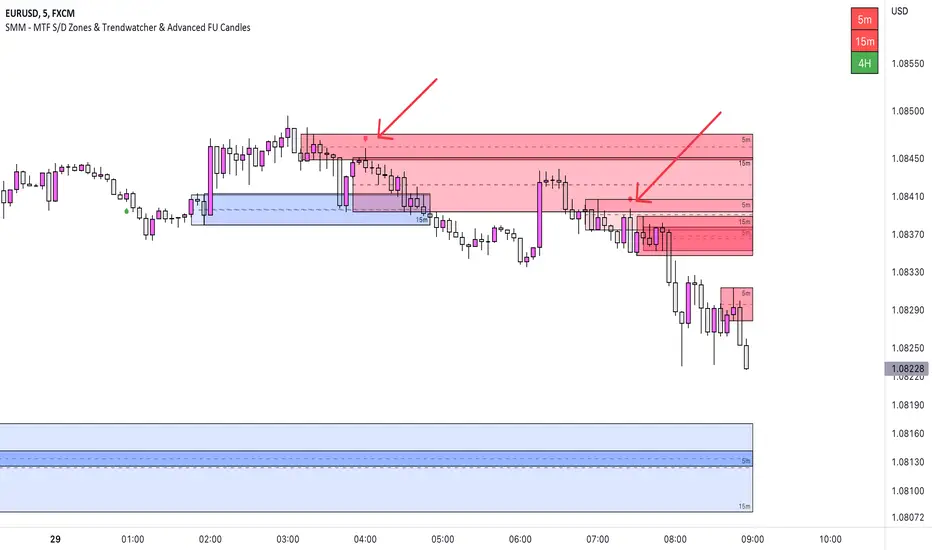
Supertrend MTF LAG ISSUEThis script based on
we all use Super trend but it main issue is the lag as it buy too late or sell too late
using Deavaet study of Heat map MTF we can do a little trick
if you look on his study you can see that major signal for example will happen in the time frame before it happen at larger time frame
so in this example if signal at MTF 30 min and signal at MTF 60 min happen at the same time at 2 hours or 4 hours candles then this signal are more likely to be true then random signal at each time frame specific.
since we use shorter time frame on larger time frame we can remove the lag issue that make supertrend not so effective
In this example I set the signal to be MTF 30 +60 om 2 hour TF , can be good also for 4 hour candles..
So you get the signal to close inside the larger candle
now if you want to make on even shorter TF then change the code to 15 and 30 MTF on candles on 1 hour
or 1 and 5 min on 30 min or 15 min

FVG MTF Consensus OscillatorFVG MTF Consensus Oscillator
A multi-timeframe, multi-component oscillator that combines momentum, deviation, and slope analysis across multiple timeframes using Zeiierman's Chebyshev-filtered trend calculation. This indicator identifies potential turning points with zone-based signal classification and timeframe consensus filtering.
Backed by ML/Deep Learning evaluation on ES Futures data from 2015-2024.
🎯 Concept
Traditional oscillators suffer from two major weaknesses:
Single measurement - relying on one metric makes them susceptible to noise
Single timeframe - missing the bigger picture leads to fighting the trend
The FVG MTF Consensus Oscillator addresses both issues by combining three independent measurements across three timeframes into a weighted consensus signal.
The Three Components
Momentum - How fast is the trend moving?
Deviation - How far has price stretched from the trend?
Slope - What is the short-term directional bias?
The Three Timeframes
TF1 (Chart) - Your current chart timeframe (lowest weight)
TF2 (Medium) - Typically 1H or 4H (medium weight)
TF3 (High) - Typically 4H or Daily (highest weight)
By requiring agreement across multiple components AND multiple timeframes, the oscillator filters out noise while capturing meaningful, high-probability market movements.
🔧 How It Works
The Core: Chebyshev Type 1 Filter
At its heart, this indicator uses a Chebyshev Type 1 low-pass filter (inspired by Zeiierman's FVG Trend) to extract a clean trend line from price action. Unlike simple moving averages, the Chebyshev filter offers:
Sharper cutoff between trend and noise
Minimal lag for a given smoothness level
Controlled overshoot via the ripple parameter
Three Oscillator Components
1. Momentum Component
Momentum = Current Trend Value - Previous Trend Value
Measures the velocity of the trend. High positive values indicate strong upward acceleration, while high negative values show downward acceleration.
2. Deviation Component
Deviation = Close Price - Trend Value
Measures how far price has stretched away from the trend line. Useful for identifying overextended conditions and mean reversion opportunities.
3. Slope Component
Slope = Change in Trend over 3 bars
Captures the short-term directional bias of the trend itself, helping confirm trend changes.
Normalization & Component Consensus
Each component is individually normalized to a -100 to +100 scale using adaptive scaling. The oscillator output is a weighted average of all three components, allowing you to emphasize different aspects based on your trading style.
Multi-Timeframe Weighting
The final oscillator value combines all three timeframes using configurable weights:
Combined = (TF1 × Weight1 + TF2 × Weight2 + TF3 × Weight3) / Total Weight
Default weights (1, 2, 3) ensure higher timeframes have more influence, keeping you aligned with the dominant trend while timing entries on lower timeframes.
📊 Zone System
The oscillator uses a fuzzy zone system to classify market conditions:
ZoneRangeInterpretationSignal ColorNeutral-5 to +5No clear bias, avoid tradingGrayContinuation±5 to ±25Trend pullback, continuation setupsAquaDeep Swing±25 to ±50Extended move, stronger setupsGreenReversalBeyond ±50Extreme extension, reversal potentialOrange
When "Show Zone Background" is enabled, the background shading darkens as the oscillator moves into more extreme zones, providing instant visual feedback.
📈 Signal Interpretation
Turn Signals
The indicator plots triangular markers when the oscillator changes direction:
▲ Triangle Up (bottom): Oscillator turning up from a low
▼ Triangle Down (top): Oscillator turning down from a high
Signal Quality by Zone
Not all signals are equal. The signal color indicates which zone the turn occurred in:
ColorZoneProbabilityBest UseGrayNeutralLowAvoid or use very tight stopsAquaContinuationModerateTrend continuation entriesGreenDeep SwingHigherSwing trade entriesOrangeReversalHighestCounter-trend with caution
Timeframe Consensus Filter
Signals only fire when the required number of timeframes agree on direction. With default settings (TF Consensus = 2), at least 2 of 3 timeframes must be moving in the same direction for a signal to trigger.
This prevents:
Taking longs when higher timeframes are bearish
Taking shorts when higher timeframes are bullish
Whipsaws during timeframe disagreement
Trend Coloring
The combined oscillator line changes color based on trend direction:
Light purple (RGB 240, 174, 252): Majority of timeframes trending up
Dark purple (RGB 84, 19, 95): Majority of timeframes trending down
Info Table
When MTF is enabled, a table in the top-right corner displays:
Current oscillator values for each timeframe (TF1, TF2, TF3)
Combined value (CMB)
Color coding: Green = rising, Red = falling
⚙️ Settings Guide
Timeframe Settings
SettingDefaultDescriptionEnable Multi-TimeframeOnMaster switch for MTF functionalityTF1 (Chart)"" (current)First timeframe, typically your chart TFTF2 (Medium)60Second timeframe, typically 1HTF3 (High)240Third timeframe, typically 4HTF1/TF2/TF3 Weight1 / 2 / 3Influence of each TF on combined signal
Timeframe Tips:
Keep TF1 ≤ TF2 ≤ TF3 (ascending order)
For day trading: 5m / 15m / 1H
For swing trading: 1H / 4H / Daily
For position trading: 4H / Daily / Weekly
Display Settings
SettingDefaultDescriptionShow All TimeframesOffDisplay individual TF oscillator linesShow Combined LineOnDisplay the weighted combined oscillatorShow Zone BackgroundOffShade background based on current zone
Trend Filter Settings
SettingDefaultDescriptionTrend Ripple4.0Filter responsiveness (1-10). Higher = faster but more overshootTrend Cutoff0.1Cutoff frequency (0.01-0.5). Lower = smoother trendNormalization Length50Lookback for scaling. Longer = more stable
Component Weights
SettingDefaultDescriptionMomentum Weight1.0Emphasis on trend speedDeviation Weight1.0Emphasis on price stretch from trendSlope Weight1.0Emphasis on short-term trend direction
Component Tips:
For trend-following: Increase Momentum and Slope weights
For mean reversion: Increase Deviation weight
Set any weight to 0 to disable that component
Zone Thresholds
SettingDefaultDescriptionNeutral Zone5Inner boundary (±5 = neutral)Continuation Zone25Middle boundary for continuation setupsDeep Swing Zone50Outer boundary for reversal zone
Adjust based on instrument volatility. More volatile instruments may need wider zones.
Signal Filters
SettingDefaultDescriptionSignal Cooldown3Minimum bars between signalsMin Turn Size2.0Minimum oscillator change for valid turnTF Consensus Required2Minimum TFs agreeing for signal (1-3)
💡 Usage Examples
Example 1: Trend Continuation (Dip Buying)
Setup: Uptrend confirmed by higher timeframes
Check the info table - TF2 and TF3 should show green (rising)
Wait for TF1 to pull back, oscillator enters Continuation zone
Enter on Aqua ▲ signal (turn up with TF consensus)
Stop below recent swing low
Target: Previous high or next resistance
Why it works: You're buying a dip in an established uptrend with multi-timeframe confirmation.
Example 2: Deep Swing Entry
Setup: Extended move showing exhaustion
Oscillator reaches Deep Swing zone (±25 to ±50)
At least 2 TFs start showing the same direction
Enter on Green signal indicating momentum exhaustion
Use tighter stop as the move is already extended
Target: Return to Continuation zone or trend line
Why it works: Extended moves tend to mean-revert. The zone system identifies these opportunities.
Example 3: Reversal Setup (Advanced)
Setup: Extreme extension with diverging timeframes
Oscillator reaches Reversal zone (beyond ±50)
Watch for TF1 to turn while TF3 is still extended
Enter on Orange signal - this is counter-trend!
Use smaller position size and wider stops
Target: Return to Deep Swing or Continuation zone
Why it works: Extreme extensions eventually correct. The orange signal marks high-probability reversal points.
Example 4: Avoiding Bad Trades
What to avoid:
Gray signals in Neutral zone - No edge, random noise
Signals against TF3 direction - Fighting the dominant trend
Signals without TF consensus - Timeframe disagreement = choppy market
Multiple signals in quick succession - Let cooldown filter work
🔬 Multi-Timeframe Analysis Tips
Reading the Info Table
The info table shows real-time oscillator values:
| TF1 | TF2 | TF3 | CMB |
| 23.5 | 45.2 | 67.8 | 52.1 |
All green: Strong uptrend across all timeframes
All red: Strong downtrend across all timeframes
Mixed colors: Potential transition or consolidation
Timeframe Alignment States
TF1TF2TF3Interpretation↑↑↑Strong bull - look for long entries↓↓↓Strong bear - look for short entries↑↑↓Pullback in downtrend - caution on longs↓↓↑Pullback in uptrend - caution on shorts↑↓↑Choppy - reduce position size↓↑↓Choppy - reduce position size
The Power of Consensus
With TF Consensus = 2, signals only fire when 2+ timeframes agree. This single filter eliminates most whipsaws and keeps you aligned with the dominant trend.
For more conservative trading, set TF Consensus = 3 (all timeframes must agree).
⚠️ Important Notes
This indicator does not predict the future. It measures current market conditions and momentum across multiple timeframes.
Always use proper risk management. No indicator is 100% accurate.
Combine with price action. The oscillator works best when confirmed by support/resistance, candlestick patterns, or other confluence factors.
Respect the higher timeframe. When TF3 disagrees, trade smaller or sit out.
Zone signals are probabilistic. Orange (reversal) signals have higher probability but aren't guaranteed reversals.
Adjust settings per instrument. Default settings are optimized for ES Futures but may need tuning for other markets.
🧪 ML/Deep Learning Background
The default parameters and zone thresholds were evaluated using machine learning techniques on ES Futures data spanning 2015-2024. This included:
Optimization of component weights
Zone threshold calibration
Timeframe weight balancing
Signal filter tuning
While past performance doesn't guarantee future results, the parameters represent a data-driven starting point rather than arbitrary defaults.
🙏 Credits
This indicator is inspired by Zeiierman's Multitimeframe Fair Value Gap (FVG) indicator, specifically utilizing concepts from his Chebyshev Type 1 filter implementation for trend calculation.
Original indicator: Multitimeframe Fair Value Gap – FVG (Zeiierman)
📝 Changelog
v1.0
Initial release
Three-component consensus oscillator (Momentum, Deviation, Slope)
Multi-timeframe support with weighted combination
Fuzzy zone classification system
Configurable component and timeframe weights
TF consensus filter for signal quality
Signal cooldown and minimum turn size filters
Real-time info table with TF values
Optional zone background shading

Rolling VWAP Structure [MTF]Core Logic: Rolling VWAP & MTF**
* **Rolling VWAP (Volume-Weighted Average Price):** Unlike a simple Moving Average, this centerline weighs price by volume. It represents the true "Institutional Cost Basis" over the rolling period (default 20).
* **MTF (Multi-Timeframe) Capability:** The indicator is locked to the **Daily (1D)** timeframe by default. This acts as a stable "Lighthouse," ensuring that intraday noise does not distort the major structural levels.
* *Stepped Lines:* On lower timeframes, the lines appear stepped. This is intentional. It shows that the structural value remains constant throughout the day until the daily close shifts the calculation.
**3. Market Profile Logic: Balance vs. Imbalance**
This indicator visually decodes the market cycle using Auction Market Theory:
* **Orange Zone (Squeeze) = Balance:** When the bands contract (and turn Orange), the market is in equilibrium. This is a high-volume node where price is accepted. **Note:** Historical Orange Zones often act as strong Support/Resistance upon retest.
* **Grey Cloud (Expansion) = Imbalance:** When price breaks into the Grey "Highway" (1.0 - 2.0 StdDev), the market enters Price Discovery mode (Trending).
**4. Key Features & Settings**
* **Fixed Timeframe:** Select the timeframe you want to monitor (e.g., "1D" for Daily structure, "1W" for Weekly).
* **Clean Visuals:** The bottom signal dots have been removed for a cleaner chart.
* **Squeeze Toggle:** You can now **hide the Orange Squeeze color** in the settings if you prefer a unified Grey look for strictly structural analysis.
---
### **中文说明**
核心逻辑:Rolling VWAP 与 跨周期 (MTF)**
* **Rolling VWAP (滚动成交量加权均价):** 与简单移动平均线不同,中轨根据成交量对价格进行加权。它代表了滚动周期内(默认20)真实的“机构持仓成本”。
* **MTF (跨周期) 能力:** 指标默认锁定在 **日线 (1D)** 周期。这就像一座稳定的“灯塔”,确保日内的短期噪音不会扭曲主要的结构性点位。
* *阶梯状线条:* 在小周期图表上,轨道呈现阶梯状。这是有意设计的,代表当天的结构价值是固定的,不会随秒级波动而改变。
**3. 市场轮廓逻辑:平衡与失衡**
本指标利用拍卖市场理论可视化解码市场周期:
* **橙色区域 (挤压) = 平衡 (Balance):** 当布林带收缩(并变橙色)时,市场处于均衡状态。这是筹码密集的高成交量区。**注意:** 历史上的橙色区域在未来回踩时往往起到强力的 支撑/阻力 作用。
* **灰色云带 (扩张) = 失衡 (Imbalance):** 当价格突破进入灰色“高速公路”(1.0 - 2.0 标准差)时,市场进入价格发现模式(趋势)。
**4. 主要功能与设置**
* **Fixed Timeframe (锁定时间框架):** 选择你想要监控的周期(例如 "1D" 看日线结构,"1W" 看周线结构)。
* **视觉净化:** 移除了底部的信号圆点,让主图背景更加纯粹干净。
* **Squeeze Toggle (挤压色开关):** 你现在可以在设置中**隐藏橙色挤压显示**。如果你更偏向纯粹的结构分析,可以选择让通道始终保持灰色。

[CT] ATR Ratio MTFThis indicator is an enhanced, multi-timeframe version of the original “ATR ratio” by RafaelZioni. Huge thanks to RafaelZioni for the core concept and base logic. The script still combines an ATR-based ratio (Z-score style reading of where price sits within its recent ATR envelope) with an ATR Supertrend, but expands it into a more flexible trade-decision and visual context tool.
The ATR ratio is normalized so you can quickly see when price is pressing into extended bullish or bearish territory, while the Supertrend defines directional bias and a dynamic support-resistance trail. You can choose any higher timeframe in the settings, allowing you to run the ATR ratio and Supertrend from a larger anchor timeframe while trading on a lower chart.
Upgrades include a full Pine Script v6 rewrite, multi-timeframe support for both the ATR ratio and Supertrend, user-controlled colors for the Supertrend in bull and bear modes, and optional bar coloring so price bars automatically reflect Supertrend direction. Entry, pyramiding and take-profit logic from the original script are preserved, giving you a familiar framework with more control over timeframe, visuals and trend bias.
This indicator is designed to give you a clean directional framework that blends volatility, trend, and timing into one view. The ATR ratio side of the script shows you where price sits inside a recent ATR-based envelope. When the ATR ratio pushes up and sustains above the bullish threshold, it signals that price is trading in an extended, momentum-driven zone relative to recent volatility. When it drops and holds below the bearish threshold, it shows the opposite: sellers have pushed price down into an extended bearish zone. The optional background coloring simply makes these bullish and bearish environments easier to see at a glance.
On top of that, the Supertrend and bar colors tell you what side of the market to favor. The Supertrend is calculated from ATR on whatever timeframe you choose in the settings. If you set the MTF input to a higher timeframe, the Supertrend and ATR ratio become your higher time frame bias while you trade on a lower chart. When price is above the MTF Supertrend, the line uses your bullish color and, if bar coloring is enabled, candles adopt your bullish bar color. That is your “long only” environment: you generally look for buys when price is above the Supertrend and the ATR ratio is either turning up from neutral or already in a bullish zone. When price is below the MTF Supertrend, the line uses your bearish color and candles can shift to your bearish bar color; that is where you focus on shorts, especially when the ATR ratio is rolling over or holding in the bearish zone.
The built-in long and short conditions are meant as signal prompts, not rigid rules. Long signals fire when the ATR ratio crosses up through a positive level while the Supertrend is bullish. Short signals fire when the ATR ratio crosses down through a negative level while the Supertrend is bearish. The script tracks how many longs or shorts have been taken in sequence (pyramiding) and will only allow a new signal up to the limit you set, so you can control how aggressively you stack positions in a trend. The take-profit logic then watches the percentage move from your last entry and flags “TP” when that move has reached your take-profit percent, helping you standardize exits instead of eyeballing them bar by bar.
In practice you typically start by choosing your anchor timeframe for the MTF setting, for example a 1-hour or 4-hour Supertrend and ATR ratio while watching a 5-minute or 15-minute chart. You then use the Supertrend direction and bar colors as your bias filter, only taking signals in the direction of the trend, and you use the ATR ratio behavior to judge whether you are entering into strength, fading an extreme, or trading inside a neutral consolidation. Over time this gives you a consistent way to answer three questions on every chart: which side am I allowed to trade, how extended is price within its recent volatility, and where are my structured entries and exits based on that framework.

SSL ST Indicator - MTF SSL FilterPDF Title: SSL ST Indicator – Client Summary
Overview:
The SSL ST Indicator combines SSL (EMA-based support/resistance lines), HMA (Hull Moving Average), and optional multi-timeframe (MTF) SSL confirmation to provide precise trend-following signals, dynamic background zones, and visual entry/exit cues.
Key Features:
* Trend detection with SSL & Baseline EMA
* Optional HMA for trend strength
* Multi-Timeframe SSL filter for higher timeframe confirmation
* Dynamic background zones (green = bullish, red = bearish)
* Entry/exit labels & shapes
* Alert conditions for automated notifications
Visual Elements:
* Blue Line: SSL line
* Gray Line: Baseline EMA
* Orange Line: HMA line
* Green Background: Bullish Trend
* Red Background: Bearish Trend
* Green Triangle: Buy Signal
* Red Triangle: Sell Signal
* Yellow Cross: Exit Signal
Signal Logic:
* Buy: SSL crosses under baseline (filtered by MTF SSL if enabled)
* Sell: SSL crosses over baseline (filtered by MTF SSL if enabled)
* Exit: SSL crosses opposite trend or optional HMA slope changes
Usage Instructions:
1. Add the indicator to your chart.
2. Configure EMA/HMA lengths and optional MTF timeframe.
3. Enable background zones and labels for easy trend visualization.
4. Monitor triangles and crosses for trade signals.
5. Set alerts for automatic notifications.
Advantages:
* Fully aligned with candlesticks (no misalignment when scrolling)
* Multi-timeframe confirmation reduces false signals
* Visual trend zones improve market interpretation
* Alerts help automate monitoring and decision-making
Disclaimer
This strategy is provided strictly for educational and informational purposes only. It does not guarantee any profit, nor does it protect against losses of any kind. Financial markets are inherently unpredictable, and any market movement can only be assumed or estimated with a probability that is never guaranteed and can often be no better than a 50/50 chance.
By using this strategy, you acknowledge that all trading decisions are made solely at your own risk. I am not liable for any profits, losses, or financial consequences incurred by anyone using or relying on this strategy. Always perform your own research, manage your risk responsibly, and consult with a qualified financial advisor before trading.
