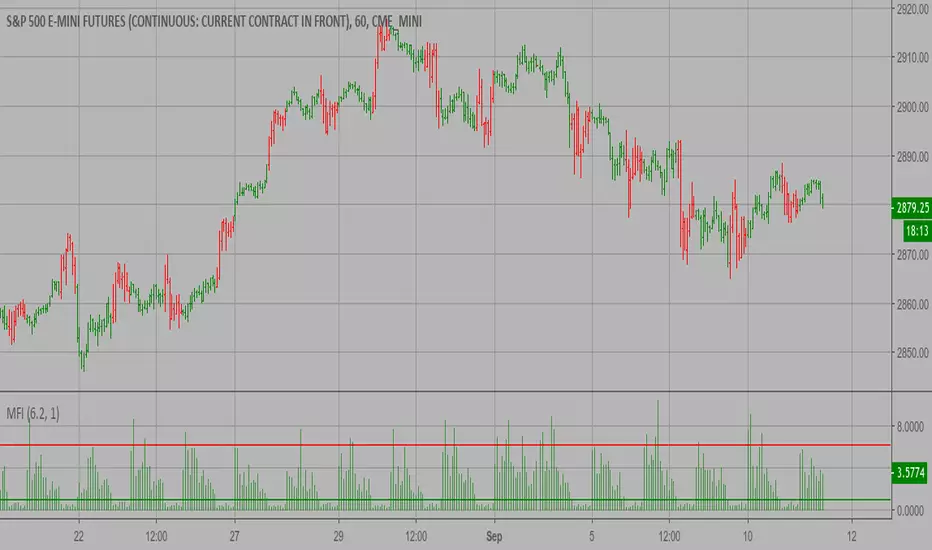
Market Facilitation Index (MFI) Strategy The Market Facilitation Index is an indicator that relates price range to
volume and measures the efficency of price movement. Use the indicator to
determine if the market is trending. If the Market Facilitation Index increased,
then the market is facilitating trade and is more efficient, implying that the
market is trending. If the Market Facilitation Index decreased, then the market
is becoming less efficient, which may indicate a trading range is developing that
may be a trend reversal.
WARNING:
- This script to change bars colors.
스크립트에서 "index"에 대해 찾기
SMI-VIX-SPY-NDX-Index
This script offers an SMI index of VIX, SPY, and NDX. Rather than overlaying VIX, NDX and SPY on the same chart.
It's much easier to see the correlation between VIX's price and NDX / SPY price in this manner.
Thanks to Buckkets & William Blau for the TSI smoothing method.

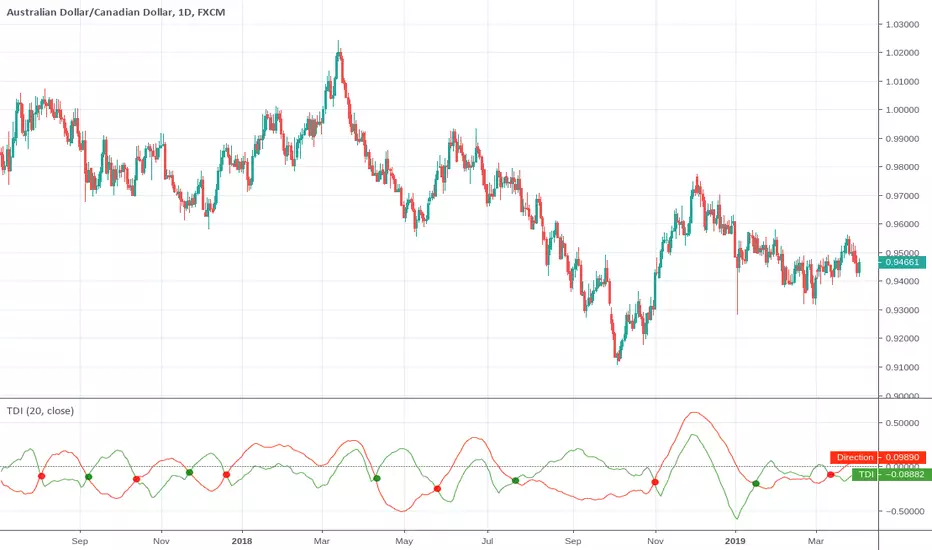
Trend Detection IndexTrend Detection Index indicator script.
This indicator was originally developed by M.H. Pee (Stocks & Commodities V. 19:10 (54-61): Trend Detection Index).
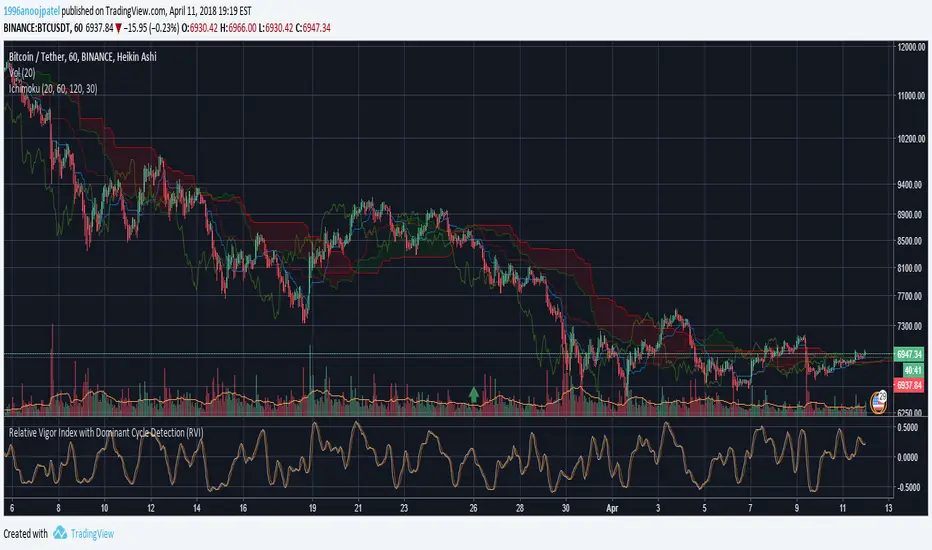
Relative Vigor Index with Dominant Cycle Detection (RVI)Relative Vigor Index with Dominant Cycle Detection. As Ehler's mentioned, fixed length look back is inherently flawed when it is possible to extract a length from a dominant price cycle. may be less effective if signal to noise ratio is greater than 2, but that usually would not happen at >5m candles, and honestly shouldn't be looking at RV(igor)I when price is moving sideways.
Read just like an RVGI, but adjusted to the current time frame. To reduce noise, changing to heiken ashi will help with signals as well. Let me know if there are improvements!
Made for JD, the OG.
Relative Momentum IndexRelative Momentum Index indicator script. This indicator was originally developed by Roger Altman (Stocks & Commodities V. 11:2 (57-60)).
RMI with momentum period of 1 will be equal to an RSI when they have the same period and source price.

Intraday Momentum IndexIntraday Momentum Index indicator script. This indicator was originally developed by Tushar Chande.

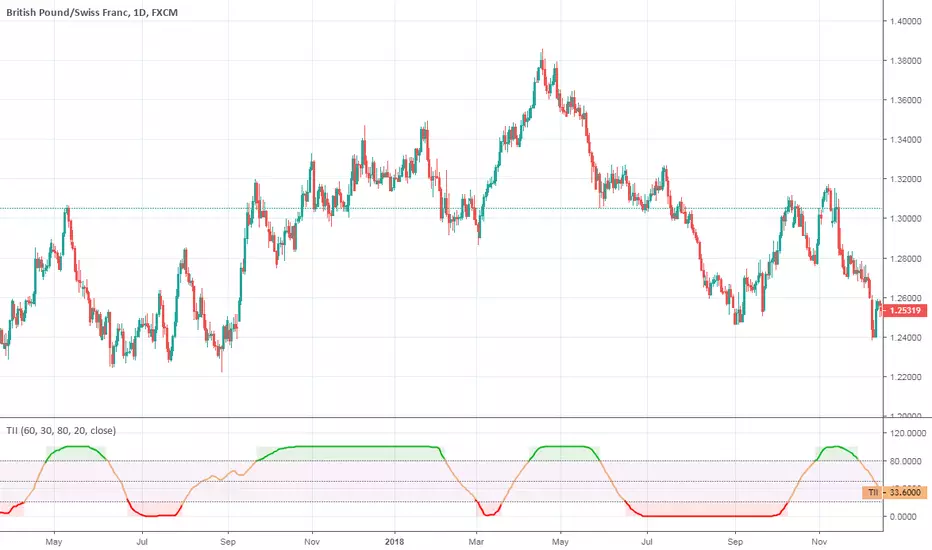
Trend Intensity IndexTrend Intensity Index indicator script. This indicator was originally developed by M. H. Pee (06/2002 issue of Stocks and Commodities Magazine)
Normalized Relative Vigor IndexThis is the Relative Vigor Index indicator just multiplied by 100 to have non-zero integer part

Perfomance index The Performance indicator or a more familiar term, KPI (key performance indicator),
is an industry term that measures the performance. Generally used by organizations,
they determine whether the company is successful or not, and the degree of success.
It is used on a business’ different levels, to quantify the progress or regress of a
department, of an employee or even of a certain program or activity. For a manager
it’s extremely important to determine which KPIs are relevant for his activity, and
what is important almost always depends on which department he wants to measure the
performance for. So the indicators set for the financial team will be different than
the ones for the marketing department and so on.
Similar to the KPIs companies use to measure their performance on a monthly, quarterly
and yearly basis, the stock market makes use of a performance indicator as well, although
on the market, the performance index is calculated on a daily basis. The stock market
performance indicates the direction of the stock market as a whole, or of a specific stock
and gives traders an overall impression over the future security prices, helping them decide
the best move. A change in the indicator gives information about future trends a stock could
adopt, information about a sector or even on the whole economy. The financial sector is the
most relevant department of the economy and the indicators provide information on its overall
health, so when a stock price moves upwards, the indicators are a signal of good news. On the
other hand, if the price of a particular stock decreases, that is because bad news about its
performance are out and they generate negative signals to the market, causing the price to go
downwards. One could state that the movement of the security prices and consequently, the movement
of the indicators are an overall evaluation of a country’s economic trend.

Trend Intensity Index [DW]This study is a simple variation of M. H. Pee's Trend Intensity Index that includes two signal lines rather than one for additional trend confirmation.

Disparity Index [DW]This is an iteration of Steve Nison's Disparity Index that includes 5 different moving average types to choose from.
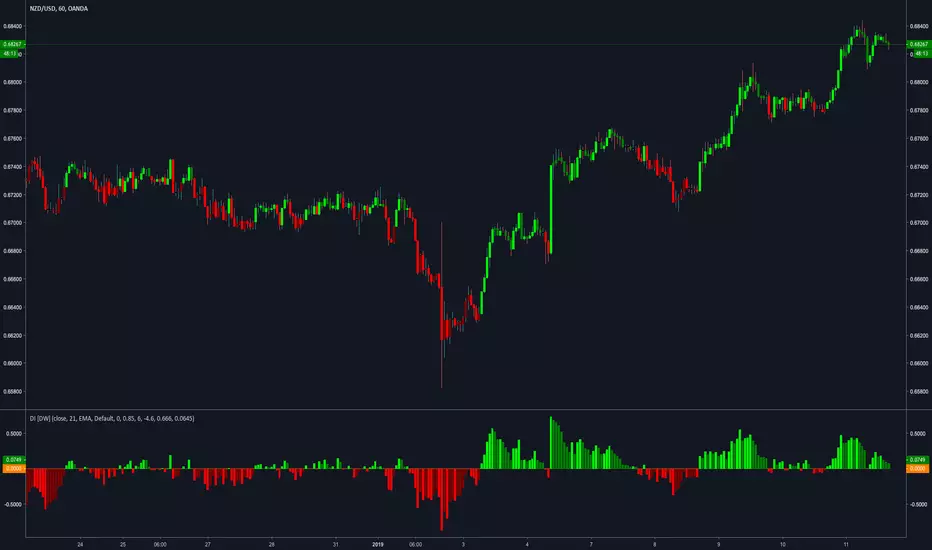
Net Force Index [DW]This study is an experimental force index variation calculated by separating upward force and downward force, then taking the sum of their averages.


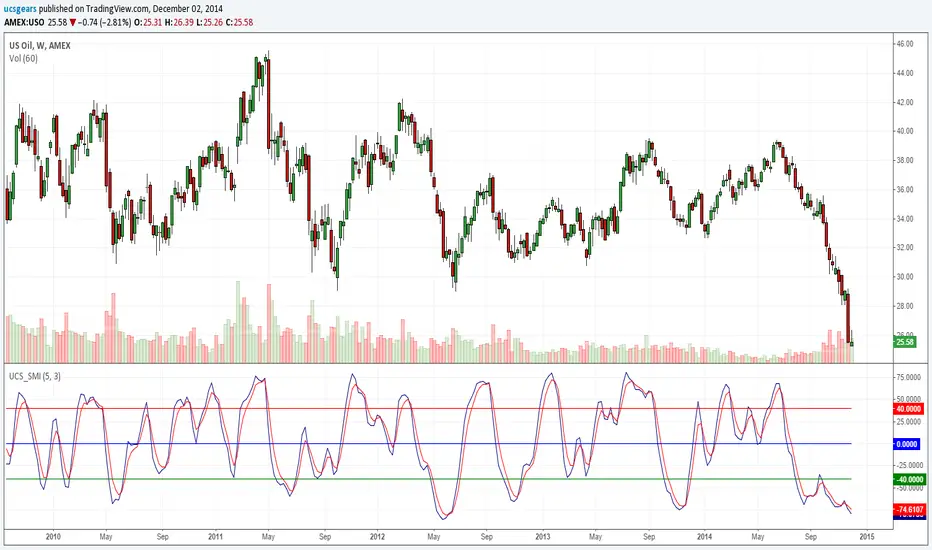
Stochastic Momentum Index (SMI)Stochastic Momentum Index (SMI) or Stoch MTM is used to find oversold and overbought zones. It also helps to figureout whether to enter short trade or long trade.
Red Shade in the Top indicates that the stock is oversold and the Green shade in the bottom indicates overbought.
Strategy:
Enter Long once the Overbought Zone ended and there's a crossover below -35.
Exit Long once the oversold zone is ended and there's a crossover.
Enter Short once the oversold zone is ended and there's a crossover above 35.
Exit Short once the Overbought Zone ended and there's a crossover.
Backup: Always use with another indicator because there will be multiple up and down movement in one Trend.

UCSgears_Transaction Valuation IndexHere is the Version 2 of the TVI indicator posted earlier.
This is inspired from the Value Charts Indicator.
Version 1

High-Low Index [LazyBear]-- Fixed ---
Source: pastebin.com
Fixes an issue with "Combined" mode, using wrong symbols.
--- Original ---
The High-Low Index is a breadth indicator based on Record High Percent, which is based on new 52-week highs and new 52-week lows.
Readings below 50 indicate that there were more new lows than new highs. Readings above 50 indicate that there were more new highs than new lows. 0 indicates there were zero new highs (0% new highs). 100 indicates there was at least 1 new high and no new lows (100% new highs). 50 indicates that new highs and new lows were equal (50% new highs).
Readings consistently above 70 usually coincide with a strong uptrend. Readings consistently below 30 usually coincide with a strong downtrend.
More info:
stockcharts.com
List of my public indicators: bit.ly
List of my app-store indicators: blog.tradingview.com
Just noticed @Greeny has already published this -> Linking it here.

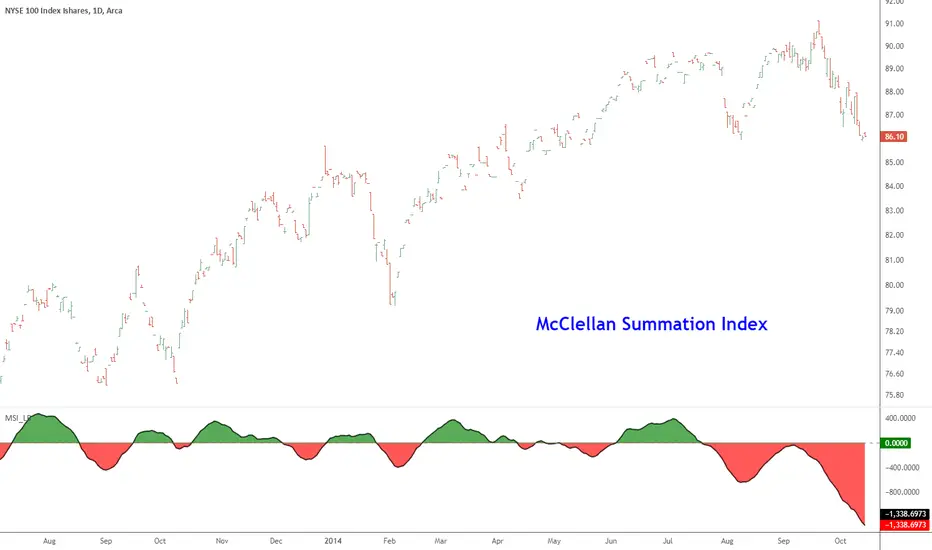
McClellan Summation Index [LazyBear]McClellan Summation Index is a breadth indicator derived from McClellan Oscillator ().
The Summation Index is simply a running total of the McClellan Oscillator values. Even though it is called a Summation Index, the indicator is really an oscillator that fluctuates above/below zero. As such, signals can be derived from bullish/bearish divergences, directional movement and centerline crossovers. A moving average can also be applied to identify upturns and downturns.
Indicator uses the advancing/declining stocks from NYSE by default, but you can change them to any market in the options dialog.
More info:
- www.mcoscillator.com
- stockcharts.com
Complete list of my indicators:
docs.google.com
Stochastic Momentum Index _ UCSgearsThe Stochastic Momentum Index (SMI) was introduced by William Blau in 1993 as a way to clarify the traditional stochastic oscillator. SMI helps you see where the current close has taken place relative to the midpoint of the recent high to low range is based on price change in relation to the range of the price. This is a range based indicator, when used right. It can help momentum changes.
For those looking for help understanding this -
wiki.timetotrade.eu
www.tradingstrategyideas.com
tlc.thinkorswim.com
www.sierrachart.com
UCSgears_Transaction Valuation IndexThis is an indicator, That works great in a wip-saw market range. Would not use this to trade in a breakout.
I am calling it the "Transaction Value Index (UCS_TVI)", The reason is because, it measure where the price currently from the mean trade value.
The cross represents the highest trade value on that day, circle represents the lowest trade value.
In other words, Top and bottom of the candle wicks, in relation to the mean trade value (MTV).
Watchout for Further Updates on Optimizing this indicator.
DO NOT CONFUSE IT WITH FUNDAMENTAL VALUATION, THIS IS PURELY TECHNICAL VALUATION TECHNIQUE
As Usual, Good Luck
List of All my Indicators - www.tradingview.com

Disparity IndexDisparity Index
The related article is copyrighted materialfrom Stocks & Commodities Dec 2009

Relative Momentum Index The Relative Momentum Index (RMI) was developed by Roger Altman. Impressed
with the Relative Strength Index's sensitivity to the number of look-back
periods, yet frustrated with it's inconsistent oscillation between defined
overbought and oversold levels, Mr. Altman added a momentum component to the RSI.
As mentioned, the RMI is a variation of the RSI indicator. Instead of counting
up and down days from close to close as the RSI does, the RMI counts up and down
days from the close relative to the close x-days ago where x is not necessarily
1 as required by the RSI). So as the name of the indicator reflects, "momentum" is
substituted for "strength".

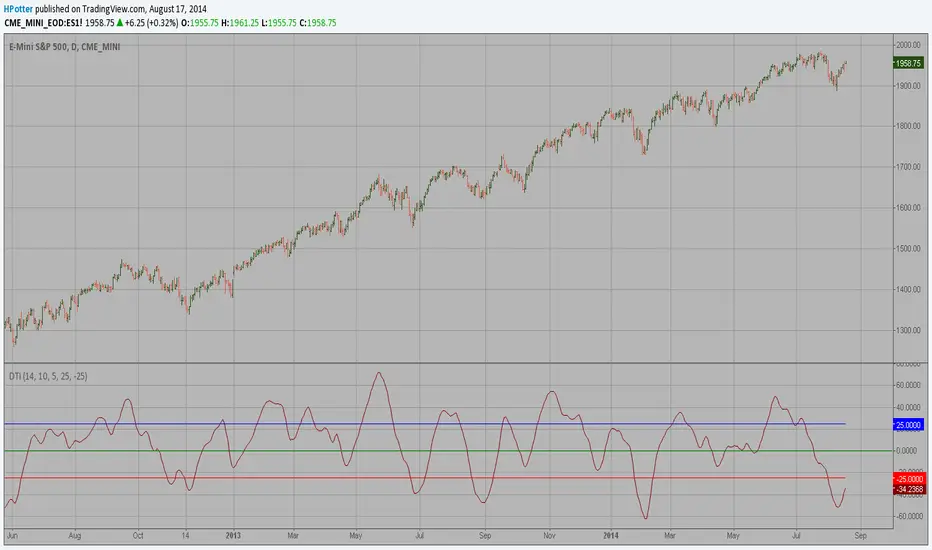
Directional Trend Index (DTI) This technique was described by William Blau in his book "Momentum,
Direction and Divergence" (1995). His book focuses on three key aspects
of trading: momentum, direction and divergence. Blau, who was an electrical
engineer before becoming a trader, thoroughly examines the relationship between
price and momentum in step-by-step examples. From this grounding, he then looks
at the deficiencies in other oscillators and introduces some innovative techniques,
including a fresh twist on Stochastics. On directional issues, he analyzes the
intricacies of ADX and offers a unique approach to help define trending and
non-trending periods.
Directional Trend Index is an indicator similar to DM+ developed by Welles Wilder.
The DM+ (a part of Directional Movement System which includes both DM+ and
DM- indicators) indicator helps determine if a security is "trending." William
Blau added to it a zeroline, relative to which the indicator is deemed positive or
negative. A stable uptrend is a period when the DTI value is positive and rising, a
downtrend when it is negative and falling.
Commodity Selection Index The Commodity Selection Index ("CSI") is a momentum indicator. It was
developed by Welles Wilder and is presented in his book New Concepts in
Technical Trading Systems. The name of the index reflects its primary purpose.
That is, to help select commodities suitable for short-term trading.
A high CSI rating indicates that the commodity has strong trending and volatility
characteristics. The trending characteristics are brought out by the Directional
Movement factor in the calculation--the volatility characteristic by the Average
True Range factor.
Wilder's approach is to trade commodities with high CSI values (relative to other
commodities). Because these commodities are highly volatile, they have the potential
to make the "most money in the shortest period of time." High CSI values imply
trending characteristics which make it easier to trade the security.
The Commodity Selection Index is designed for short-term traders who can handle
the risks associated with highly volatile markets.
