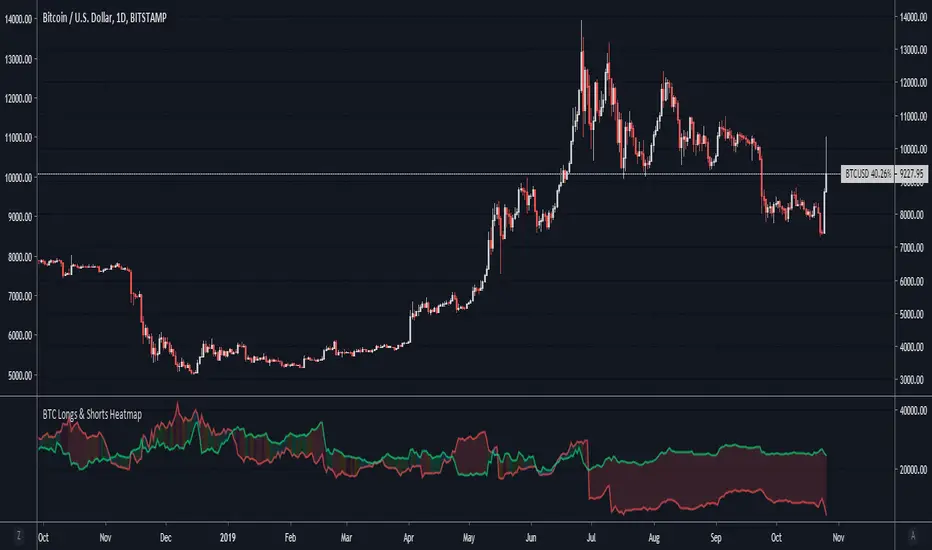
BTC Longs & Shorts HeatmapBitfinex Bitcoin Long and Short positions visualization with colored background.
Original author: @autemox
스크립트에서 "heatmap"에 대해 찾기
Supertrend MTF LAG ISSUEThis script based on
we all use Super trend but it main issue is the lag as it buy too late or sell too late
using Deavaet study of Heat map MTF we can do a little trick
if you look on his study you can see that major signal for example will happen in the time frame before it happen at larger time frame
so in this example if signal at MTF 30 min and signal at MTF 60 min happen at the same time at 2 hours or 4 hours candles then this signal are more likely to be true then random signal at each time frame specific.
since we use shorter time frame on larger time frame we can remove the lag issue that make supertrend not so effective
In this example I set the signal to be MTF 30 +60 om 2 hour TF , can be good also for 4 hour candles..
So you get the signal to close inside the larger candle
now if you want to make on even shorter TF then change the code to 15 and 30 MTF on candles on 1 hour
or 1 and 5 min on 30 min or 15 min


2D HeatmapUse OS22 to take other time slices. User OS3 to shift time phase
Add 5 indicators ontop of each other and scale to left. Set OS2 to (1,2,3,4,5) to get the result shown in the screenshot

Angled Volume Profile [feeble]BETA VERSION
this indicator maps volume as brightness over an SMA. the brightness then fades over time.
It draws 30 bands, so you will need to load multiple instances to get a large picture.
Configure the settings, then copy and paste the indicator, modifying only the vertOffset attribute each time
Patience, bruh. This takes a long time load. Chrome runs it faster than Firefox. ¯\_(ツ)_/¯
Please let me know if you can think of how to optimize it.
Feedback is appreciated is you use it :)
sample with 6 instances:
settings:
useLog: enable if you are using a log graph
rowHeight: resolution of rows.
vertOffset: normally if you have 5 instances, the values will be -2,-1,0,1,2
fadeAmt: how long it takes for volume to fade once it is picked up
volumeMin and Max: the volume range displayed.
volumeResolution: time resolution at which volume data is collected - this is why the fadeAmt is so high, and why the graph runs out of data after a period back
EMA length: its Actually SMA but I wrote it wrong. eg. for a 20 day period on a 15min chart you go ( 20 days x 24 hrs x 4 quarter hours = 1920) - I hope to automate this in a future version :p
